First Results on C production at DANE
Abstract
-hypernuclei are produced and studied, with the FINUDA spectrometer, for the first time at an collider: DANE, the Frascati -factory. The slow negative kaons from decay are stopped in thin (0.2 g/cm2) nuclear targets, and -hypernuclei formation is detected by measuring the momentum of the outgoing . A preliminary analysis on C shows an energy resolution of 1.29 MeV FWHM on the hypernuclear levels, the best obtained so far with magnetic spectrometers at hadron facilities. Capture rates for the ground state and the excited ones are reported, and compared with previous experiments.
PACS: 21.80.+a
keywords:
Hypernuclear spectroscopy, -factoryFINUDA Collaboration
, , , , , , , , , , , , , , , , , , , , , , , , , , , , , , , , , , , , , , , , , , , , , , , , , , , , , , , ,
1 Introduction
Even though the first hypernucleus was identified more than fifty years ago [1], Hypernuclear Physics was systematically studied only in the last decade, in spite of its great interest and discovery potential for nuclear structure, strong and weak interactions and possible quark effects in nuclei. The most recent experiments were performed at AGS (Brookhaven) [2] and at the 12 GeV PS (KEK) [3], and hypernuclei production was based on the strangeness exchange reaction on nuclear targets with in flight and at rest, or on the associated production one.
This experimental scenario led to the idea [4] of performing hypernuclear physics experiments with a dedicated detector (FINUDA) using a source of different from traditional hadron facilities; that is, the -factory DANE at the Frascati National Laboratories of I.N.F.N., Italy [5].
FINUDA (acronym for “FIsica NUcleare a DANE”) can be considered an experiment of third generation in hypernuclear physics. The original design of the FINUDA apparatus and, in particular, the large angle covered for the detection of charged and neutral particles emitted after the formation and decay of hypernuclei, allows for the simultaneous measurement of observables like excitation energy spectra, lifetimes and partial decay widths for mesonic and non-mesonic decay, with high statistics and good energy resolution (better than 1 MeV). Furthermore, these observables can be measured for different targets at the same time, thus reducing systematic errors in comparing properties of different hypernuclei.
The first FINUDA data taking at DANE started in December 2003 and was successfully concluded in March 2004. In the following the first results from the experiment will be reported, which fully confirm the expected capability of FINUDA to perform high quality hypernuclear physics at the DANE collider.
2 The FINUDA Experiment at DANE
DANE (Double Annular -factory for Nice Experiments) consists of two rings, one for electrons and the other for positrons, that overlap in two straight sections where the beams collide. The energy of each beam is 510 MeV in order to produce the (1020) meson in the collisions.
At the luminosity =1032cm-2s-1, the meson is produced at a rate s-1. The branching ratio is and therefore, since the is produced almost at rest, DANE is a source of () pairs/s, collinear, background free and of very low energy ( MeV). The low energy of the kaons is the key-feature for performing hypernuclear physics experiments at the DANE -factory.
The main idea of FINUDA [4, 6, 7] is to slow down to rest the negative kaons from the decay in thin solid targets, so as to study the following formation and decay of hypernuclei produced by the strangeness exchange reaction:
| (1) |
where indicates a target nucleus and the produced hypernucleus. The method of producing hypernuclei via reaction (1) was the standard one with emulsions or bubble chambers in the sixties. A first attempt to use reaction (1) even in a counter experiment was done in 1973; a 12C target was employed and the overall energy resolution was 6 MeV FWHM [8]. A substantial experimental effort with a dedicated apparatus and on several targets was then performed at KEK in the late eighties [9, 10]; however, the instrumental resolution did not exceed 2.4 MeV FWHM.
The use of ’s from a -factory to produce hypernuclei has several advantages when compared to the extracted beams or intense beams [11]. First of all, the low-energy and almost monochromatic emitted from decay can be efficiently stopped in thin targets (0.2 g/cm2). At hadron machines, extracted beams require thick targets (some g/cm2), in order to obtain sufficient event rates. In addition, the uncertainty on the interaction point and the energy straggling of the emitted particles impair the achievable resolution. The same problem occurs in hypernuclear spectroscopy performed via the more efficient () reaction [12]. In FINUDA, furthermore, the use of thin targets along with the low-mass of the spectrometer tracking system permits the detection of charged particles other than pions (mainly ’s and ’s) with a solid angle similar to that of pions, and a threshold as low as MeV/ for protons and MeV/ for deuterons. Finally, the cylindrical symmetry of the interaction region allowed for the construction of a spectrometer of cylindrical shape with a large solid angle which, for the detection of the ’s coming from reaction (1), is larger than sr, therefore much bigger than those available at fixed target machines, typically 100 msr. Such an acceptance, along with the excellent performances of DANE, enables the detection of hypernuclei with a rate of about 80 hypernuclei/hour at =1032 cm-2s-1 (with a 10-3 capture rate).
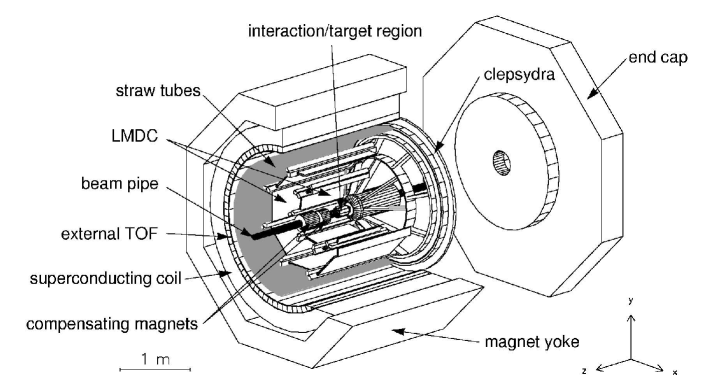
Fig. 1 shows a global view of the apparatus. The layers of the tracker are contained inside a superconducting solenoid, which provides a highly homogeneous (within 2% inside the tracking volume) magnetic field of 1.0 T over a cylindrical volume of 146 cm radius and 211 cm length.
Three main regions can be distinguished inside the FINUDA apparatus.
-
•
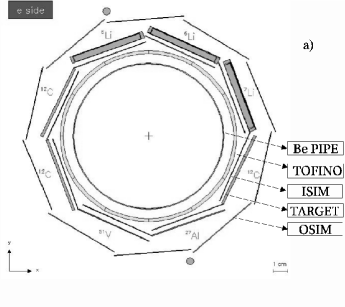
The interaction/target region is shown schematically in fig. 2a). Here, the highly ionizing pairs are detected by a barrel of 12 thin scintillator slabs (dubbed TOFINO for short), surrounding the beam pipe, with a time resolution of ps. The TOFINO barrel is surrounded by an octagonal array of silicon microstrips (ISIM) featuring a spatial resolution m and an energy resolution on for the kaons from decay of 20% [13]. Thin solid target modules are positioned at a distance of a few millimeters on the external side of each element of the octagon. The task of the ISIM detector is the determination of the interaction points of the pairs in the thin targets.
-
•
The external tracking device consists of four different layers of position sensitive detectors. It is arranged in cylindrical symmetry and is immersed in a He atmosphere to reduce the effects of the multiple Coulomb scattering. The trajectories of charged particles coming from the targets and crossing the tracking system are measured by: (i) a first array of ten double-sided silicon microstrip modules (OSIM) placed close to the target elements (see fig. 2a); (ii) two arrays of eight planar low-mass drift chambers (LMDC) filled with a (70%He-30%C4H10) mixture, featuring a spatial resolution m and cm [14]; (iii) a straw tube detector, composed by six layers of longitudinal and stereo tubes, which provide a spatial resolution m and m [15]. The straw tubes are positioned at 1.1 m from the beams interaction point. With the magnetic field set at 1.0 T, the design momentum resolution of the spectrometer, for 270 MeV/c ’s, is =0.4% FWHM. It corresponds to an energy resolution on hypernuclear spectra better than 1.0 MeV. On the other hand, the energy resolution, for the 80 MeV protons emitted in the hypernuclear non-mesonic decay, is 1.6 MeV FWHM.
-
•
The external time of flight barrel (TOFONE) is composed by 72 scintillator slabs, 10 cm thick and 255 cm long, and provides signals for the first level trigger and for the measurement of the time-of-flight of the charged particles, with a time resolution 350 ps. Moreover, it allows for the detection of neutrons following hypernucleus decays with an efficiency of 10%, an angular acceptance of 70% and an energy resolution of 8 MeV FWHM for neutrons of 80 MeV [16].
Further details concerning the design and performances of the FINUDA apparatus can be found in Refs. [17, 18, 19].
 |
 |
An important feature of the FINUDA apparatus (see fig. 2a) is the possibility to host eight different targets close to the interaction region; therefore, the possibility of obtaining data on different hypernuclei at the same time. For the starting run, the following targets were selected [21]: two 6Li (isotopically enriched to 90%), one 7Li (natural isotopic abundance), three 12C, one 27Al and one 51V. Physical motivations for the performed choice are described in Refs. [21, 22].
3 Data taking and apparatus performances
Many experimental tests were performed during the data taking in order to monitor the machine performance as well as the calibrations of the spectrometer. Hereafter the most relevant ones are listed:
-
1.
the luminosity of the DANE collider was continuously evaluated by means of the Bhabha scattering events, and was in agreement (within ) with the values provided by the machine. The top luminosity reached during the run was 0.7 cm-2s-1, with a daily integrated luminosity of about 4 pb-1;
-
2.
the profile of the interaction region was also continuously monitored by FINUDA, and used to control the collider;
-
3.
the energy of the colliding beams was measured on-line via Bhabha scattering and through the reconstruction of the invariant mass, where the ’s are due to the decay.
The trigger selecting hypernucleus formation events requires two fired back-to-back TOFINO slabs, with signal amplitude above an energy threshold accounting for the high ionization of slow kaons, and a fast coincidence on the TOFONE barrel [7]. This allows pairs, together with a fast particle crossing the spectrometer and hitting the external scintillator barrel, to be selected against the physical background coming from the other decays or against fake events generated by the accelerator electromagnetic background.
The reconstruction procedure of the formation point and of the kaon directions and momenta at vertex uses the kaon interaction points in the ISIM modules, identified through their high stopping power. The procedure is based on a two helix algorithm which accounts for the kinematics of the decay, the average value of the mass, the crossing angle (12.5 mrad) of the beams, measured by using Bhabha events, and the geometry of the vertex region. The stopping points of the kaons in the targets are computed by a tracking procedure based on the GEANE package [23], which performs a numerical integration of the trajectory starting from the formation point and the kaon direction and momenta and accounting for the geometrical structure and the material composition of the FINUDA interaction region.
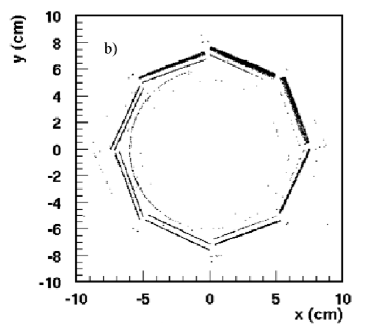
The beam crossing angle determines a small total momentum of the (boost: 12.3 MeV/) directed towards the positive side. This boost adds to the 127 MeV/ average momentum of the kaons from the decay introducing a left-right asymmetry clearly visible in Fig. 2b), which shows the scatter-plot of the reconstructed vs coordinates of the stopping points. The distribution of points on the outer octagon represents the positions of the eight targets, where most of the stop ( of all interactions in the apparatus). A partial accumulation of points also occurs on the left-side ISIM modules (10%). The events corresponding to the ’s stopping in the ISIM modules provide an additional sample in a supplementary silicon target. The remaining density of points partially depicts TOFINO.
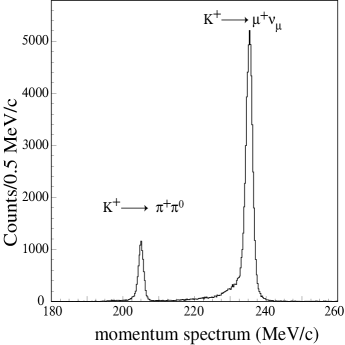
Hypernuclear events are selected by the simultaneous presence of and particles. The ’s enable the tagging and moreover offer the possibility to perform an accurate and continuous in-beam calibration of FINUDA. The positive kaons, stopping in the target array, decay at rest with a mean life of 12.4 ns. The two main two-body decays (B.R.=63.51%) and (21.16%) are a source of monochromatic particles fully crossing the spectrometer, with momenta 235.5 MeV/c for the and and 205.1 MeV/c for the , respectively. The absolute scale of the momenta was determined with a precision better than 200 keV/, even in the simplified hypothesis (applied in the analysis presented here) of a constant magnetic field of 1.0 T, directed along the axis, in the whole tracking volume. This precision can be assumed as the systematic error on the measurement of the particles’ momenta in the range between 200 and 300 MeV/.
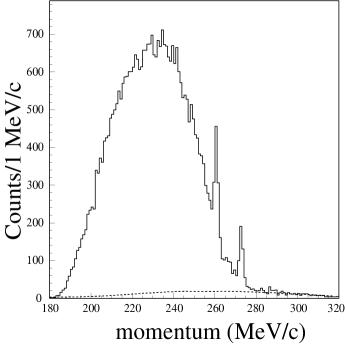
For the present analysis only high quality tracks were selected. Such tracks are emitted in the forward hemisphere, with respect to the direction of the , and cross a minimum amount of materials inside the spectrometer. Fig. 3 shows the momentum distribution of the positive tracks coming from the stopped . The two peaks at 236 MeV/c and 205 MeV/c correspond to the previously mentioned decays. The tails on the left of the two peaks are due to different contributions, the biggest part played by instrumental effects due to the momentum loss of particle crossing the edges of the chambers and their supports. Moreover, in this region two additional decay channels open: the mode (B.R.=4.8%), giving a continuum spectrum of positrons (which cannot be distinguished from ’s) ending at 228 MeV/, and the one (3.2%), which gives again a continuum spectrum with end point at 215 MeV/. By analyzing these different contributions to the peaks shape one can conclude that the asymmetry affects, overall, the gaussian line shape at the level of about 4%. This peak asymmetry was however not considered in the fit of the spectra described in Sec. 4, since other error sources were overwhelming.
From the width of the peak the present momentum resolution of the apparatus can be estimated to be =0.6% FWHM, which corresponds to 1.29 MeV FWHM for the hypernuclear levels in agreement with the results of the hypernuclear spectra reported in the next section. We expect that the momentum resolution of the spectrometer should improve to the design value of 0.4% FWHM once the final detector calibration and alignment will be performed, and the mapped magnetic field will be inserted in the reconstruction and fitting procedure.
4 Results on C spectroscopy. Discussion and conclusions.
In order to evaluate the capabilities of FINUDA to yield relevant spectroscopic parameters, the analysis started from 12C targets. We recall that for C an excitation spectrum with a 1.45 MeV FWHM resolution was recently obtained at KEK using the reaction at 1.05 GeV/ by the E369 Collaboration [12].
The spectra out of only two of the three available 12C targets were added since the third one showed a slight systematic energy displacement, of about 0.5 MeV. The reason of this is under study, and therefore for the current analysis these data are not included. The requirement of high quality tracks (long tracks crossing the whole spectrometer, with a hit on each tracking detector, i.e OSIM, LMDC’s and straw tubes) reduced the analysed data to about the 40% of the whole available sample of events with vertex coming from a 12C target.
The raw momentum spectrum of the coming from the analysed 12C targets is shown in Fig. 4. Different processes produce after absorption and reproduce well the experimental spectra [10]:
-
a) quasi-free and production: , , ;
-
b) quasi-free decay: ;
-
c) quasi-free production: , followed by ;
-
d) two nucleon absorption: , followed by .
All the mentioned reactions were simulated in detail in the FINUDA Monte Carlo program. The simulated events were reconstructed by the same program used for the real events, with the same selection criteria, in order to accurately take into account the geometrical acceptance and the reconstruction efficiency of the apparatus. In particular, the size of the spectrometer and the value of the magnetic field determine an acceptance momentum cut of about 180 MeV/c for four-hits tracks, which excludes most of the reactions producing low energy ’s. However, in the momentum region where the bound states of 12C are expected (beyond MeV/), only process d) is contributing. We remark that both processes c) and d) are due to decay in flight, but the distribution from the process c) is peaked at 190 MeV/, and goes to zero beyond 260 MeV/. The dashed line in Fig. 4 represents the contribution due to process d), normalized to the number of entries in the MeV/ momentum region, beyond the physical region for the production of -hypernuclei via reaction (1).
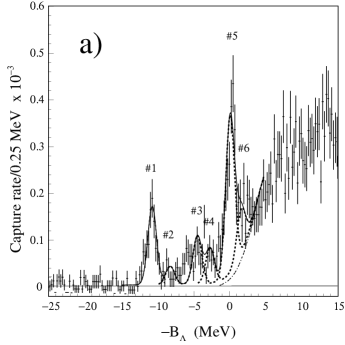
In order to obtain the binding energy distribution the d) process is subtracted from the momentum distribution, and the momenta are converted into binding energies (). The two prominent peaks, as can be seen in Figs. 5a) and b), at around 11 MeV (ground state) and 0 MeV, were already observed in previous experiments [8, 9] and interpreted as and (= nucleon). The experimental energy resolution was determined by fitting the 11 MeV peak with a gaussian curve (), and amounts to 1.29 MeV FWHM. The ground state of C is assumed to be a single state. Indeed, it is known that it consists of a doublet, but theoretical calculations predict splittings of 70 keV [24], 80 keV [25] and 140 keV [26] between them, one order of magnitude smaller than the present instrumental resolution. The peak at about 0. MeV has a more complicated structure, and we tried to disentagle different contributions in the analysis described in the following.
 |
 |
The experimental spectrum closely resembles the one from E369 experiment [12]. This is expected, as the production of hypernuclear states is, in first approximation, determined by the momentum transferred to ’s, which is grossly comparable for both experiments ( MeV/ for FINUDA, MeV/ for E369). The MeV/ difference may account for the different yield of the two main peaks.
The absolute values of the capture rates for the different peaks could be obtained in a simple way by the method of the tagging. Indeed, in the events where the is seen to decay in the and decay modes with the produced or crossing the spectrometer and hitting the TOFONE barrel, we are sure the trigger condition on the prompt TOFONE coincidence has been satisfied by the charged products of the decay.
Hence, in these events triggered by the decay products of the , the interactions of the corresponding in the targets are observed without any trigger bias. Using this subsample of events, the number of stopping in the targets can be counted directly and the number of produced by the interactions can be accurately determined by only correcting for the apparatus acceptance for of selected momentum and for detector efficiency. The acceptance is calculated using the FINUDA Monte Carlo and the detector efficiency is determined by calibration data.
The value obtained for the C ground state formation is /(stopped ). It agrees very well with the value /(stopped measured at KEK [10]; we recall that the first generation CERN experiment reported the value /(stopped ) [8].
In between the two main peaks, there are also indications of other states produced with weaker strength. In order to reproduce, at least qualitatively, this spectrum six gaussian functions were used, centered at the values reported in Ref. [12]; the widths were fixed, for all of them, to MeV, corresponding to the experimental resolution. The abscissa scale is affected only by a scale error of keV. The result of this fit is shown in Fig. 5a).
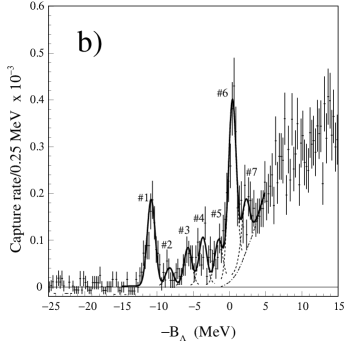
The spectrum is not well reproduced, the resulting reduced is 3.8 (for 64 d.o.f.), and in particular the region is poorly fitted. The capture rates for these different contributions normalized to the ground state capture rate are reported in the second column of the upper part of Table 1. A better = 2.3 is obtained by adding a further contribution, and leaving the positions of the seven levels free (57 d.o.f.). Their values are reported in the second column of the lower part of Tab. 1. The capture rates for these different contributions are again normalized to the capture rate for the C ground state formation. The result of the fit is shown in Fig. 5b). A contribution from the quasi-free -production, starting from and properly smeared by taking into account the instrumental resolution, was included in both fits.
| Peak number | Capture rate/(stopped ) | |
|---|---|---|
| (Fixed at E369 values) | ||
| 1 | ||
| 2 | ||
| 3 | ||
| 4 | ||
| 5 | ||
| 6 | ||
| Peak number | Capture rate/(stopped ) | |
| 1 | ||
| 2 | ||
| 3 | ||
| 4 | ||
| 5 | ||
| 6 | ||
| 7 |
The peaks and can be attributed to the 11C core excited states at 2.00 and 4.80 MeV. The excitation of these states was expected in several theoretical calculations [27, 28]; their energies may be sensitive to the - interaction matrix elements. However, the peak 4 and a newly observed peak 5 are not explained with such a simple way. Excluding from the fit the peak 5 the value for worsened to 3.3. There exist several positive-parity excited states of the 11C core in this energy region which could contribute the these structures [28]. It can be noticed that the integrated strength for the excitation of all these weakly excited states compared to that of the two main peaks is more than twice larger than the one reported by E369.
The sum of the capture rates for the MeV and MeV states is /(stopped , and agrees with the KEK result /(stopped [10], in which the contributions for the two states were not resolved. The CERN experiment [8] reports /(stopped . In the present analysis these states are indeed resolved, though, inevitably, strongly correlated in our fit. It is however remarkable that the relative intensities for the contributions at MeV and MeV are close to the values found by Dalitz et al. [29] in an emulsion experiment.
Theoretical calculations for the ground state formation quote the values /(stopped ) [30], /(stopped ) [31] and /(stopped ) [32]. Analogous calculations for the capture rate leading to states in which the is in a state quote [33], respectively, /(stopped ) according to the theoretical prediction of Ref. [30], and /(stopped ) following Ref. [32]. As general remark it may be noticed that our measured values are larger by factors as compared with theoretical predictions. Finally, the pattern of the relative strength for the excited-core states is also significantly larger than the theoretical calculation reported in Ref. [34].
In conclusion, the method of producing hypernuclei stopping in thin nuclear targets the low energy from decay at a -factory was proved to work, and may be used to perform accurate measurements on many hypernuclei observables. A first analysis allowed to achieve this purpose and to obtain also some interesting new physical information.
5 Acknowledgements
We are greatly indebted to Dr. S. Bertolucci, former Director of LNF, for his continuous encouragement and help. Dr. P. Raimondi and the DANE machine staff are warmly acknowledged for their very skillful handling of the DANE collider.
The excellent and qualified contribution of the whole FINUDA technical staff, at all stages of the experiment setting-up, is deeply appreciated.
References
- [1] Danysz M. and Pniewski J., Phil. Mag. 44 (1953), 348
- [2] See, e.g., R. Chrien, Nucl. Phys. A691 (2001), 501c
- [3] See, e.g., Nagae T., in Proceedings Int. School of Physics “E. Fermi”, Course CLVIII, to be published; Outa H., ibidem
- [4] Bressani T., in Proc. Workshop on Physics and Detectors for DANE, April 9-12, 1991, Frascati, Italy, edited by Pancheri G. (Laboratori Nazionali di Frascati), p. 475
-
[5]
Preger M. for the DANE Team,
in “Status of DANE”,
HEACC2001 - 18th International Conference on High Energy
Accelerators, March 26-30, 2001, Tsukuba, Japan;
see also http://www.lnf.infn.it/acceleratori/dafne - [6] The FINUDA Collaboration, M. Agnello et al., “FINUDA, a detector for Nuclear Physics at DANE”, LNF Internal Report, LNF-93/021(IR) (1993)
- [7] The FINUDA Collaboration, M. Agnello et al. “FINUDA Technical Report”, LNF Internal Report, LNF-95/024(IR) (1995)
- [8] Faessler A.M. et al., Phys. Lett. 46B (1973), 468
- [9] Sakaguchi A. et al., Phys. Rev. C34 (1991), 73; Tamura H. et al., Nuovo Cim. A102 (1989), 575
- [10] Tamura H. et al., Prog. Th. Phys. Suppl. 117 (1994), 1
- [11] Hungerford E.V., in Proceedings Int. School of Physics “E. Fermi”, Course CLVIII, to be published
- [12] Hotchi H. et al., Phys. Rev. C64 (2001), 044302
- [13] Bottan P. et al., Nucl. Instr. Methods A427 (1999), 423
- [14] Agnello M. et al., Nucl. Instr. Methods A385 (1997), 58
- [15] Benussi L. et al., Nucl. Instr. Methods A361 (1995), 180; Benussi L. et al., Nucl. Instr. Methods A419 (1998), 648
- [16] Pantaleo A. et al., Nucl. Instr. Methods A545 (2005), 593
- [17] Zenoni A., in Physics and Detectors at DANE, Frascati Physics Series Vol. XVI (1999), edited by Bianco S. et al., p. 739
- [18] Gianotti P., Nucl. Phys. A691 (2001), 483c
- [19] Zenoni A. and Gianotti P., Europhysics News 33/5 (2002), 157
- [20] Bressani T., in Proc. Int. School of Physics “E. Fermi”, Course CLIII, edited by Molinari A. et al., IOS Press, Amsterdam (2003) 323
- [21] Bressani T., Acta Phys. Pol. B35 (2004), 959
- [22] Zenoni A., in Proceedings Int. School of Physics “E. Fermi”, Course CLVIII, to be published
- [23] Innocente V. et al., GEANE: Average Tracking and Error Propagation Package, CERN Program Library, W5013-E (1991)
- [24] Millener D.J. et al., Nucl. Phys. A691 (2001), 93
- [25] Fetisov V.N. et al., Z. Phys. A339 (1991), 399
- [26] Itonaga K. et al., Prog. Theor. Phys. Suppl. 117 (1994), 17
- [27] Gal. A, in Proc. Workshop on Physics and Detectors for DANE ’95, Frascati Physics Series Vol. IV (1995), edited by R. Baldini et al., p. 315
- [28] Motoba T., Nucl. Phys. A639 (1998), 135c
- [29] Dalitz R.H. et al., Nucl. Phys. A450 (1986), 311c
- [30] Gal A. and Klieb L., Phys. Rev. C34 (1986), 956
- [31] Cieply A. et al., Nucl. Phys. A696 (2001), 173
- [32] Matsuyama A. and Yazaki K., Nucl. Phys. A477 (1988), 6
- [33] Ahmed M.W. et al., Phys. Rev. C68 (2003), 064004
- [34] Itonaga K. et al., Prog. Theor. Phys. 84 (1990), 291