Scaling properties of azimuthal anisotropy of mesons and baryons at RHIC
Abstract
Detailed measurements of the azimuthal anisotropy () for identified charged particles are reported as a function of transverse momentum () and centrality for Au+Au collisions at =200 GeV. The measurements indicate clear evidence for eccentricity and particle flavor scaling over a broad range of centralities and transverse rapidity , indicating a hydrodynamical origin of the fine structure of azimuthal anisotropy at RHIC. The observed scaling supports the picture of a suddenly hadronizing (recombining) fluid of quarks. An apparent breaking of flavor scaling at relatively large values of points to an important change in the mechanism for particle emission.
1 Introduction
During the early stages of an ultra-relativistic heavy-ion collision, an extremely high energy density system, possibly consisting of a new phase of nuclear matter, is expected to be formed [1, 2, 3, 4, 5]. The dynamical evolution of this matter is predicted to reflect its properties [1, 2, 3]. Consequently, much effort is currently centered on the study of reaction dynamics at the Relativistic Heavy Ion Collider (RHIC). Azimuthal correlation measurements constitute an important probe for reaction dynamics. They serve as a “barometric sensor” for pressure gradients developed in the collision and hence yield insight into crucial issues of thermalization and the equation of state (EOS) [6, 7, 8]. They provide important constraints for the density of the medium and the effective energy loss of partons which traverse it [9, 10]. They can even provide valuable information on the gluon saturation scale in the nucleus [11].
Azimuthal correlation measurements show significant harmonic strength at mid-rapidity with characteristic dependencies on and centrality [12, 13, 14, 15]. The anisotropy of this harmonic pattern is typically characterized by the second order Fourier coefficient,
| (1) |
where represents the azimuthal emission angle of an emitted particle and is the azimuth of the reaction plane. The brackets denote statistical averaging over particles and events. A large amount of available data for Au+Au collisions at = 62.4, 130, and 200 GeV [12, 13, 15, 16, 17] indicate that the magnitude and trends of (for GeV/) are under-predicted by hadronic cascade models supplemented with string dynamics [18], but are well reproduced by models which incorporate hydrodynamic flow [1, 7]. This has been interpreted as evidence for the production of a thermalized state of partonic matter [1, 2, 3]. If this is indeed the case, then the fine structure of azimuthal anisotropy (ie. its detailed dependence on centrality, transverse momentum, particle type, higher harmonics, etc) should reflect the scaling “laws” predicted by ideal hydrodynamics.
In this work we use detailed differential measurements to test for such scaling “laws” and the onset of competing mechanisms.
2 Hydrodynamic scaling
An important scaling prediction of hydrodynamic theory is exemplified by the exact analytic hydro solutions [19] exploited in the Buda-Lund model [20]. For harmonic flow, the model gives:
| (2) |
where are modified Bessel-functions, is an average of the rapidity dependent transverse mass (at mid-rapidity, ), and and are direction ( and ) dependent slope parameters:
| (3) | |||||
| (4) |
Here, and gives the transverse expansion rate of the fireball at freeze-out, and is its transverse temperature inhomogeneity, characterized by the temperature at its center , and at its surface . The important prediction of Eq. 2 is that the relatively complicated fine structure of azimuthal anisotropy can be scaled to a single function. An illustration of this fact can be made for particle flavor scaling via substitution of the transverse rapidity [21], in Eq. 2 to give
| (5) |
where, k1, k2, k3… are largely governed by the expansion rate. Close inspection of the leading term in Eq. 5 indicates that for different particle species should scale with . Here is a mass dependent factor which is for relatively heavy particles. It is straightforward to show that hydrodynamics also predicts that should scale with the spatial eccentricity , of the overlap between the two colliding gold nuclei and the higher harmonic .
3 Analysis
The present analysis is based on M minimum bias Au+Au events obtained with the PHENIX detector at = 200 GeV during the second running period (2002) at RHIC. Charged tracks were detected in the east and west central arms of PHENIX [24, 26], each of which subtends 90∘ in azimuth , and units of pseudo-rapidity . Track reconstruction was accomplished at each collision energy via pattern recognition using a drift chamber (DC) followed by two layers of multi-wire proportional chambers with pad readout (PC1 and PC3) located at radii of 2 m, 2.5 m and 5 m respectively [24, 26]. The collision vertex along the beam direction was constrained to be within 30 cm. A confirmation hit within a matching window was required in PC3 and the electromagnetic calorimeter (EMC PbSc) or the time-of-flight detector (TOF), to eliminate most albedo, conversions, and decays. Particle momenta were measured with a resolution of (GeV/).
Event centralities were obtained via a series of cuts in the space of BBC versus ZDC analog response; they reflect percentile cuts on the total interaction cross section [25]. Estimates for the number of participant nucleons Npart, were also made for each of these cuts following the Glauber-based model detailed in Ref. [13].
In this analysis the combination of the TOF detector and six sectors of the (EMC PbSc) was used to identify charged particles. Particle time-of-flight was measured using the TOF ( or EMC ) and the collision time defined by beam counters (BBC). A timing resolution of 120 ps and 370-400 ps was obtained for the TOF and the EMC (PbSc) respectively. This allowed meson ( , K± ) and baryon ( p , ) separation up to a 3.5 GeV/c with the TOF detector and up to 2.5 GeV/c with the (EMC PbSc).
The differential measurements were obtained via the reaction plane technique which correlates the azimuthal angles of charged tracks detected in the central arms with the azimuth of an estimated event plane , determined via hits in the North and South BBC’s located at [15, 27]. Due the large rapidity gap ( units) between the particles used for reaction plane determination and the mid-rapidity particles correlated with this plane, one expects that the latter correlations are less influenced by non-flow contributions especially for GeV/. The estimated resolution of the combined reaction plane from both BBC’s [15, 27] has an average of 0.33 over centrality with a maximum of about 0.42 for Au+Au collisions at = 200 GeV. Thus, the estimated correction factor, which is the inverse of the resolution for the combined reaction plane, ranges from 2.4 to 5.0.
3.1 results
Figures 1 and 2 summarize the centrality and dependence of for charged mesons( , K± ) and baryons ( p + ) detected in the EMC+TOF respectively.
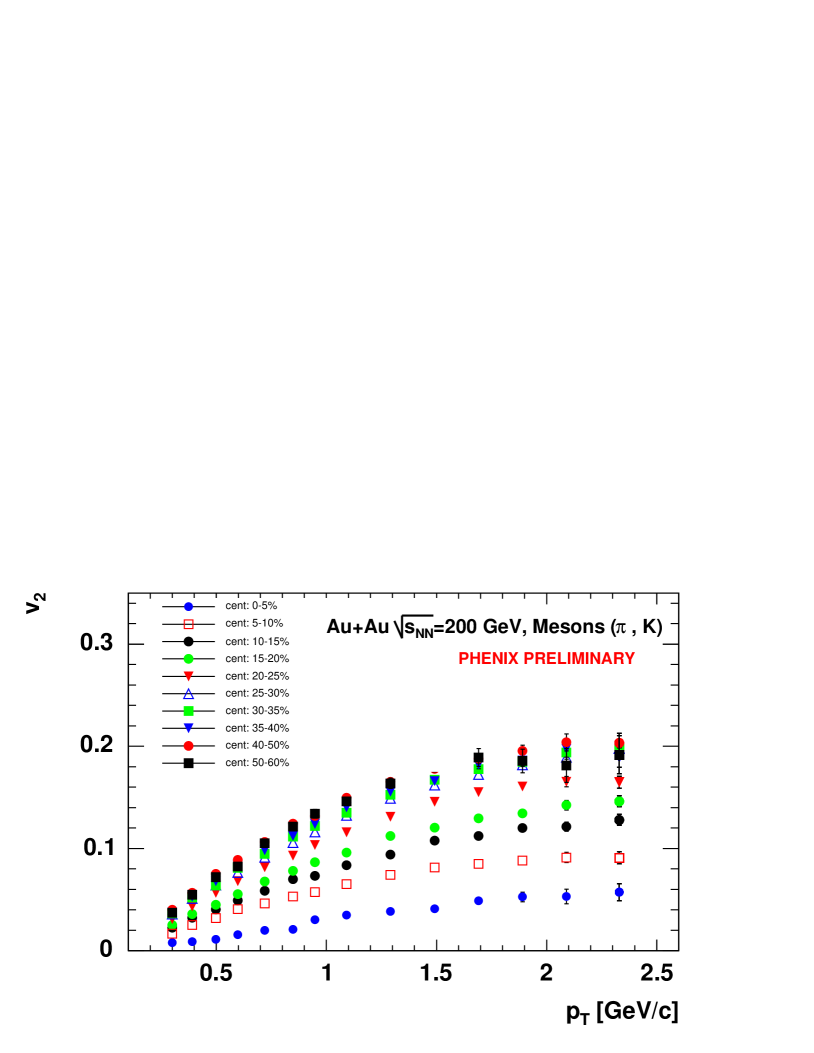

They give an excellent overview of the the evolution of as centrality and are varied. The results shown for protons and anti-protons give an especially good view of the evolution away from the well know quadratic dependence of (which is also observed in very central collisions for these data) as the collisions become more peripheral. Such a dependence could result from changes in the freeze-out temperatures and/or the radial flow velocity as the collisions become more peripheral.
3.2 Eccentricity scaling
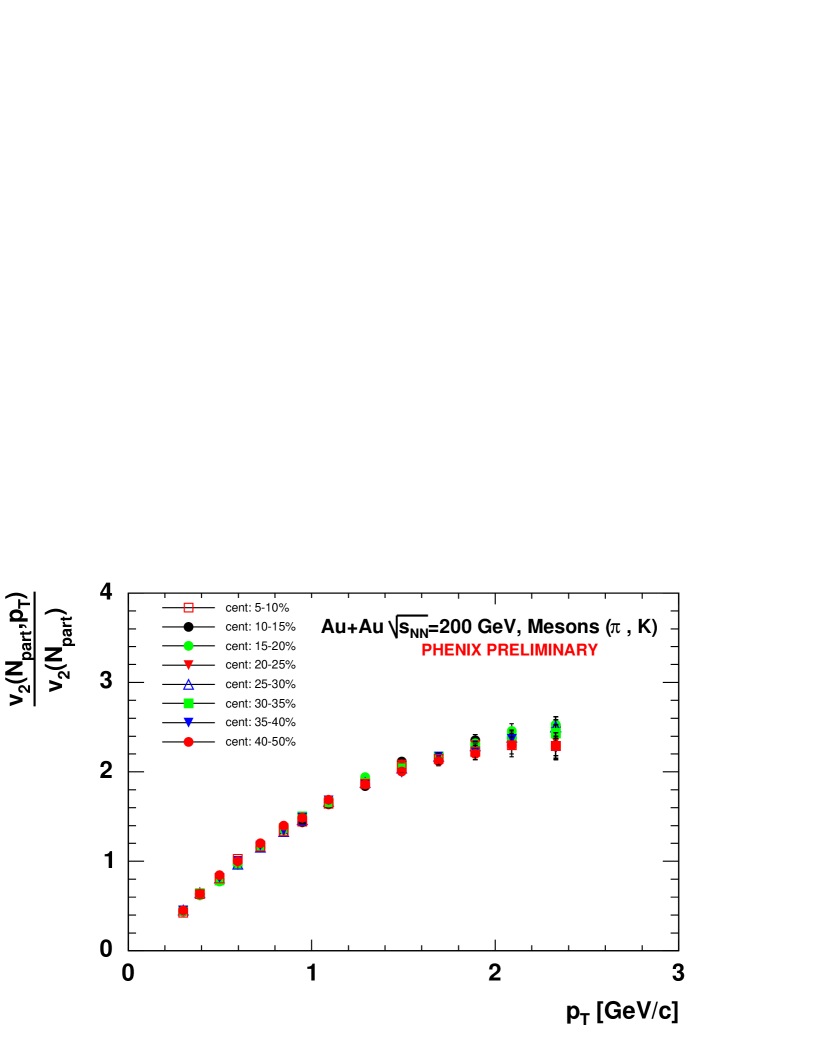
As indicated earlier, hydrodynamics [23] predicts eccentricity scaling of the azimuthal anisotropy. To test for this scaling, one can divide the values obtained at a given centrality by the eccentricity obtained from a Glauber-based calculation obtained for the same centrality [13]. Alternatively, one can simply divide the differential anisotropy obtained at a given centrality by the integrated value for the same centrality selection . The underlying idea here is that the integral flow is monotonic and linearly related to the eccentricity over a broad range of centralities [22]. Another advantage of this approach is that the ratio / gives a scale invariant variable which automatically reduces the systematic errors associated with an eccentricity evaluation, and the reaction plane resolution.
Fig. 3 shows the v2 of charged mesons obtained for different centralities scaled by the value of the integral flow obtained for each of these centralities. The figure shows essentially perfect scaling for mesons as would be expected for a process driven largely by the eccentricity of the overlap region of the two colliding nuclei.
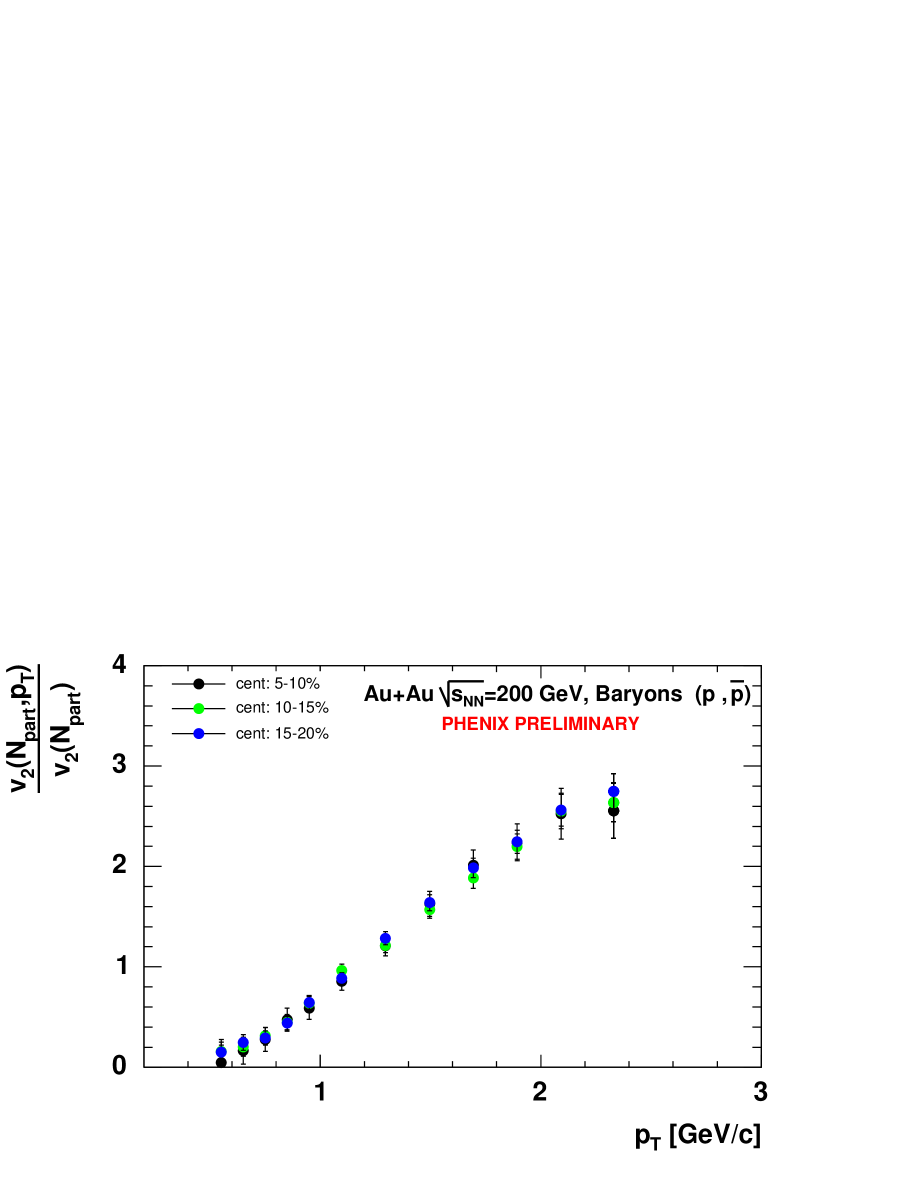
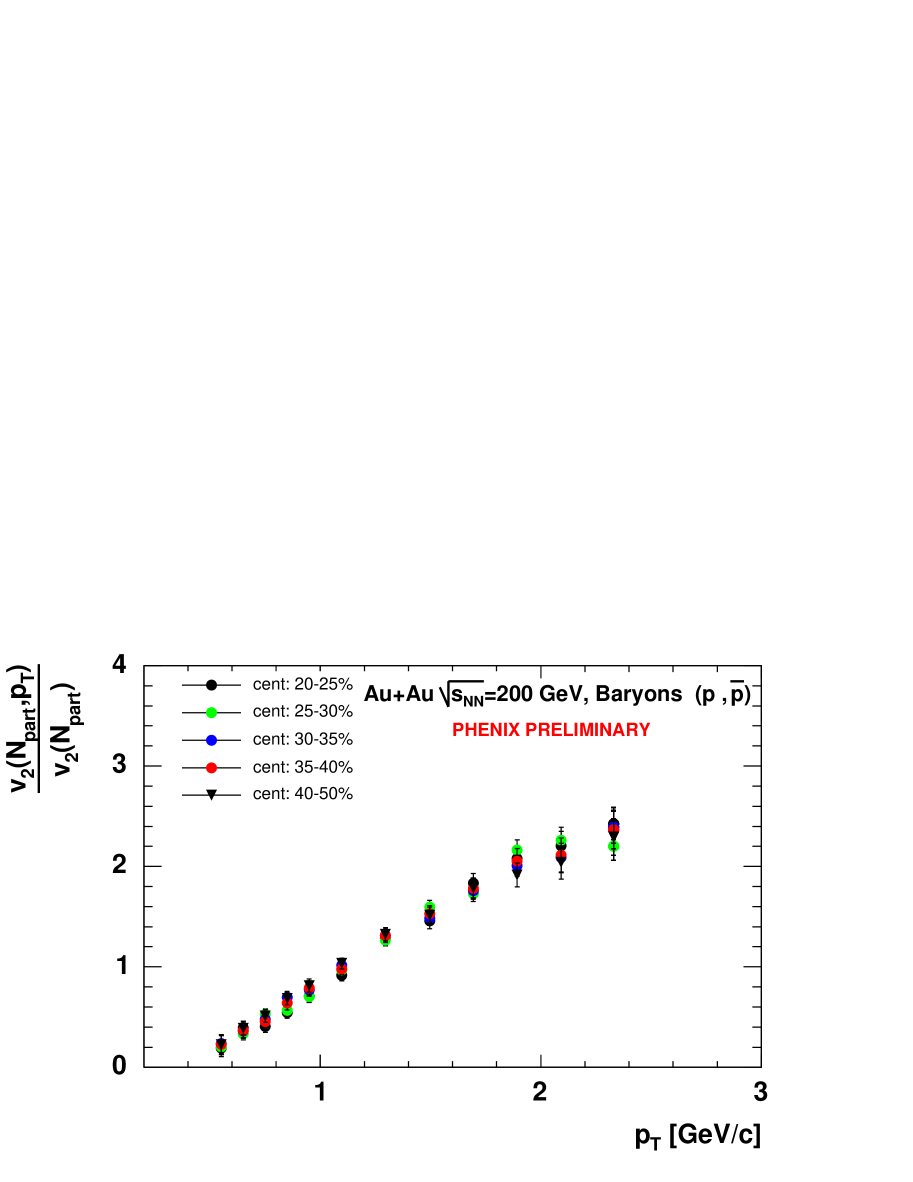
The results of a similar scaling test for baryons are shown in Fig. 4. Despite a continuous evolution in the shape of v2 vs with centrality, they indicate a relatively good scaling for the two centrality ranges: 0-20% ( left panel ) and 20-50% ( right panel ).
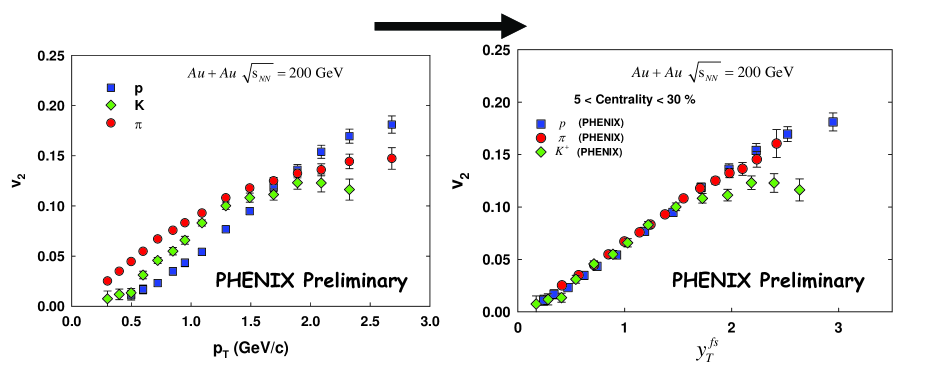
3.3 Flavor scaling
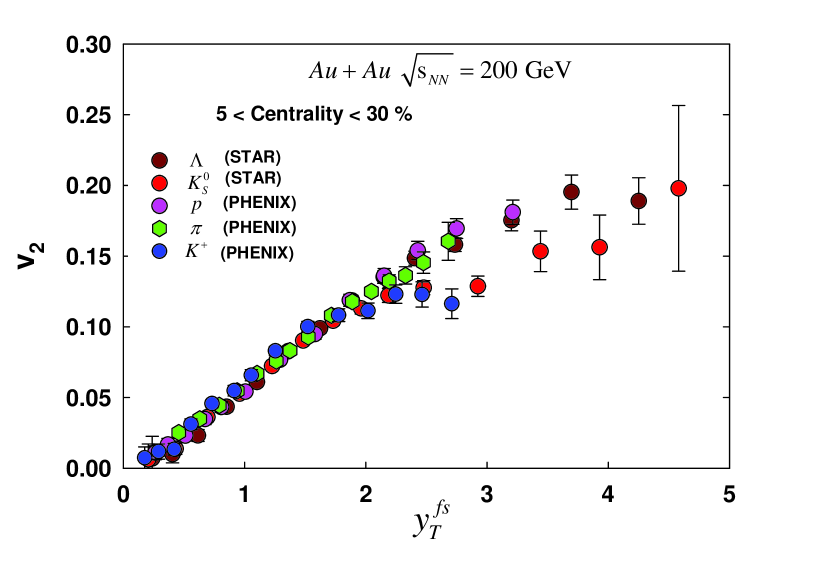
Following Eq. 5, the scaling variable , was used to investigate flavor scaling. The results of such a test is summarized in Fig. 5. The left panel of the figure shows a comparison of for protons, kaons and pions measured with the TOF detector for the centrality selection 5-30%. The characteristic flavor dependence of is cleanly evidenced by these data, ie. mass ordering at low momentum and a reversal of the magnitudes of the values for baryons and mesons for 1.8-2.0 GeV/c. The right panel of Fig. 5 and Fig. 6 show that very good scaling of is achieved with in accordance with the predictions of hydrodynamics. Fig. 6 gives an illustration of y scaling for combined results which include the neutral kaons and lambda hyperons measured by the STAR collaboration. The latter were obtained in Au+Au collisions at =200 GeV for the same centrality selection [16]. Although the data shown in Fig. 6 indicate rather good scaling for all measured particles over a broad range of y, one can see clear evidence for a break in this scaling for y. Such a break could be signaling a change in mechanism for high particles or a break down of ideal hydrodynamic flow.
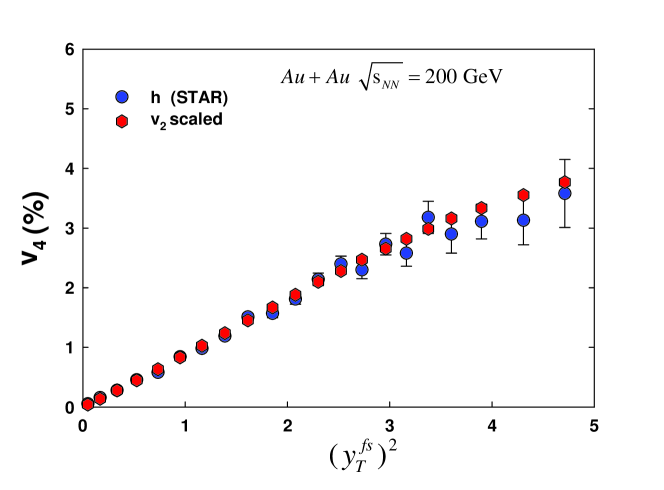
3.4 Higher harmonic scaling
As was pointed out earlier, ideal hydrodynamics [20] gives predicts a straightforward scaling relationship between the second harmonic and the higher harmonics of azimuthal anisotropy ( , , …). It is easy to show that the leading term of the relationship between and can can be expressed as
| (6) |
The measurement of the higher harmonics of azimuthal anisotropy are not available in PHENIX ( ongoing ). However, we can test the predicted scaling relationship between and via data published by the STAR collaboration [28, 29]. Figure 7 shows the dependence of for charged particles from Au+Au collisions at =200 GeV and values scaled according to Eq. 6. The figure indicates rather good agreement between the measured values and scaled values over a broad range in .
4 Summary and Conclusions
In summary detailed measurements of the fine structure of elliptic flow in Au+Au collisions at =200 GeV measured by PHENIX collaboration at RHIC are presented. They show eccentricity scaling and flavor scaling over a broad range of centralities and particle flavors. This observed scaling gives strong support for essentially ideal hydrodynamical flow at RHIC. The observed scaling also supports the picture of a suddenly hadronizing (recombining) fluid of quarks.
Acknowledgment(s)
The author thanks R.A. Lacey, M. Csanád and T. Csörgő for stimulating discussions.
References
- [1] E.V. Shuryak,(2002) [hep-ph/0405066].
- [2] M. Gyulassy and L. McLerran, Nucl. Phys. A750 (2005) 30.
- [3] B. Muller,(2004) [nucl-th/0404015].
- [4] Proc. of Quark Matter 2004, J. Phys. G: Nucl. Part. Phys 30, (2004)
- [5] K. Adcox et al., nucl-ex/0410003
- [6] J. Y. Ollitrault, Phys. Rev. D 46, (1992) 229
- [7] P. F. Kolb et al, Nucl. Phys. A 696, (2001) 197
- [8] T. Hirano and Y. Nara, J. Phys. G 30, (2004) S1139
- [9] M. Gyulassy, I. Vitev and X. N. Wang,Phys. Rev. Lett. 86,(2001) 2537
- [10] D. Molnar and M. Gyulassy, Nucl. Phys. A 697 (2002) 495
- [11] Y. V. Kovchegov and K. L. Tuchin,Nucl. Phys. A 708 (2002) 413
- [12] C. Adler et al, Phys. Rev. Lett. 87, (2001) 182301
- [13] K. Adcox et al., Phys. Rev. Lett. 89 (2002) 212301
- [14] N. N. Ajitanand et al, Nucl. Phys. A 715 (2003) 765
- [15] S.S. Adler et al, Phys. Rev. Lett. 91 (2003) 182301.
- [16] J. Adams et al, Phys. Rev. Lett. 92,(2004) 052302
- [17] S.S. Adler et al, nucl-ex/0411040
- [18] M. Bleicher and H. Stocker, Phys. Lett. B 526 (2002) 309
- [19] T. Csörgő et al, Phys. Rev. C 67, (2003) 034904
- [20] M. Csanád, T. Csörgő and B. Lörstad Nucl. Phys. A 742 (2004) 80
- [21] M. Csanád, T. Csörgő, private communication (2004)
- [22] H. Heiselberg and A. Levi, Phys. Rev. C 59 (1999) 2716
- [23] P. F. Kolb and U. Heinz, ’Quark Gluon Plasma 3’. Editors: R.C. Hwa and X.N. Wang, World Scientific, Singapore., nucl-th/0305084
- [24] K. Adcox et al.,Nucl. Instrum. Meth. A 499 (2003) 469
- [25] K. Adcox et al. Phys. Rev. C 69 (2004) 024904
- [26] S. S. Adler et al., Phys. Rev. C 69, (2004) 034909
- [27] S.S. Adler et al, nucl-ex/0502009
- [28] Phys. Rev. Lett. 92 (2004) 062301
- [29] J. Adams et al. (2004) nucl-ex/0409033.