Comment on “Quantum Opacity, the RHIC HBT Puzzle, and the Chiral Phase Transition”
In a recent Letter, Cramer, Miller, Wu and Yoon Cramer and Miller (2000) (CMWY) presented a model based on a relativistic quantum mechanical treatment of opacity and refractive effects on momentum correlations between pairs of identical particles and particle transverse momentum () spectra. The values of the ten model parameters were obtained from a simultaneous fit to the HBT radii and pion spectra measured for central Au+Au collisions at 200 GeV. CMWY conclude from the fitted values of their model parameters that the data are consistent with the emission of pions from a dense medium in which chiral symmetry has been restored. In addition, the authors provide predictions of the momentum dependence of the HBT radii and pion spectra in the region below 200 MeV/c. However, the authors chose not to compare their model predictions with the published experimental data for pion yields at very low obtained using the PHOBOS detector at RHIC. The purpose of this Comment is to make the comparison of the CMWY model predictions with the PHOBOS data.
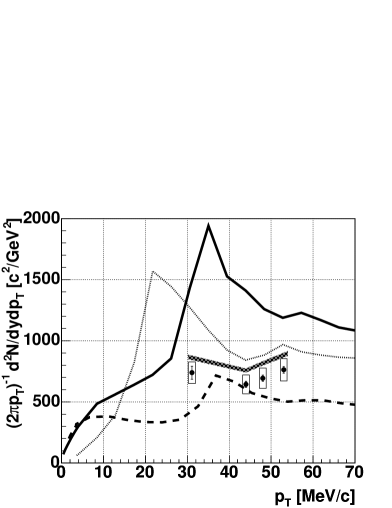
The PHOBOS experiment has a unique capability of measuring charged particles down to very low . The results Back et al. (2004) reach as low as 30 MeV/c for charged pions, and cover the region where the CMWY model predicted notable structure in the pion spectrum. The published model predictions are shown as a dashed curve in Fig. 1. However, in the original paper Cramer and Miller (2000) there was an error in the representation of the STAR pion momentum spectra Adams et al. (2004), consequently leading to the extraction of incorrect values of the model parameters. As a result, the dashed curve, shown in Fig. 1, disagrees with the STAR data at higher . This mistake was pointed out to CMWY by the authors of this comment and, as a result, a new set of model predictions for the spectral behavior at very low transverse momenta was generated Cramer et al. (2004). The corrected model predictions, shown by a dotted curve in Fig. 1, differ significantly from those published in Cramer and Miller (2000). More recently, an alternative fit was performed in which the pion momentum distribution used in the fit was modified “to remove from the spectrum those pions that did not participate in the Bose-Einstein symmetrization” Cramer et al. (2004). The results from this version of the fit are shown as the solid curve in Fig. 1. It is clear that the predicted yield at low is very sensitive to the values of the parameters and the details of the model.
The low-transverse momentum charged pion yields, measured by PHOBOS Back et al. (2004), are overlayed on the model curves in Fig. 1. Since our analysis of particle production in this momentum region does not allow for separation of positive and negative pions, the invariant yields measured for charged pions are divided by 2. It should be noted that our results correspond to the 15% most central Au+Au collisions. The centrality of the predictions is not clearly specified, but we infer from the data shown that they are for the 5% most central collisions. The number of pions per event is expected to be higher for more central data. Thus, imposing a more stringent centrality selection leads to yields higher than those measured by PHOBOS. One can roughly estimate the size of this increase from the spectra measured by PHENIX at higher for centrality bins of 0-5% and 0-15% Adler et al. (2003) or from the centrality dependence of the integrated charged particle yields measured by PHOBOS Back et al. (2003). Both estimates give scaling factors in a range from 15 to 20%. Interpolation of the STAR published data at higher Adams et al. (2004) for centrality bins of 0-10% and 0-20% suggests a similar increase. Multiplying our measured points by factors of 1.15 to 1.20 gives the thick crossed curve shown in Fig. 1.
It is clear that it would be best to test models, such as those discussed here, in a range of centralities. This requires more central data, which will be provided by PHOBOS, as well as model calculations for less central collisions. We conclude that the low pion yields uniquely measured by PHOBOS provide valuable information for evaluating models of the dense medium created in heavy ion collisions at RHIC energies.
PHOBOS Collaboration:
B.B.Back1,
M.D.Baker2,
M.Ballintijn4,
D.S.Barton2,
R.R.Betts6,
A.A.Bickley7,
R.Bindel7,
A.Budzanowski3,
W.Busza4,
A.Carroll2,
M.P.Decowski4,
E.García6,
N.George1,2,
K.Gulbrandsen4,
S.Gushue2,
C.Halliwell6,
J.Hamblen8,
G.A.Heintzelman2,
C.Henderson4,
D.J.Hofman6,
R.S.Hollis6,
R.Hołyński3,
B.Holzman2,
A.Iordanova6,
E.Johnson8,
J.L.Kane4,
J.Katzy4,6,
N.Khan8,
W.Kucewicz6,
P.Kulinich4,
C.M.Kuo5,
W.T.Lin5,
S.Manly8,
D.McLeod6,
A.C.Mignerey7,
R.Nouicer6,
A.Olszewski3,
R.Pak2,
I.C.Park8,
H.Pernegger4,
C.Reed4,
L.P.Remsberg2,
M.Reuter6,
C.Roland4,
G.Roland4,
L.Rosenberg4,
J.Sagerer6,
P.Sarin4,
P.Sawicki3,
W.Skulski8,
S.G.Steadman4,
P.Steinberg2,
G.S.F.Stephans4,
A.Sukhanov2,
J.-L.Tang5,
A.Trzupek3,
C.Vale4,
G.J.van Nieuwenhuizen4,
R.Verdier4,
F.L.H.Wolfs8,
B.Wosiek3,
K.Woźniak3,
A.H.Wuosmaa1,
B.Wysłouch4
1 Argonne National Laboratory, Argonne, IL 60439
2 Brookhaven National Laboratory, Upton, NY 11973
3 Institute of Nuclear Physics PAN, Kraków, Poland
4 Massachusetts Institute of Technology, Cambridge, MA 02139
5 National Central University, Chung-Li, Taiwan
6 University of Illinois at Chicago, Chicago, IL 60607
7 University of Maryland, College Park, MD 20742
8 University of Rochester, Rochester, NY 14627
References
- Cramer and Miller (2000) J. G. Cramer, G. A. Miller, J. M. S. Wu, and J. Yoon, Phys. Rev. Lett. 94, 102302 (2005).
- Back et al. (2004) B. B. Back et al., Phys. Rev. C70, 051901(R) (2004).
- Adams et al. (2004) J. Adams et al., Phys. Rev. Lett. 92, 112301 (2004).
- Cramer et al. (2004) J. G. Cramer and G. A. Miller, private communication.
- Adler et al. (2003) S. S. Adler et al., Phys. Rev. C69, 034909 (2004).
- Back et al. (2003) B. B. Back et al., Phys. Rev. C70, 021902(R) (2004).