e+e--pair production in Pb-Au collisions at 158 GeV per nucleon
Abstract
We present the combined results on electron-pair production in 158 GeV/n Pb-Au (= 17.2 GeV) collisions taken at the CERN SPS in 1995 and 1996, and give a detailed account of the data analysis. The enhancement over the reference of neutral meson decays amounts to a factor of 2.31 for semi-central collisions (28 ) when yields are integrated over 200 MeV/ in invariant mass. The measured yield, its stronger-than-linear scaling with , and the dominance of low pair strongly suggest an interpretation as thermal radiation from pion annihilation in the hadronic fireball. The shape of the excess centring at 500 MeV/, however, cannot be described without strong medium modifications of the meson. The results are put into perspective by comparison to predictions from Brown-Rho scaling governed by chiral symmetry restoration, and from the spectral-function many-body treatment in which the approach to the phase boundary is less explicit.
pacs:
PACS-keydescribing text of that key and PACS-keydescribing text of that key1 Introduction
Strongly interacting matter under extreme conditions of temperature and density is being created by colliding heavy nuclei in fixed target experiments at the Super-Proton Synchrotron (SPS) at CERN and at the Relativistic Heavy-Ion Collider (RHIC) at BNL. The motivation derives from the quest to discover ‘quark matter’, the quark gluon plasma (QGP), in which quarks and gluons are deconfined and chiral symmetry is restored quark-matter , two complementary facets of the phase transition predicted by Quantum Chromodynamics (QCD). This transition is expected to occur at a critical energy density of 0.7 GeV/fm3 and a temperature of 170-180 MeV as finite-temperature lattice calculations have shown karsch02 . The initial energy density at full SPS energy is appreciably larger and reaches about 3 GeV/fm3 in central Pb-Pb collisions, adopting Bjorken’s longitudinal expansion scenario for a simple estimate bjorken83 . While the existence of the QGP has not yet been proven, there is circumstantial evidence that its transient formation is imprinted, in one way or another and to varying degrees, on measured distributions of final-state hadrons. Since the fireball terminates in an exploding multi-hadron final state, QGP signatures, if not collective in character, are prone to be masked by hadronic interactions.
Photons and dileptons are potentially more direct probes of the early
collision stages since they escape from the impact zone nearly
undisturbed by final-state interactions and have their largest
emission rates in hot and dense matter. Moreover, according to the
vector dominance model sakurai , dilepton production is mediated
in the hadronic phase by the light neutral vector mesons , and which mark the low-mass region by
distinctive resonance peaks. Among these, especially the short-lived
meson ( 1.3 fm/) has acquired a key role as test
particle for ‘in-medium modifications’ of hadron properties close to
the QCD phase
boundary brownrho1991 ; rapp-wambach2000 ; b-r03 . Changes in
position and width of the have been advocated already 20 years
ago as precursor signals of the chiral
transition pisarski1982 . Restoration of chiral symmetry in hot
and dense matter has become one of the heavily discussed and
exciting issues in non-perturbative QCD
thermodynamics rapp-wambach2000 ; b-r03 ; hats96 ; b-r96 ; wilcz00 as
the melting of the chiral condensate should cause rather drastic
changes of the properties of the light vector mesons and thereby on
the structure of dilepton spectra. Spectral function calculations on
the lattice seem still far from providing model-independent guidelines
for the study of thermal modifications of hadron
properties karsch02 .
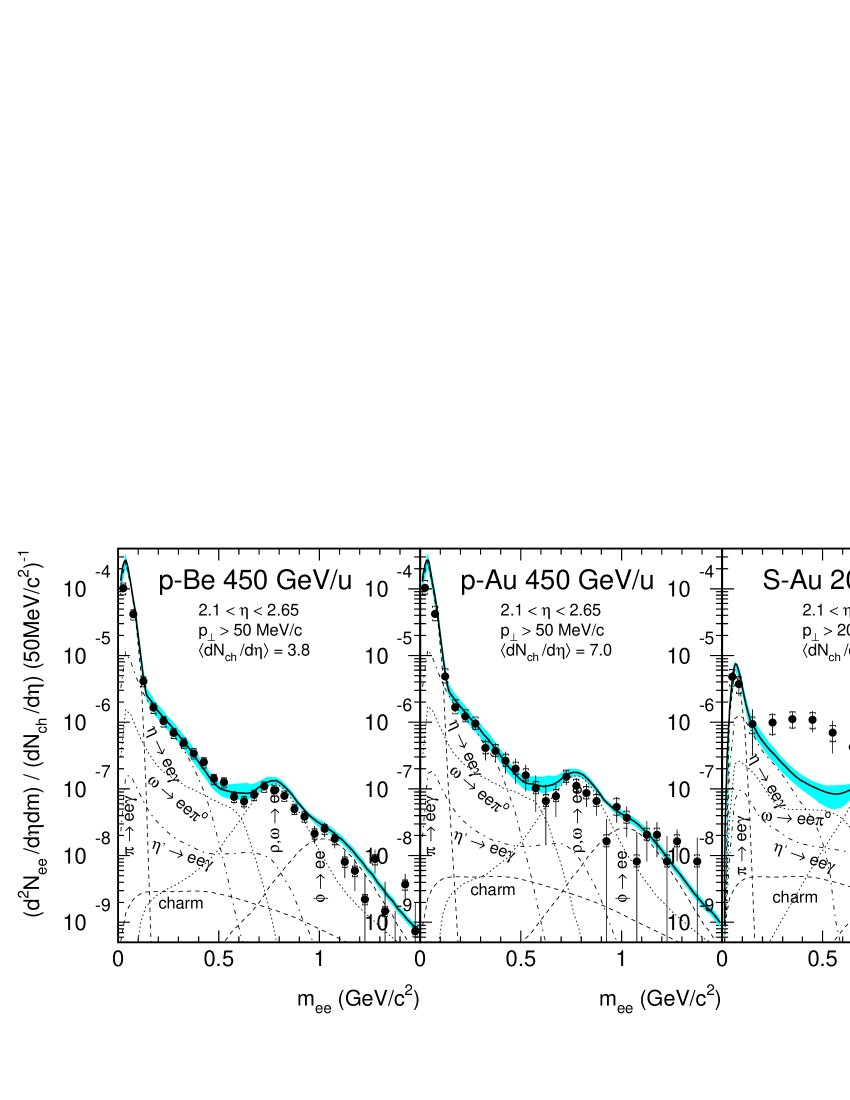
An enhancement of low-mass lepton pair production was first reported by CERES prl1995 ; wurm-qm95 and HELIOS-3 masera1995 ; angelis1998 on the basis of 200 GeV/n S-Au and S-W data, respectively. The CERES mass spectrum is shown in Fig. 1 together with the reference spectra for 450 GeV p-Be and p-Au collisions neutral-meson-pBe 111The notation of the ordinate in Fig. 1 is no longer in use; it should read as in all other mass spectra shown in this paper. The ‘cocktail’ has received minor adjustments in the meantime which do not affect any of the conclusions drawn.. While the p-A data are reproduced within errors by final state Dalitz and direct decays of neutral mesons as known from p-p collisions, electron pairs from S-Au collisions reveal a substantial enhancement in the mass range above 250 MeV/.
At top SPS energy and close to the critical temperature, the prime candidate for ‘thermal radiation’ from the hadronic phase of the fireball pipi-anni ; mclerran85 is pion annihilation,
| (1) |
This thermal process with a threshold at is dynamically enhanced via the electro-magnetic form factor of the pion by the resonance cleymans1993 , with a dilepton branching of 1 in . Yet, the serves not only as test particle, but its strong coupling to the channel makes it also a major constituent of hot hadronic matter. Numerous theoretical approaches incorporating pion annihilation using vacuum properties of the meson, failed without exception to describe the data drees1996 .
This suggested in-medium changes of the spectral function that shift dilepton strength down to lower masses. The first calculations that were successful in describing both the CERES and the HELIOS-3 data made use of the scaling conjecture of Brown and Rho brownrho1991 , which postulates that the mass of non-strange vector mesons decreases in dense matter together with the scalar quark condensate, the order parameter of the chiral transition. This ‘dropping mass’ scenario received independent support by work on QCD sum rules hatsuda-lee1992 , and it turned out like a tailor-made concept: linked to a fireball model likob95 ; likobs96 or embedded into transport calculations casseheko95 ; cassehekr96 , it gave excellent fits to the data.
But it was also pointed out dey90 ; rapp-chanfray-w1996 ; harada97 ; mishra02 that chiral symmetry considerations alone would only require that masses of chiral partners, here the vector meson and the axial vector meson , become degenerate, but by no means necessarily massless. Moreover, significant mixing must accompany any mass shift when approaching the phase transition along kim-rapp-brown-rho1999 . The ‘dropping mass’ scaling idea has been very recently revisited by the original authors b-r03 welcoming an alternative scheme of how chiral symmetry might be restored, the Georgi vector limit georgi90 in which the chiral partner of the (longitudinal) is the Goldstone pion, both becoming massless in approach of the chiral transition halasz97 ; harada01 . Thermal modifications of hadron properties in general, and of in-medium spectral functions in particular, have not yet come within reach of QCD lattice calculations with finite baryon density karsch02 . Very preliminary results suggesting dropping vector meson masses have been reported muroya2003 .
An alternative approach to explain the low-mass dilepton enhancement in the CERN SPS data focused on the calculation of spectral functions in a hot and strongly interacting hadron resonance gas at finite baryon density by conventional many-body techniques rapp-wambach2000 ; cassing-brat1999 . These confirmed earlier calculations of the two-pion self-energy in nuclear matter which indicated that the spectral function suffers significant broadening but only negligible shift in mass herm-frim-noe1993 ; chan-schu1993 . The many-body calculations combined with suitable reaction models describe the observations actually quite well klingl-weise1996 ; rapp-chanfray-w1997 ; cassing1997 ; rw98 : the low-mass wing of the broadened in-medium spectral function receives strong thermal Bose enhancement which results in an amplified dilepton strength considerably below the vacuum position, while simultaneously the yield at the vacuum position was depleted, consistent with approximate unitarity rapp-gale1999 .
Our discussion so far was limited to aspects of dilepton emission rates with possible modifications by the medium. However, total pair yields derive from space-time integration over a priori unknown density and temperature profiles which are usually modelled by hydro-dynamical sollfrank97 ; hung98 or microscopic transport cassing-brat1999 ; likobs96 ; casseheko95 calculations, or fireball models likob95 ; renk02 . Certainly, the external inputs, e.g. to the hydro-dynamical and fireball calculations, have to conform with whatever knowledge there is on initial conditions, depending on collision geometry, and on the (, ) coordinates of the trajectory in the phase diagram. The medium modifications of the suggested by the SPS results seem to require a strongly interacting, hot and dense hadronic fireball with sufficient time spent between hadronisation and thermal freeze-out. If this time would be insufficient, the enhanced dilepton production may have stronger links to the hadronisation stage or the plasma phase than hitherto assumed.
The CERES Collaboration measured dilepton production in 158 GeV/n Pb-Au collisions in 1995 and 1996 with a greatly improved setup baur1996 ; ullrich-qm96 compared to the sulfur-beam experiment. The main objective of the Pb runs has been achieved: to corroborate with a large statistics sample the enhanced dielectron production at low masses for the heavy Pb-Au collision system ullrich-qm96 ; ravinovich-qm97 ; plb422 ; lenkeit-qm99 ; lenkeit-paris . Improved background rejection was achieved which was compulsory in an environment of very large rapidity density of hadrons and secondary photons. Among the physics goals considered most important for further insight into the nature of the processes at work was the centrality dependence of the enhancement.
The significance of the baryon chemical potential for in-medium modifications at SPS energies prevailing over that of pion number, or temperature, as found in most calculations cassing-brat1999 ; rapp-wambach2000 , but not in all bleicher00 , was given experimental support by the recent finding of an even somewhat larger enhancement measured in the CERES Pb-Au low energy run at 40 GeV/n adamova-ee03 ; damjanovic-phd , compared to that at 158 GeV/n.
This paper presents the combined results of all data on electron pair production in 158 GeV/n Pb-Au collisions taken by the CERES Collaboration in the years 1995 and 1996. Most of the analyses were performed in the course of Doctoral Dissertations in Heidelberg, Darmstadt and Rehovot dealing with the 1995 voigt-phd ; socol-phd and 1996 socol-phd ; lenkeit-phd ; hering-phd data. Publications of analysis results of the 1995 data ullrich-qm96 ; ravinovich-qm97 ; plb422 and the 1996 data lenkeit-qm99 ; lenkeit-paris are superseded by the combined results presented here. There are no major deviations of the unified results reported in this paper to those published previously for the separate data sets.
The paper starts with a description of the experimental setup and summarises the instrumental means CERES has at its disposal to cope with background. A detailed description of the data analysis is given in sect. 3 which concludes with the centrality determination. The Monte-Carlo simulation method applied for measuring reconstruction efficiency and optimising the rejection of combinatorial background is addressed in sect. 4. The ‘cocktail’ of hadron decays which serves as an important reference for electron-pair production is discussed in sect. 5. Results of both data sets are presented in sect. 6 which also includes a discussion of statistical and systematic errors. The final mass and transverse momentum spectra are presented and compared to the hadronic cocktail in sect. 7. Section 8 contains a physics discussion, from an experimentalist point of view, on the comparison of data to current theoretical models. The paper concludes by summarising what has been achieved and which issues are still open but might be clarified in the not too distant future.
2 The CERES experiment in 1995/96
CERES is dedicated proposal88 to the measurement of electron pairs in the low-mass range from 50 MeV/ up to about 1.5 GeV/; an upper mass limit is imposed by counting statistics due to the rapid decline in cross section. The spectrometer covers the pseudo-rapidity region close to mid-rapidity, 2.1 2.65. It is axially symmetric around the beam and has 2 azimuthal coverage. Transverse pair momenta are accepted down to 20 MeV/ for masses above 400 MeV/. These are great assets when investigating soft processes. CERES maintains transparency for hadrons and photons as strictly as possible.
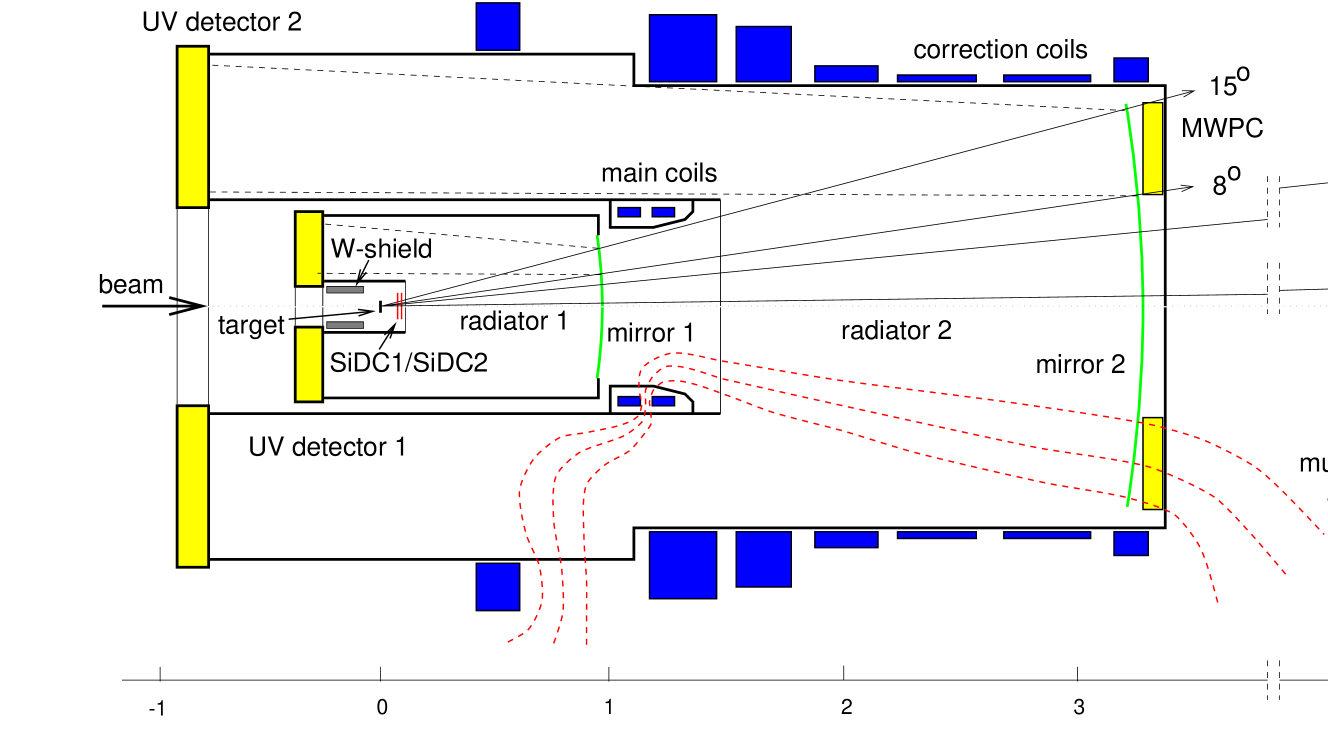
A schematic view of the spectrometer in the run periods 1995 and 1996 is shown in Fig. 2. At the heart of the spectrometer are the two coaxial ring-imaging Cherenkov detectors rich_set , one (RICH-1) within the other (RICH-2) along the beam and separated by a compact super-conducting solenoid for momentum analysis. A doublet of silicon-drift chambers (SiDC) chen93 replaces the previously used single SiDC to enable precise charged-particle tracking into RICH-1 for rejection of close tracks, and for off-line measurement of charged multiplicity. A multi-wire proportional counter (Pad Chamber) with pad readout was added behind the mirror of RICH-2 to provide external tracking downstream of RICH-2. The new tracking detectors outside the field were added to cope with the high multiplicities of Pb-Au collisions pb-proposal94 ; cogne95 . These upgrades are described in Ref. baur1996 and Ref. holl96 for RICH and SiDC, respectively. A multiplicity detector (MD) of plastic scintillators behind the Pad Chamber serves as first-level trigger device. Below we introduce the individual detector components in order of their arrangement along the beam.
2.1 The target area
The target area, hardly visible in Fig. 2 and enlarged in Fig. 3, comprises the segmented target, the doublet of SiDC’s, the light-collecting parts of the interaction-vetoing beam counter BC3 (see sect. 2.6) and interfaces to the adjacent parts of the spectrometer. It is housed within a hollow cylindrical recess into
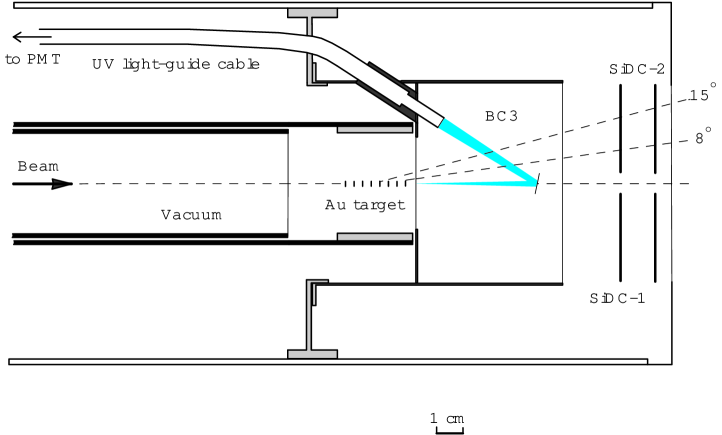
RICH-1 which is lined by a cylindrical tungsten mantle of 20 mm thickness which shields the UV-detectors from heavily ionising particles emerging in backward direction from the target. The recess is hermetically closed towards the radiator of RICH-1 by a double-walled aluminised mylar window (2 x 50 m), the intermediate volume being ventilated with nitrogen. The SiDC’s and a thin mirror for BC3 are mounted within a double-walled tube of 160 mm diameter, made of aluminium and carbon fibre which is water cooled and provides a laminar flow of dry nitrogen for cooling the SiDC’s and the front-end chips mounted on the same mother board. A light guide transfers the Cherenkov light received from a thin mirror.
The beam enters the target area via an evacuated Al tube that reaches until a few millimetres short of the segmented target and is sealed by a thin mylar window .
The segmented Au target consists of 8 discs of 25m thickness and 600m diameter spaced uniformly by 3.2 mm along the beam. The total target thickness of 200m Au corresponds to an interaction length of for Pb-Au collisions. The segmentation assures that only a fraction of the total radiation length is effectively seen by photons and electrons propagating into the spectrometer acceptance. Under worst conditions of full illumination, there is only a chance of about 20 that the next downstream disc is within the acceptance. The effective radiation length is 0.55, compared to for an unsegmented target of identical interaction length.
The Au discs are supported by 2.5 m thick mylar foils, and the entire assembly is contained in a thin-walled (0.5 mm) carbon fibre tube of 60 mm diameter; the Au discs are accurately aligned to the axis of the tube. The Au discs contain 90 of the beam over the full length of the target once collimators and magnet settings of the beam line have been optimised. The beam diameter was measured to have a Gaussian envelope of = 220 m.
2.2 The silicon-drift telescope
The SiDC’s fulfil several purposes in the overall concept: (i) to locate the interaction vertex within the segmented target, (ii) to maintain a precise two-point charged-particle tracking free of ambiguities, improving thereby the momentum resolution of the spectrometer, (iii) to assist in the ring pattern recognition of RICH-1, and (iv) to reject conversions and Dalitz pairs which are not resolved in the RICHes, by detecting a double pulse-height signal or two close tracks.
The SiDC telescope made up of two closely spaced cylindrical SiDC’s was the major element in upgrading CERES for the Pb-beam experiments cogne95 . CERES is the first experiment which successfully implemented chen92 this detector concept gatti847 , and it did so from the start, however, with only a single detector chen93 ; fasch93 . This allowed to check that the electron pair originates from a common vertex, but was of course insufficient for full tracking.
Since cylindrical SiDC’s seem not very well known, we insert here a short description. The active area is practically the full area of a 3-inch-diameter wafer 280 m thick which has a central hole of about 6 mm diameter for the passage of the beam. The signal electrons generated by ionisation of charged particles traversing the wafer drift radially outward to an array of 360 anodes located at the periphery of the detector. The radial coordinate of the point where a charged particle crossed the detector plane is measured by the drift time of the electron cloud. The charge sharing between neighbouring anodes measures the azimuthal coordinate . The pair of coordinates is provided for each crossing charged particle for events with a total charged multiplicity of several hundred. The longest drift distance is about 3 cm. The nominal value of the drift field of 500 V/cm results in a maximum drift time of about 4 s. The drift field is provided by means of 240 concentric electrodes with 130 m pitch on both sides of the detector, suitably biased by an implanted voltage divider. A major innovation in the design was a ‘sink anode’ providing a path for the leakage current generated at the Si-SiO2 interface away from the signal anode, i.e. without contributing to the anode leakage current.
The ideal circular electrode shape could not be designed in early 1990 due to limitations in the software controlling mask production. Electrodes were shaped instead as regular polygons of 120 sides. We were surprised to see that the distribution of hits displayed peaks at every third anode fasch96 . The ‘efficient’ anodes were those located in the central part of each 3∘ triangle forming the polygon.
The telescope implemented in 1995 consisted of a 3-inch detector followed by a 4-inch detector, the latter of the novel AZTEC design holl96 which eliminated the focusing problem. The spacing of the two detectors was 14.3 (15.0) mm and the distance from the target centre to SiDC-1 amounted to 98.5 (110) mm in 1995 (1996).
In production of the 3-inch detector222produced by SINTEF, 0134 Oslo 3, Norway, the front and back lithographies were rotated with respect to each other by 1.5∘ to reduce the non-radial components in the drift field. This trick reduced to negligible levels the focusing effect of the central anodes that had been a severe obstacle for reaching the design azimuthal hit resolution fasch96 .
In 1996, both detectors were of the 4-inch type333produced by EURISYS Mésures, F-67380 Lingolsheim, France. The larger anode radius of 42 mm allowed to increase the distance to the target for lower hit occupancy, especially at small radii. The sensitive area of the detectors is increased from 32 cm2 for the 3-inch devices to 55 cm2 for the 4-inch detectors. The ‘field cage’ polygons consist of 277 concentric electrodes each having 360 instead of 120 sides before, and the respective -implantations on the two wafer sides are rotated by 0.5∘ with respect to each other for near perfect radial field geometry. Another novel property of the AZTEC detectors is the interlaced anode structure: each one of the 360 anodes is subdivided into 5 segments, two of which (extending over 16 of the anode pitch of 1 degree) are interlaced to the closest of the neighbouring anodes to enforce charge sharing. This provides a more accurate azimuthal position measurement when calculating the centre of gravity of the distribution. Compared to the ’95 runtime, the new design improves the azimuthal resolution from 2.5 to 1 mrad. The resolution in radial direction is 30 m both for the 95 and 96 set-ups.
Charge signals from 3-inch detectors are amplified by 32-channel front-end OLA chips placed on the detector motherboards which were developed to test ALICE silicon-drift prototype detectors dabrowski93 and were produced in a custom bipolar process444Owned by Tektronix at the time of production; since then Maxim Integrated Products. They consist of a charge-sensitive preamplifier, a quasi-Gaussian shaper555The time constant = 38 ns, about twice the design value, deteriorated the potential double-pulse resolution, but avoided a large ballistic deficit over the full drift. and a symmetrical line driver. The rather high gain (30 mV/fC) gave rise to wild collective oscillations. Stable operation was achieved only with the introduction of 20 damping resistors connected in series into the 50 -terminated output lines.
For the readout of the 4-inch detectors, new 16-channel front-end chips had been designed along a CMOS concept gramegna1997 which incorporated bipolar drivers and were well adjusted in shaping time (37 ns), gain (9 mV/fC), dynamic range (5 666minimum ionising particles), and low equivalent noise charge (140 e-) to meet our requirements.777produced by AMS in 0.8m biCMOS technology.
An outside buffer stage transmits the bipolar signals over 40 m flat cables to the FADC’s (flash analog to digital converters)888Series DL300 of Fa. B. Struck, Tangstedt near Hamburg which sample the data with 50 MHz and store it 256 bytes deep. This corresponds to a drift time range of 5.12 s. Digitisation is 6 bit with non-linear characteristics.999, input voltage in Volt. Data are continuously sampled until interrupted by an external ‘stop’ signal so that the channel memory contains always the last 5.12 s of data.
Since the trigger signal and clock are asynchronous, there is a random phase difference producing a time jitter of 20 ns/ rms. It is measured with a TDC (time-to-digital converter), and correction is done off-line.
Each of the four FADC crates per detector houses a SIM (scanner interface module) which scans the data after the trigger was received for contents above a predefined threshold (readout threshold). Readout is activated whenever the threshold is surpassed in two successive time bins, and stopped, if contents in two successive time bins fall below it. The contents of five preceding channels are also readout (pre-samples) for off-line reconstruction of the baseline.
2.3 The RICH detectors
The radiators are filled with methane at atmospheric pressure. The high Cherenkov threshold of 32 101010different in RICH-1 and RICH-2 by about one unit. ensures that more than 95 of all charged particles pass without creating Cherenkov light (‘hadron blind tracking’). The Cherenkov light is reflected backward onto 2-dimensionally position-sensitive gas detectors which are separated from the radiator volume by UV-transparent windows. By their upstream position with respect to the target, the UV-detectors are not exposed to the huge forward flux of charged particles. The price to be payed for this geometry is the limited acceptance in polar angle , indicated by the lines in the upper part of Fig 2.
High-energy electrons produce Cherenkov rings with asymptotic radius, R∞= 1/ 30 mrad. The difference in radiator lengths (86 cm and 175 cm for RICH-1 and RICH-2, respectively) is partially compensated by better UV transmission in RICH-1 (CaF2 window) compared to RICH-2 (quartz window), so that the asymptotic number of photons per ring, 10.8 and 11.5, for RICH-1 and RICH-2, respectively, come out rather similar111111The numbers of Ref. rich_set measured with ethane are increased by one photo-electron due to the larger bandwidth in methane.. By the same reason, photon detection in RICH-1 reaches farther into the UV.
In both RICHes spherical mirrors focus the Cherenkov photons radiated from a straight trajectory back onto a ring image in the focal plane of the UV detectors. As the mirror in RICH-1 is traversed by all electrons before the second ring image for momentum measurement is taken in RICH-2, there are stringent physics reasons to keep the radiation length as low as possible: besides reducing the number of external conversions, it is the multiple scattering of low-momentum electrons which reduces the detection efficiency for soft pairs and deteriorates the momentum resolution. The mirror of RICH-1 therefore is made very thin (1.1 mm) so that it adds only 0.4 of a radiation length. It is based on a laminated carbon fibre structure which defines the spherical geometry121212 manufactured by MAN Technologie AG. An evaporated coating of aluminium protected by magnesium fluoride achieved persistent UV reflectivity of 80 at 300 nm.
The UV-detectors consist of a conversion space followed by two parallel-plate avalanche stages and a multi-wire proportional chamber. The originally planned mode of running only with parallel-plate amplification was abandoned in favour of an added multi-wire stage, following a painful learning process on spark break down problems in pure parallel-plate schemes spark94 .
The operating gas is He + 6 CH4 at atmospheric pressure + TMAE-saturated131313Tetrakis-di-Methyl-Amino-Ethylen vapour at 40∘C as photon converter. The use of TMAE demands that the UV detectors be kept hot to avoid condensation. To avoid temperature gradients across the delicate UV-transparent windows separating the detectors from the radiators, the entire spectrometer is kept hot at about 50∘ C. The UV detectors operate at a total gain of about 2105 for high photon detection efficiency (). The ion clouds produced in the last wire amplification stage induce signals on the pads. The latter form a grid of pitch 2.74 mm and 7.62 mm, and the resulting total number of pads is 53,800 and 48,400 in RICH-1 and RICH-2, respectively pad_read .
The UV detectors have been operated without opening since 1991. During the 1995 run, UV-1 degraded in performance. The detector could not be operated at the desired gain of 2105 without an excessive spark rate. Early in 1996, the UV-1 detector was opened and all mesh electrodes, in particular the cathodes and the multi-wire plane showed some kind of deposit. Most mesh electrodes were exchanged and the wire anode subjected to ultrasonic cleaning. The refurbished detector performed very well during the 1996 run socol-phd .
2.4 Deflection in the magnetic field
The magnetic field for momentum analysis is generated by two super-conducting solenoids carrying currents in opposite sense. Charged particles experience an azimuthal deflection between the two RICHes which is inversely proportional to the momentum,
| (2) |
and the sense of which, for fixed polarity of the field, defines the charge sign. The constant is = 146 mrad GeV/. Between SiDC and the Pad Chamber the deflection is only 66 of this value, = 96 mrad GeV/.141414The RICHes measure the change in local angle, while deflection in the Pad Chamber is derived from the displacement relative to the distance from the vertex. To first order, the polar angle is not affected. Particles deflected in azimuth by encounter a small second-order deflection towards the beam axis which amounts to
| (3) |
Two sets of warm correction coils are tuned to achieve a field-free radiator in RICH-1 and to align the field lines in the radiator of RICH-2 parallel to the particle trajectories from the target. This way straight trajectories inside both radiators are achieved. Moreover, the absence of deflection in the first RICH detector allows to identify conversion and Dalitz pairs by their small opening angles.
2.5 The Pad Chamber
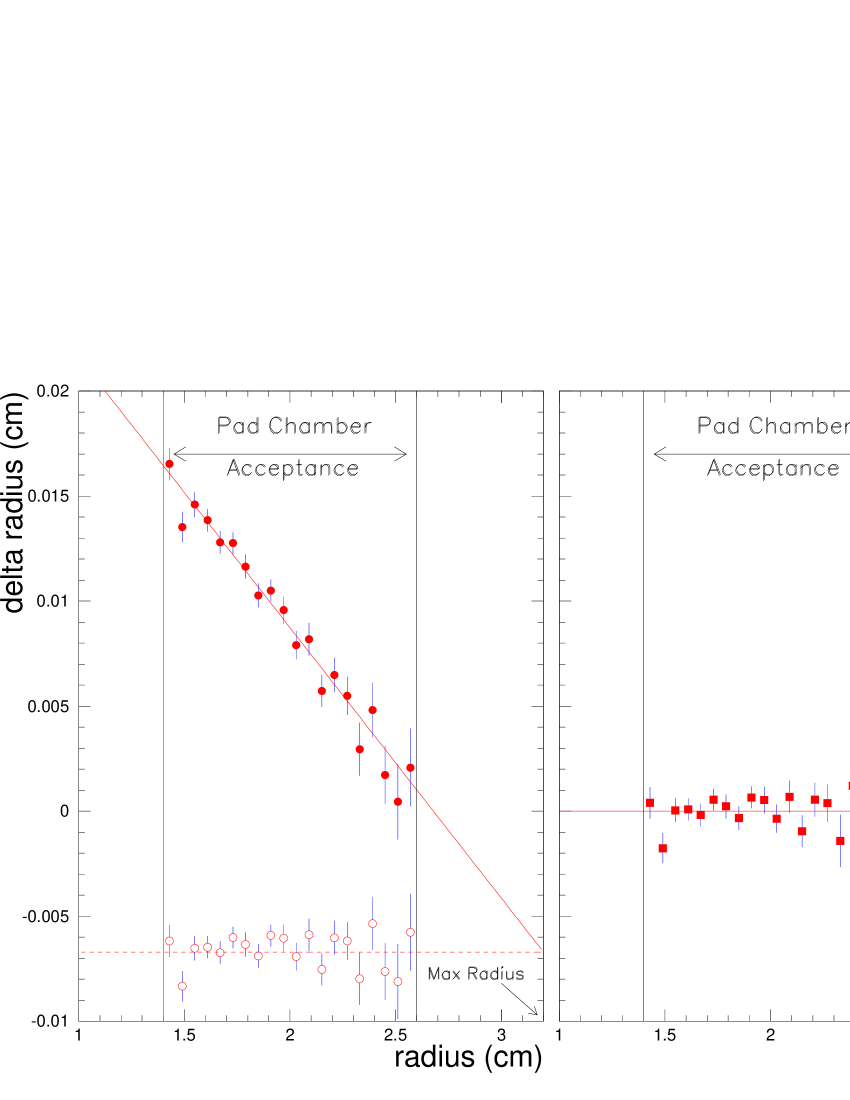
The last tracking detector is a multi-wire proportional chamber located closely behind the mirror of RICH-2, at a distance of about 3.3 m from the target. It has an inner and outer radius of 42 cm and 85 cm, respectively, and is free of radial spokes. The Pad Chamber covers the fiducial pseudo-rapidity interval of the CERES spectrometer. It was added before the run period in 1995 as an external tracking device behind RICH-2 to assist the ring pattern recognition and reduce the fake-ring background in the high-multiplicity environment of Pb-Au collisions. By providing an absolute reference for the silicon and the RICH detectors, the Pad Chamber, with an angular resolution of about 0.6 mrad (in ), proved a powerful tool in the geometrical inter-calibration of the detectors which helped to improve momentum resolution.
The Pad Chamber is operated with a 90/10 Ar/CO2 mixture. The multi-wire anode is at equal distance (5 mm) to the upstream mesh cathode and the downstream pad cathode. Only about half the ionisation charges are collected during the s charge integration time of the pad readout electronics. The electronic avalanche produced by a charged particle traversing the Pad Chamber induces a signal in some of the 29000 pads of the pad cathode. The pad size is the same as in RICH-2, and the pad readout electronics was adopted from RICH-2.
2.6 The trigger
A system of beam counters (BC) has been specifically developed to meet the requirements of minimal mass exposure in the beam and target region and sufficient radiation hardness volodya97 . The trigger system is based on three small Cherenkov beam counters operating in air, one (BC1) about 60 m upstream, monitoring incident beam particles, and one (BC2) about 6 m downstream of the target detecting ions passing through the spectrometer. The
third Cherenkov counter (BC3) registers each intact Pb ion downstream of the last target in order to veto the interaction trigger. To this purpose, Cherenkov photons (2700 per cm air) emitted in a narrow forward cone are reflected away from the axis onto a UV light guide by means of a tiny (6 mm diameter) aluminised mylar mirror on axis about 6 cm downstream of the target. The Cherenkov light is fed into a photo-multiplier just outside the spectrometer (Fig 3).
A plastic scintillator in front of the spectrometer (VC) is used to veto upstream interactions. The interaction trigger is defined as the logical AND of BC1 and the veto of BC3 and VC, INT= BC1. Centrality is selected with the multiplicity detector (MD), an array of 24 plastic scintillator paddles downstream of the RICH detectors at 2.9-4.7, the light output of which serves as a measure of the number of ionising particles that have passed. The centrality trigger is defined as INTMD, and a hardware threshold is set at 100 mips. The accuracy of the trigger threshold and its stability over time is limited, mostly due to gain variations in the photo-multiplier tubes. In the off-line analysis, a precise multiplicity measurement is provided by the two SiDC’s. The trigger selection corresponds roughly to the top 30 of the geometrical cross section claudia . A more precise calibration will be presented in sect. 3.8.
2.7 Data acquisition
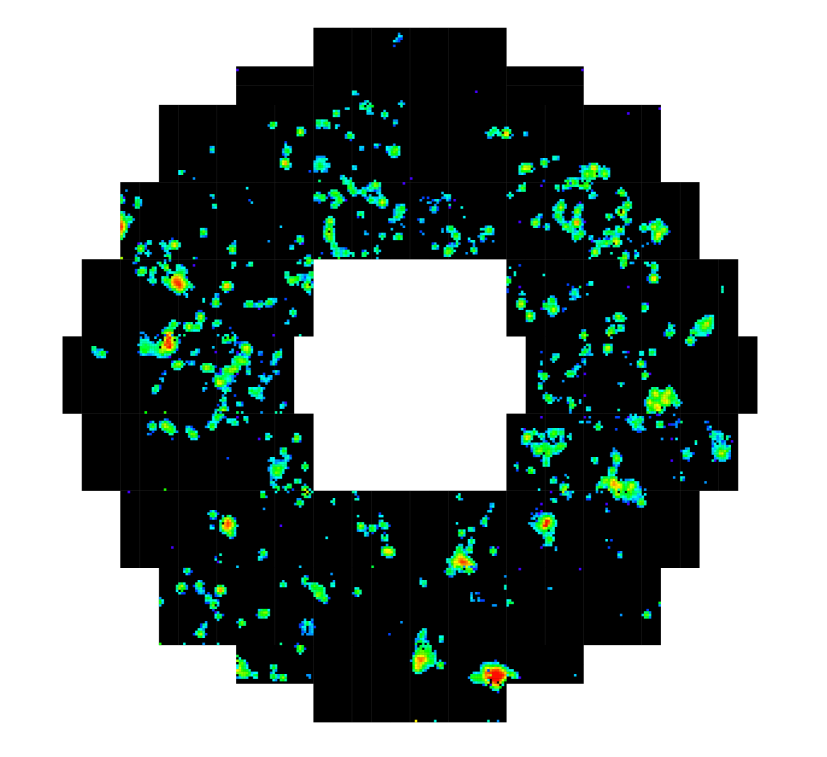
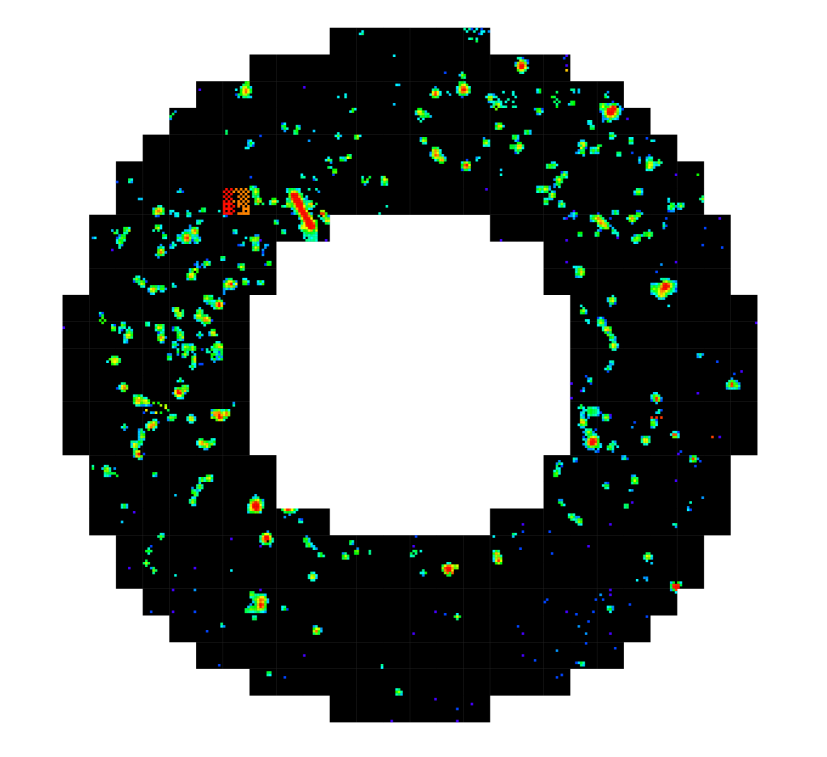
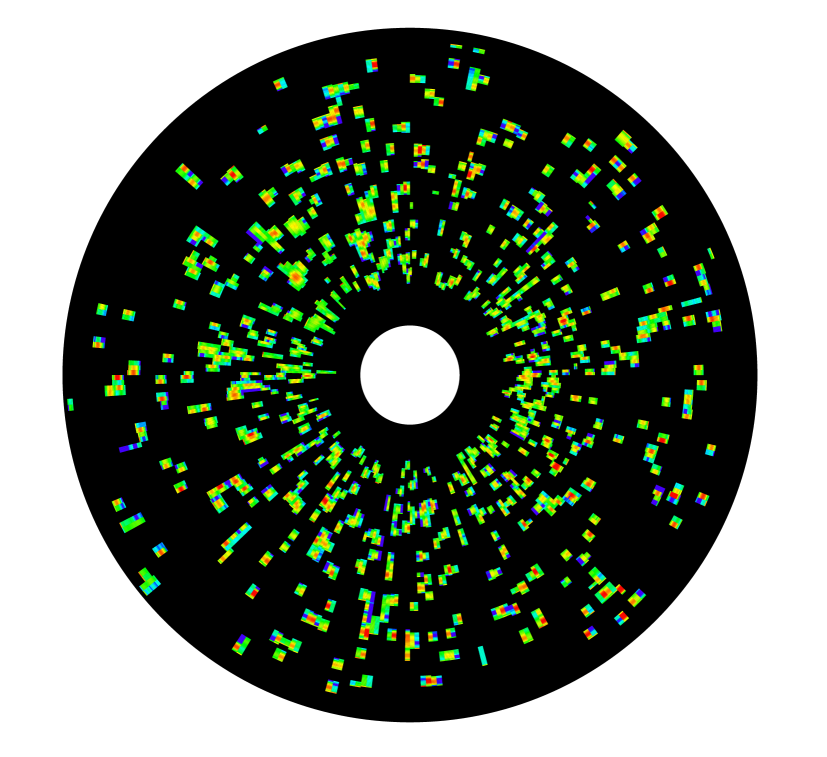
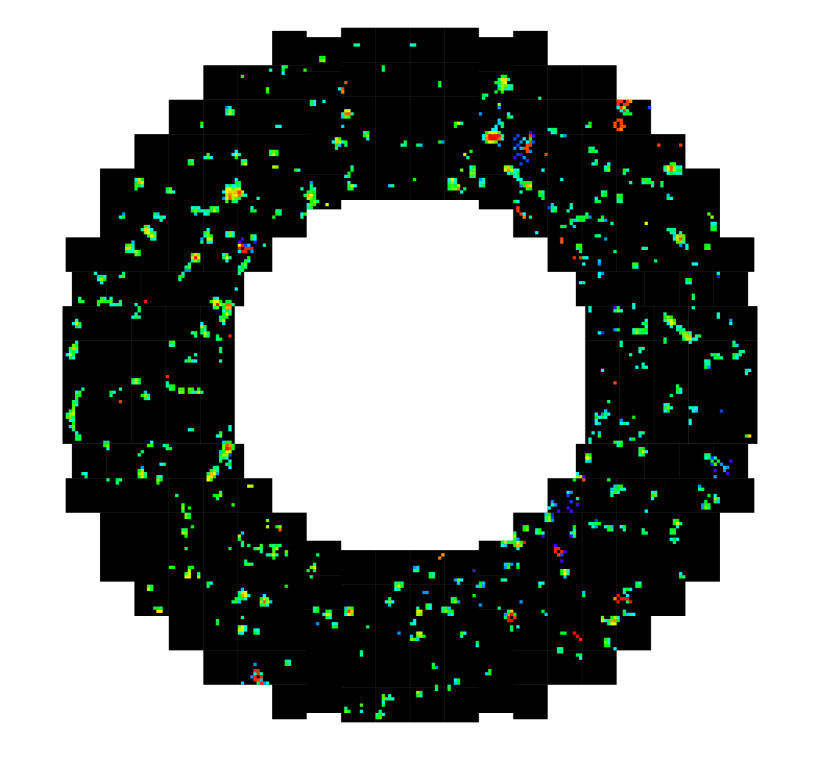
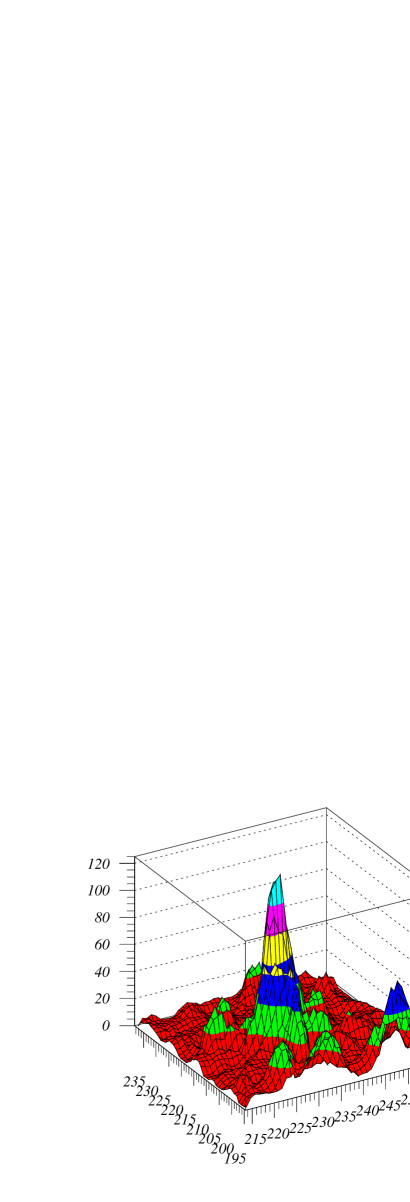
The on-line response of the detectors is shown in Fig. 4 for a semi-central 158 GeV/n Pb-Au event recorded during data taking in 1996.
The large amount of information per event contained in five highly granular detectors is collected by a fast data acquisition system. Data reduction is performed already at the hardware level when individual detectors are readout with zero suppression and pedestal subtraction. The data from the detectors are split into several separate readout chains which are processed in parallel for higher readout speed and transferred into special Memory modules where the data is compressed using Huffmann coding.
A set of two (in 1995, three in 1996) CPU modules in VME technology is used to collect the data from the Memory modules for each event during the burst period (4.8 s) in a round-robin mode and writing it to tape during the intervals between bursts (14 s). As the write speed of the Digital Audio Tape (DAT) drives used is rather low, each CPU has three drives connected to it, allowing for an effective aggregated write speed of about 1.5 MByte/s per CPU (in 1995, about 8 MB/s in 1996). This allowed to record on average 550 events/burst of 40-45 kByte each in 1995; the upgraded DAQ together with optimised detector settings and therefore smaller event sizes (30-35 kB) recorded about 1000 events/burst in 1996.
2.8 Data taking in 1995 and 1996
CERES/NA45 had data taking runs of 9 days in fall 1995 and of 27 days in fall 1996 at the CERN SPS with a 158 GeV/n Pb beam on Au targets. The average beam intensity in both years was about 1 106 ions per burst of duration 4.8 s.
Because of the small target and beam dimensions, a readjustment of the beam position was one of the regular shift duties. To keep the spectrometer efficiency at the designed level, the gains in the UV detectors were monitored continuously and held within limits of about 30 at 2 by adjusting high voltage upon changes of atmospheric pressure.
Collision events were selected with the interaction trigger threshold set on 100 mips equivalent in the multiplicity array. The trigger contained an admixture of downstream interactions on the level of 15% of the target interactions. These were discarded in the off-line analysis on account of the silicon-drift track multiplicity. The latter served for more accurate centrality definition and also revealed some difference in the effective calibration of the multiplicity array between the two runs.
In 1995 8.5 million events were collected with average multiplicity = 220 corresponding to the top 33 of the geometrical cross section. In 1996, the total sample was 42 million events of average charged particle multiplicity 250, or 26 of the top geometrical cross section. The multiplicity refers to the number of tracks in the SiDC’s and is averaged over the pseudo-rapidity range = 2-3. In the middle of the runs the polarity of the magnetic field was switched.
2.9 Instrumental means of coping with background
We shortly review here the instrumental means by which CERES recovers a weak signal of low-mass electron pairs from high levels of combinatorial background.
Approximate ‘hadron blindness’ is achieved by using two Ring Imaging Cherenkov (RICH) detectors with a high threshold 32. While electrons with momenta above 16 MeV/ produce Cherenkov light, pions overcome the threshold only at 4.5 GeV/. More than 95% of all charged hadrons pass without producing Cherenkov light.
The radiation length within the spectrometer acceptance has been kept at 1 %. This is the level where the number of conversions is about equal to the number of Dalitz pairs. It is the result of persistent efforts in the design of all spectrometer components to reduce the detector materials, among which the thin mirror of RICH-1 and the segmented target are the most important.
Our physics sample are electron pairs with mass above 200 MeV/. Below 200 MeV/, photon conversions and Dalitz decays shoot up in yield which diminishes the sensitivity to interesting physics. In pursuit of the goal to recognise soft pairs of conversions and -Dalitz pairs with highest possible efficiency, the CERES spectrometer provides two powerful handles: the SiDC doublet detects close tracks by double-dE/dx response in pulse height, or by resolved close hits. The fact that the radiator of RICH-1 is free of magnetic field allows to see electron pairs of small opening angle undeflected, i.e. as close, resolved Cherenkov rings, or rings with a larger number of photons when the two tracks are separated by less than 8 mrad. Soft electron tracks from conversions and -Dalitz pairs are strongly deflected by the magnetic field between the two RICHes, electrons and positrons in opposite sense. By setting an upper limit to the azimuthal deflection between RICH-1 and RICH-2, or between SiDC and Pad Chamber, a cut on track is implemented which is one of the most effective measures to reject background.
To achieve a high efficiency for reconstruction of soft pairs, all detectors have full azimuthal coverage and the vetoing detectors have a slightly larger (minimum 1.9 2.8) fiducial rapidity acceptance than the detectors after the magnetic field (2.15 2.6). The more subtle details of the rejection strategy are discussed in sect. 3.
3 Data analysis
3.1 Overview
In this overview we sketch the strategy of the data analysis up to the pairing level when identified electron tracks in a given event are selected for combination to pairs. The presentation is mainly based on data and only rarely refers to Monte-Carlo simulations. The latter are, however, implicit in the choice of various quality and rejection cuts and will be treated in sect. 4.
3.1.1 The analysis strategy
The invariant mass squared of the pair is given by the squared sum of the electron 4-momenta,
| (4) |
For the standard single-electron cut 200 MeV/ used in the data analysis, the dynamic range of the electron momenta is somewhat restricted so that the dynamic range of the invariant mass is largely determined by that of the laboratory opening angle between the electron tracks.
Signal electron pairs with 200 MeV/ have opening angles considerably larger than the asymptotic Cherenkov ring radius of 30 mrad; the massive pairs from , , and decays are opened about ten times wider (Fig. 5, upper panel).
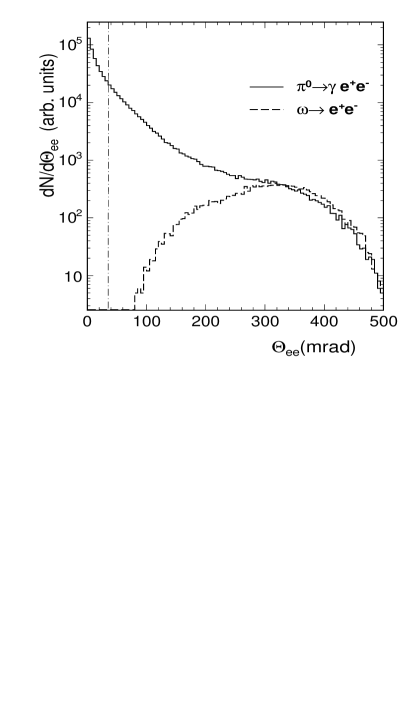
Our operational definition of signal or open pairs
includes an opening angle cut 35 mrad.151515It
reduces the number of Dalitz pairs. As an important side effect, the
cut enforces more uniform track distributions in polar angle of pairs
from different sources. For Dalitz decays, the mean opening
angle is about 60 mrad. Conversion and -Dalitz pairs have
small masses161616Photon conversion pairs are nearly massless but
may acquire a small apparent mass by multiple scattering. and average
opening angles below 2 mrad and 20 mrad (rms), respectively. The
sample of pairs with masses below
200 MeV/ and
35 mrad will be referred to as the Dalitz
sample and is also used for checks on reconstruction efficiency and
absolute yields.
The distributions of electron tracks from conversions and -Dalitz pairs are steeper than those of open signal pairs. This feature provides the only rejection handle at the track level, albeit a very powerful one: the 200 MeV/ cut on track reduces close-pair tracks much stronger than signal tracks as seen in Fig. 5, lower panel.
The most severe problem of the experiment is the enormous combinatorial background. We do not know which electrons belong to a pair and therefore we accept combinations of all tracks that qualify. However, when we find a pair with 200 MeV/, its tracks are excluded from further pairing. Because the S/B ratio for these pairs is usually very good, we can declare a fully reconstructed Dalitz or conversion pair with good confidence.
The background arises whenever low-mass pairs are only partially reconstructed and the remaining tracks are combined, as visualised in Fig. 6. Clearly, combinatorial pairs cannot be distinguished from genuine signal pairs and contribute

to the entire mass range of interest, exceeding the signal by three orders of magnitude if all low-mass pairs would contribute. The final pair sample at masses above 200 MeV/ is still only about 10 of the residual level of combinatorial background pairs. This is why already small inefficiencies in reconstruction of soft pairs, acceptance losses, etc., give rise to large relative levels of combinatorial background. Multiple scattering of conversions and -Dalitz tracks is a further important source of losses.
A mild 50 MeV/ cut is applied during the production stage (see below) to limit the search area in azimuth. Many of the conversion and Dalitz pairs with only one leg above 200 MeV/ can be reconstructed and later rejected this way. Such pairs are ten times more numerous than pairs with both electrons above 200 MeV/, so that many stiff electron tracks are taken out before entering the pairing stage. Applying the strong cut before the filter would have kept those tracks in the combinatorics. Tracks attributed to pairs with opening angles 35 mrad - the logical complement of the opening-angle cut for signal pairs - are marked to be excluded from further pairing.
The deflection of electrons and positrons by the magnetic field between the RICHes provides the unique search pattern of V-tracks, i.e. one ring in RICH-1, possibly somewhat blurred as it contains UV photons from two close tracks, and two separated rings in RICH-2 at about the same polar angle (see also Fig. 6).
Rejection of combinatorial background is optimised by tuning various cuts. Since high rejection power and high signal efficiency are competing requirements, an appropriate measure of signal quality is required. The optimisation has to be kept rigorously free of bias. A critical discussion of this important issue is given in sects. 3.4 and 3.5.
3.1.2 The analysis stages
Without a higher-level trigger in the CERES Pb-beam experiments, the actual data volume is much larger than that of interesting events, and a primary data reduction, the ‘production’ stage, is called for. Implementation of an effective production filter requires an accurate geometrical inter-calibration of all detectors. The availability of the Pad Chamber since 1995 allowed precise local tuning of the entire spectrometer using samples of high- pions ceretto-phd .
During production, the full analysis chain for electron track reconstruction is at work, albeit under loose quality criteria. Events which contain at least two electron tracks with 50 MeV/ are stored in a database for further processing. As millions of events have to be processed with sophisticated pattern recognition algorithms, the production is time consuming. The 1995 production on the CS2 parallel computer at the CERN CN division with 32 SUN-SPARC2 processors took about 10 weeks; the 1996 data were preprocessed on a PC farm in several turns with readjusted production filters during 4 months. The final data analysis mainly deals with the optimisation of the pair sample.
3.2 Reconstruction of electron tracks
The reconstruction of electron tracks in the present analysis takes full advantage of the external tracking detectors, the doublet of SiDC’s before the RICH spectrometer and the Pad Chamber after it.
3.2.1 Coordinate systems
Raw-data detector coordinates
In RICH detectors and in the Pad Chamber, hits are encoded as pad amplitudes in a two-dimensional mesh of coordinates of the ‘pad plane’. The natural unit is the pad size of 2.74 mm in RICH-1, and 7.62 mm in RICH-2 and the Pad Chamber, which is used up to the reconstruction of rings and ring centres in the RICHes, and of hits in the Pad Chamber.
For the SiDC’s, the symmetry of the radial drift field and the circular ring of anodes is maintained at the raw data level: the intrinsic coordinates are anode numbers (0-359) for the azimuth location and time bins (0-255) of 20 ns for the drift time.
Local detector coordinates
RICH detectors measure angles of particle trajectories that connect centres of Cherenkov rings with the vertex point, the units are , expressed by pad size and focal length ; these are = 2.18 mrad and 1.82 mrad in RICH-1 and RICH-2, respectively. The local coordinates in paraxial approximation are expressed by the tangents of the polar angle . Because of spherical aberration by the mirrors, the expression using instead turns out to be a much better approximation,
| (5) |
where are the coordinates of the origin of the pad plane. In the off-line analysis, the angles and are evaluated by ray tracing using look-up tables to correct for local modulations in focal length.
Hits in the silicon-drift detectors are given by their radial position (referring to the centre of the wafer) and azimuth angle which is defined as in the global laboratory system. The transformation from drift time to radius requires knowledge of the electron drift velocity with possible spatial as well as temporal changes.
Laboratory coordinates
Once track segments of several detectors are to be joined, each detector is put into a three-dimensional global laboratory system with its own geometric calibration parameters, i.e. small -shifts of detector axes away from the optical axis, rotations around , tilts, etc. This global laboratory system uses left-handed Cartesian coordinates with the -axis along the beam and the - and -axes pointing to the right and upward, respectively, when looking with the beam. The origin is in the centre of SiDC-1. As we do not measure space points within the short magnetic field, it is convenient to work with straight trajectories all along from vertex to the Pad Chamber, and store the particle’s momentum and charge sign derived from magnitude and sign of the azimuthal deflection.
Event coordinates
Eventually, in the global event coordinate system, the event vertex is taken as the origin, and tracks are described by polar coordinates , at the vertex.
3.2.2 Hit finding in the SiDC’s
The 360 readout channels of anodes and the 256 time slices, or time bins, sampled by the FADC, span a matrix each cell of which is assigned a 6-bit non-linear raw-data amplitude. The amplitudes are linearised and pedestals are subtracted.
The data field is then searched for contiguous regions of cells with nonzero amplitude. Each cell is attributed to one such cluster. All cells of fixed anode number within a cluster form a time sequence of amplitudes called a pulse. The signal of a minimum-ionising particle produces pulses of typically 5 time bins and is spread over 2.2 anodes on average. Pulses of less than 3 cells above a hardware threshold are discarded. Examples of such pulses on a few neighbouring anodes are displayed in Fig. 7. Due to complementary signal transmission, the pulses are free of pickup which plagued previous runs.

The centres of gravity of the pulses are calculated by Gaussian regression, or by Gauss fits taking the known, drift time dependent widths from a table. After time , the drifting electron cloud arriving at the anodes has developed a time-spread due to diffusion of . Here 35 10-4 mms is the electron diffusion constant in silicon and denotes the drift velocity which varied in the range 6.0 - 8.5 mm/s depending on the voltage setting. The charge pulse is folded with the quasi-Gaussian response of the shaper, , so that the time spreads add in quadrature. The shaping introduces a ballistic deficit in amplitude which is corrected for. Pulse heights saturated in the peak cells are approximately reconstructed.
The stop-pulse correction mentioned in sect. 2.2 removes the random phase jitter. The conversion from drift time to drift distance is presented in sect. 3.2.
Pulse trains on neighbouring anodes of the same cluster are merged into a hit if centres of gravity differ by less than one time bin. The hit coordinate in azimuthal direction is calculated as the centre of gravity of the contributing pulses, weighted by their peak amplitudes. The hit amplitude is the sum of the pulse amplitudes.
3.2.3 Hit finding in RICHes and Pad Chamber
Signals of the RICH detectors and the Pad Chamber are read out from the checkerboard-like arrangement of pads which receive the charge amplified in multi-wire proportional chambers. The same hit-reconstruction algorithm is used for these detectors.
Adjacent pads with amplitudes above a readout threshold are connected to clusters some of which are caused by background and electronic defects. Typical background clusters, like long and thin stripes from ionising particles on oblique trajectories, or clusters with many pads in saturation, are removed with the help of various cleaning algorithms. Remaining clusters are split into regions containing one local maximum and are identified as UV-photon hits in the RICHes or charged-particle hits in the Pad Chamber. Hit centres are calculated as the centres of gravity of the contributing pads.
3.2.4 Ring candidates in the RICH detectors
RICH detectors require an additional step of pattern recognition to search for rings with asymptotic radius produced by electrons robust96 . A typical RICH-1 ring is shown in Fig. 8. The ring search is done using the Hough transformation hough62 from the data field of the pad plane into the ‘Hough array’ (or ‘parameter space’) which has the same dimension. A given cell is the ‘image’ of all data points (hits) on a circle around that cell, and its ‘Hough amplitude’ is the sum of the data amplitudes on that circle. A ring candidate shows up as a peak in the ‘Hough array’ which is the higher the more photon hits, or illuminated pads, lie on the ring. In practice, a ‘digital’ Hough transformation is used: all pads with signal amplitudes above a defined threshold enter with unit weight into the sum amplitudes, irrespective of their amplitudes.
The event display in Fig. 8 demonstrates that rings can be formed also by random arrangement of single photon hits, some of them produced by pions near the Cherenkov threshold. The first step in ring pattern recognition is a linear Hough transformation of the pad plane onto the parameter plane. Besides the real maximum in the Hough array, there are other local maxima connected to fake ring centres. As a counter measure, a second, non-linear Hough transformation is performed which assigns a relative weight to each cell in the Hough array such that each hit counts most for its most favourable ring-centre. This way fake rings are suppressed, as can be seen from Fig. 8, by a larger gap that has developed between the amplitudes of the real and the fake rings. The parameter to select real rings at this stage of the analysis is the amplitude after the second Hough transformation.
All surviving ring candidates are assigned their final centre coordinates by a robust estimation which is based on iterative re-weighted least-squares fits of circles with asymptotic radius to the hits. A second fit with variable ring radius should eliminate charged pions which have a non-asymptotic radius. The function minimised is a modified where the fit-potential varies in a Gaussian way (instead of quadratically) with the distance to the minimum. For an extensive description of the fitting algorithm see Refs. ullrich-phd ; ring_fit . Other parameters besides the amplitude in the Hough array, like the number of hits and the spread of the hits around a perfect circle, can be used for fake-ring suppression.
Ring reconstruction efficiency is determined by Monte-Carlo simulations with a cut on the number of photon hits, assumed to be Poisson-distributed. At the stage described up to here, ring reconstruction efficiencies of about 85 are still confronted with many fake rings, about 10 to 20 for one reconstructed ring that is real. It was in anticipation of such alarming majority of fake rings that the collaboration decided in 1994 to implement full external tracking pb-proposal94 .
3.2.5 Calibration of the SiDC telescope
To first approximation, the relation between the drift distance and drift time is linear. From the known radial extension of the active area and the total drift time , the drift velocity can be calculated as
| (6) |
where is the inner edge of the active area and corresponds to the anode radius.171717The anode radius is 32 mm and 42 mm for the 3-inch and 4-inch detectors, respectively, is typically 10 mm and the total drift time 3 to 5 s.. The corresponding drift time is
| (7) |
where
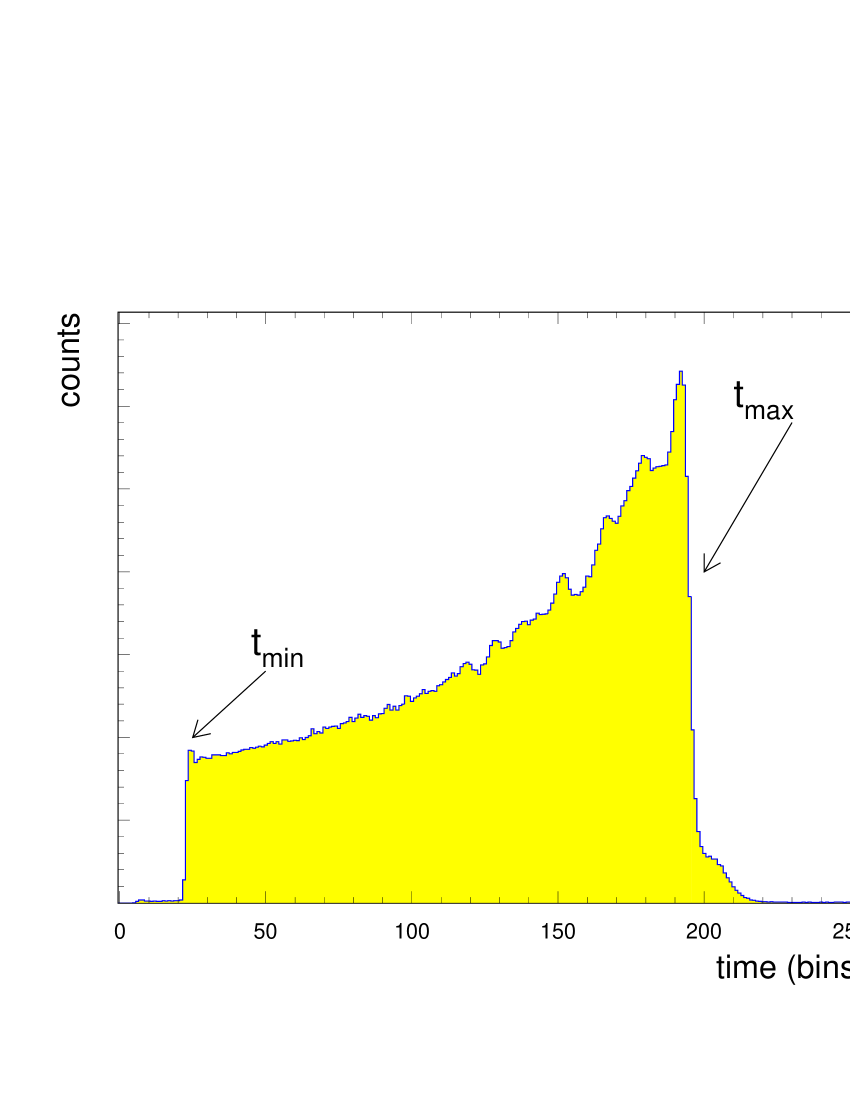
is the time corresponding to the shortest drift path (ionisation directly under the anode), and the drift time of particles starting at . A typical hit distribution as a function of drift time is displayed in Fig. 9. By fitting the edges of the drift-time spectrum, the values of and are determined.
Following such preliminary calibration, the geometrical alignment of both detectors and the determination of the interaction vertex is performed. Other corrections, such as the stop-pulse correction, corrections on drift-velocity variations due to temperature changes, etc., are done while maintaining the reconstructed vertex position.
3.2.6 Vertex reconstruction
Once hits are reconstructed, the information of hit positions in the laboratory coordinate system is used to combine hits to tracks and find the vertex position to which almost all tracks of a given event point to. The procedure to minimise the quadratic sum of hit mismatches between the two detectors and its iteration is extremely time consuming. We used therefore a robust vertex fitting approach robust97 : all hits in SiDC-1 and SiDC-2 (typically more than 100) are combined to straight track segments and a weighted sum of their projected distances to the assumed vertex position is calculated. In the next iteration, this centre of gravity becomes a new starting value for the vertex position and each track segment gets a new weight according to its deviation from the mean value in the step before. After the position of the vertex is determined, its -position is redefined as the exact position of the closest vertex disc.
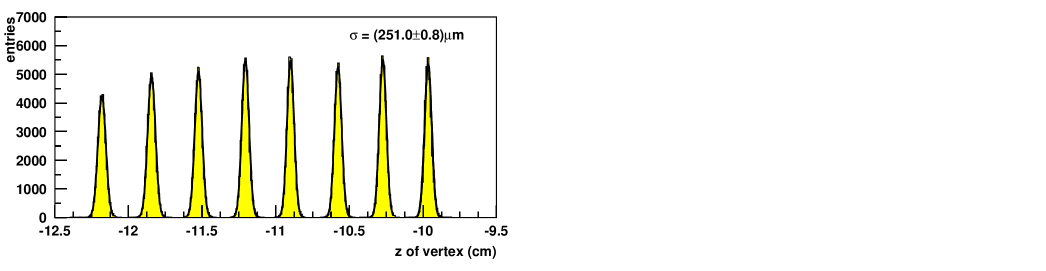
Figure 10 displays the density of reconstructed vertex positions along the beam. The peaks reveal the positions of the eight discs of the segmented target assembly with a spacing of 3.2 mm. On average, the reconstruction was done with 160 charged particles per event. The data shown in Fig. 10 was accumulated over 105 Pb-Au events, or six hours, and demonstrates a certain long-term stability. The resolution181818i.e. the standard deviation in the mean position of m is sufficient to identify the correct target disc without ambiguity191919due to the unknown location of the vertex inside the 25 m thick foil, there is an rms error of 25/, about 7 m. .
More critical for tracking accuracy is the precision with which the vertex can be localised in the plane transverse to the beam, as there are no fixed points. To measure it we used stiff pion tracks with 1.2 GeV/ to minimise multiple scattering. The scatter plot in Fig. 10 accumulates over many events the distance in and between the actual event vertex (determined from all tracks) and the point where a given pion track intersects the respective target disc. Projecting on the axes, we obtain the 1-dim distribution shown to the far right; a lateral resolution of 28 m ( and ) is derived. The transverse vertex resolution is therefore . By choosing the vertex position in the -plane as the origin of the event coordinate system, we account for event-by-event displacements within the diameter of the target.
3.2.7 Charged particle tracks
Silicon-drift track segments are constructed by connecting the vertex point to hits in SiDC-2 which lie within the fiducial acceptance. A track segment is accepted if there is at least one hit in SiDC-1 within a predefined window around the point of intersection; for more than one hit, the centre of gravity is taken. Once the interaction vertex and the SiDC track segments are reconstructed, the trajectories of charged particles are extrapolated downstream to the Pad Chamber. If a pad hit is found within a certain fiducial window, a track candidate is created.
The sizes of the fiducial windows are expressed as multiples of the rms widths of the corresponding matching distributions; usually these are 5 during production and 3 during the final analysis. The fiducial windows were taken momentum-dependent to reduce efficiency losses at low momentum due to multiple scattering.
The matching of tracks in direction between detectors separated by the magnetic field requires special attention since such tracking window corresponds to a momentum cut. To avoid loss of tracks by multiple scattering for large deflection, the fiducial window in direction is opened to assume the shape of a butterfly. During the production stage, we use a tracking window in of 0.6 rad. This corresponds to the pt-cut of 50 MeV/ mentioned already. During off-line analysis, the size of the butterfly is approximated by a sector of 100 mrad in , corresponding to a lower momentum cut-off of 1 GeV/, the standard cut of 200 MeV/, and 3 mrad in direction. Matching distributions will be discussed in sect. 3.2.
The contribution of background hits was estimated by applying detector rotations. Since the hits in the SiDC’s are highly correlated, the main background contribution comes from random combinations of SiDC track segments with hits in the Pad Chamber. By rotating these hits in a given event by a random angle with respect to the silicon detectors, the true physics signal is destroyed and only background tracks remain.
By requiring that track elements from all five detectors match within three standard deviations of the detector resolutions combined with the rms spread due to multiple scattering, fake tracks are reduced to a negligible level.
3.2.8 Straight pion tracks for calibration
Straight tracks of high-momentum pions are an important tool for fine-tuning the spectrometer calibration ceretto-phd . Pion identification uses external tracking by the SiDC’s and the Pad Chamber to predict ring centre positions in the RICHes. Pions have been selected under tight quality criteria regarding matching, number of photons on Cherenkov rings, and clean environment around rings.
To extend the SiDC track segments into the Pad Chamber, only a narrow window of mrad in azimuth is searched for a matching hit, variations in deflection being very small. In polar direction, the Pad Chamber is searched merely over the matching window between the two detectors since multiple scattering is negligible. All hits found are candidates. From the coordinates before and after the field, the ring centres in the RICH detectors are predicted. The pointing to RICH-1, without deflection, is unproblematic. With the momentum information derived from the azimuthal deflection between SiDC and Pad Chamber, the tracks are extrapolated into RICH-2, behind the field.
Photon hits that fall into the vicinity of the predictors are collected and used as input for a robust fitting algorithm robust96 . To find centre and radius of the ring, the rms deviation of hit positions from a circle with radius around the ring centre is minimised in a Gaussian fit potential with three free parameters. Once the radius is found, the pion momentum is re-evaluated from the relation
| (8) |
where stands for the asymptotic ring radius.
3.2.9 Spectrometer calibration
For the analysis of the 1995 and 1996 data every spectrometer component was calibrated. Several successive steps were
necessary to align all detectors and to derive appropriate correction functions for the analysis chain. A first rough calibration was performed to adjust detector offsets and to correct small rotations and tilts.
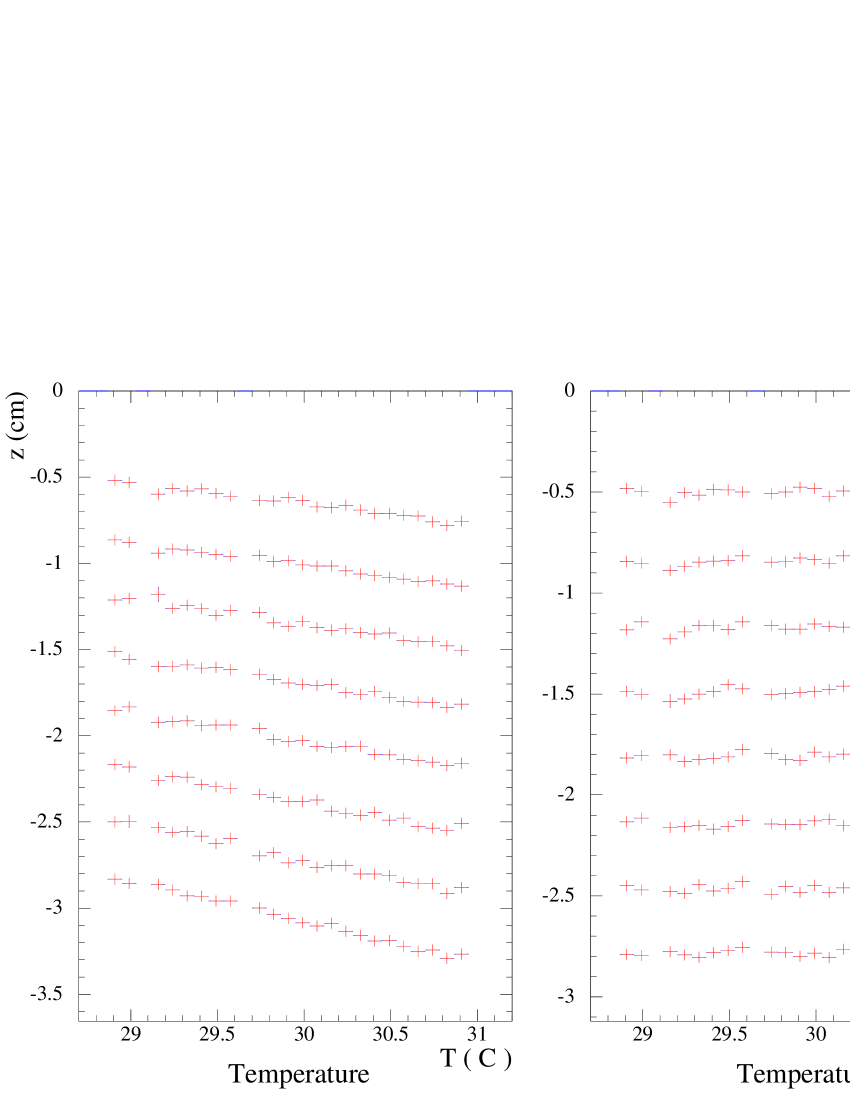
Since electron mobility in silicon strongly depends on temperature202020The electron mobility depends on temperature as ., the calibration is strongly affected by temperature variations. To keep the calibration stable over periods of hours, we employed the simple and fast method by which the position of the upper edge of the drift time spectrum is monitored to provide an ‘online’ drift-velocity stabilisation. The feedback procedure successfully stabilises the calibration as can be seen from the resulting stability of vertex positions in a set of test measurements taken while the cooling was switched off, Fig. 11. Under normal running conditions, the temperature variations were typically below 0.5∘C over 12 hours.
On even longer time scales, drifts in the calibration of the SiDC’s were prevented employing the fixed reference provided by the Pad Chamber using high high-statistics pion samples. The method registers the deviations of hits in either one of the SiDC’s from the straight line that connects the event vertex with a selected hit in the Pad Chamber; it works fine in a pre-calibrated system. The effects of fine tuning the parameters and of SiDC-1 can be seen in Fig. 12.
Response from RICH-1 when given close scrutiny by the absolute reference grid of the Pad Chamber revealed slight deformations of the spherical mirrors which caused non-linearities in polar angle. Following the observation that the radius of curvature of mirror-1 decreases towards the rim, application of a small -dependent variation in the focal length removed this problem.
3.2.10 Matching quality

Starting with an internal calibration of the SiDC vertex telescope, the remaining detectors are aligned to the centre of SiDC-1. Internal consistency and quality of the readjusted calibration can be evaluated from the residual offset in centres of
gravity, the widths of the matching distribution close to the peak, and the amount of background in the tails, for all detector combinations. Examples of matching distributions are shown in Fig. 13.
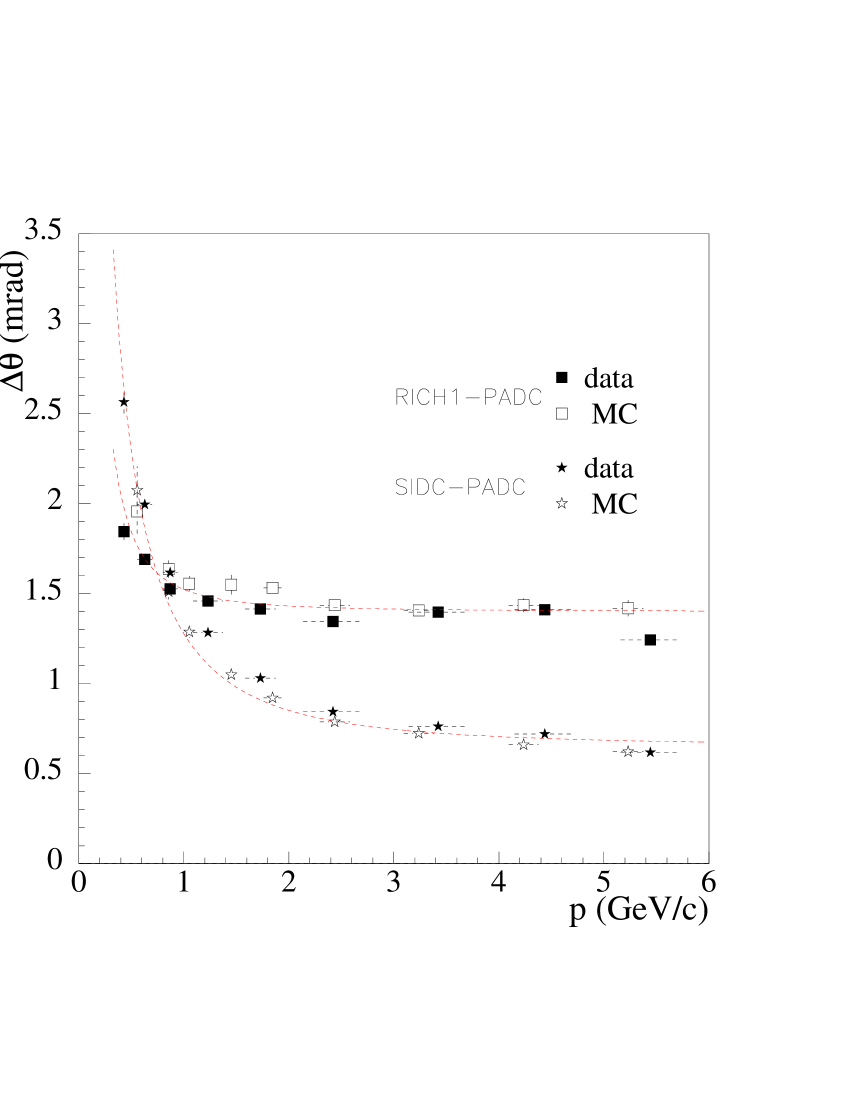
At low momenta, the matching quality deteriorates because of multiple scattering in the material, and it is no longer determined by the detector resolutions alone. The widths of the matching distributions in , plotted for SiDC - Pad Chamber and RICH-1 - Pad Chamber shown in Fig. 14 for measured and simulated spectra, exhibit very well the dominance of the multiple-scattering contribution increasing with over the momentum-independent detector resolution towards small momenta. The simulations with the actual spectrometer parameters are shown by dashed lines. Final track selection is achieved by appropriate momentum-dependent cuts in the matching distributions.
3.3 Momentum analysis and mass resolution
Since particles passing the SiDC’s and RICH-1 have experienced no magnetic field, these detectors are used as zero-deflection reference.

The deflections of charged particles of momentum between the RICHes and between the SiDC’s and the Pad Chamber were given in sect. 2.4. The best resolution is obtained from all possible detector combinations, weighted by the respective accuracy. The result of the simulation with the measured detector resolutions as input is shown in Fig. 15. By detailed Monte Carlo simulation which realistically describes the individual detector resolutions and the quality of the matching distributions, the overall resolution is described by the function
| (9) |
with in GeV/. The momentum dependent part is due to detector resolutions, the constant part due to multiple scattering. The mass resolution at the is about 6, at the about 7.
3.4 Rejection of combinatorial background
With a cut of only 50 MeV/ at the production level, an important part of the rejection is already achieved: very soft tracks are removed, the tracks of all reconstructed conversion and Dalitz pairs are marked and taken out of the further analysis, including pairs with only one electron of 200 MeV/. Only then is the single-track -cut tightened from 50 to 200 MeV/ which reduces the combinatorial pair background by about a factor of 10 while keeping 97 of signal pairs. Tracking cuts are narrowed down from 5 to 3. Together with increased requirements in track and ring quality, this results in a drastic suppression of fake tracks as mentioned before.
The most powerful rejection tools on the pair level derive from the fact that target conversions and a large fraction of Dalitz decays produce close tracks. These are either registered as single hits of ‘double-dE/dx’ in the SiDC’s when the separation is less than about 3 mrad, or as a ‘double ring’ in RICH-1 when the two rings coalesce into a single structure for separations below 8 mrad; or as more or less well resolved tracks, still considerably closer than the mean spacing of charged particle tracks in the SiDC’s or of electron tracks in RICH-1.
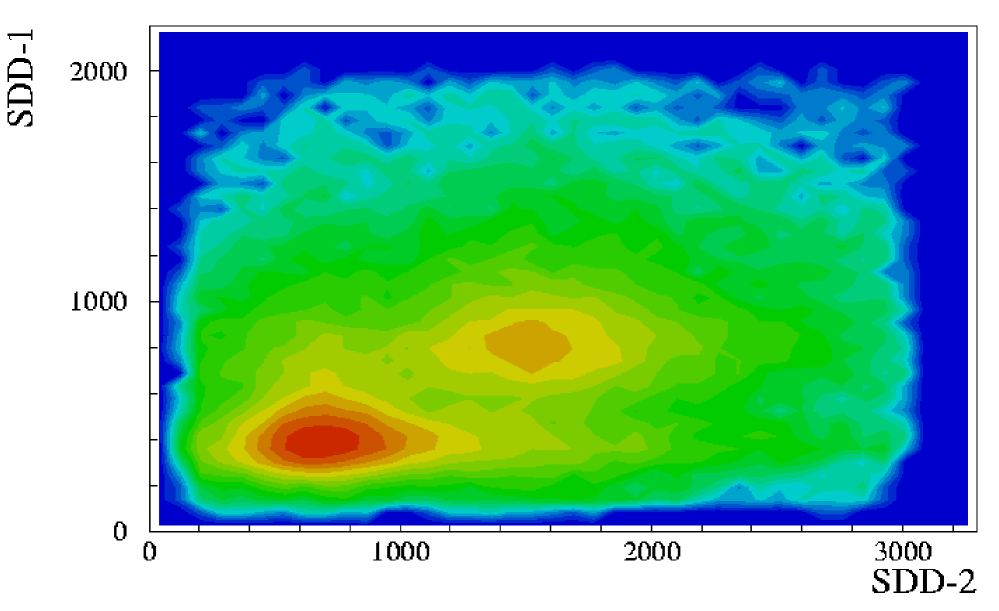
To maintain high rejection power also in the region between perfect overlap and resolved double hits, we use a ‘summation’ window in the SiDC’s of 5 mrad in which hit amplitudes are summed up212121This allowed to relax demands on double-hit resolution and thereby to avoid excessive (and mysterious) ‘hit splitting’.. Figure 16 shows a two-dimensional plot of the hit response in SiDC-1 vs SiDC-2 obtained this way. It demonstrates that with an appropriate two-dimensional rejection-cut, photon conversions in the target are efficiently rejected without cutting much into the Landau tail of single-hit distributions. RICH-1 identifies close tracks of conversions and Dalitz pairs by the number of photon hits, which suffers severely from pile-up losses, however. Alternatively, we use directly the analog sum of the gain-corrected pad amplitudes to identify ‘double rings’. Photon conversions occurring in SiDC-1 differ in response from target conversions only by producing on average a single-hit signal in SiDC and can be recognised by such signature.
To be specific, we use the following four rejection steps which evolve in complexity with the information gained along the trajectories:
-
1.
Tracks are rejected if the amplitudes of the 5 mrad summation window in both SiDC’s are larger than the typical single hit response encoded by parameters
and . -
2.
Conversions in SiDC-1 are rejected by the requirement that the amplitude in SiDC-1 is below and the amplitude in SiDC-2 above , summed over a 7.5-mrad window; and by observation of a double ring in RICH-1.
-
3.
A track with a double ring in RICH-1 is rejected already if is surpassed in only one of the SiDC’s. Besides improving rejection efficiency in general, this cut rejects conversions in SiDC-2.
-
4.
Tracks are rejected if another ring in RICH-1 is found within a wider window of 35 mrad. To avoid excessive vetoing by accidental structures, the second ring is required to be of high quality and to connect to a track segment in both SiDC’s.
A few comments are in order. The search in the SiDCs for hits near
tracks cannot be extended to larger distances because of the increasing chance to find a pion, vetoing the signal. For the purpose of ‘Dalitz rejection’, the veto is better based on RICH-1 where the inspection area can be opened up to 35 mrad without much signal loss because the density of electron tracks is so much lower. The strategy described above is quite successful in rejecting conversions but even with the close-ring cut it is of limited power in rejecting -Dalitz pairs because of the larger opening angles involved.
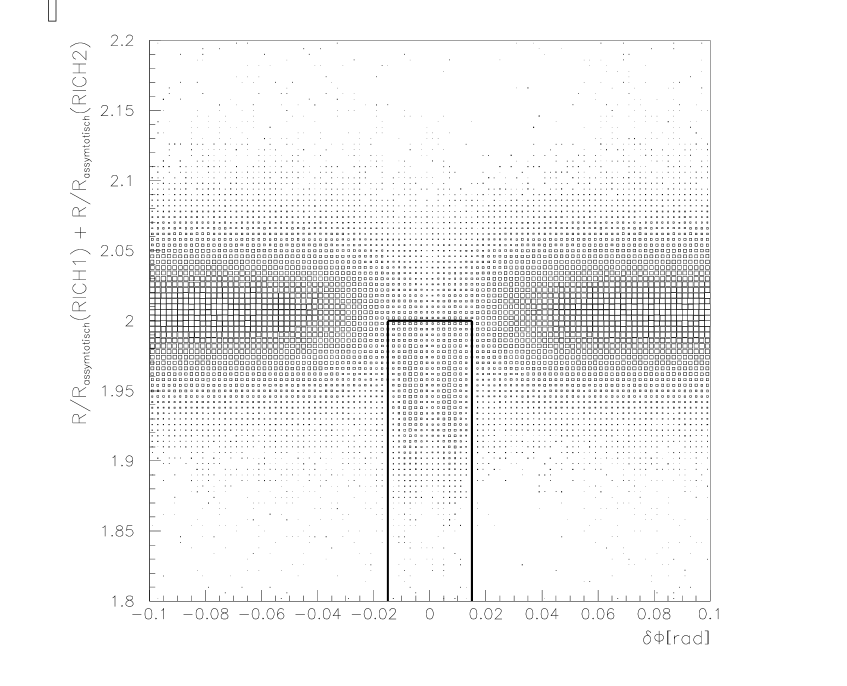
In the last step we also reject surviving charged pion tracks. Figure 17 is a scatter plot of track deflection as abscissa, and the sum of the reduced ring radii in both RICHes on the ordinate; this quantity only depends on the Lorentz factor. Because of different mass compared to electrons, pions of same momentum (deflection) have a different (radius). It is seen that pion tracks even with asymptotic radius are clearly distinguished from electron tracks by virtue of the much smaller deflection in the field, and they can be rejected by a two-dimensional cut in both RICH detectors on ring radius vs deflection. This cut was used only in the ’96 analysis; it improves the signal-to-background ratio at large masses and has little impact at lower masses.
3.5 Optimising signal quality
In tuning the parameters of quality and rejection cuts, we strictly avoided to optimise on the data itself. Such practice is known to increase the risk of statistical fluctuations producing spurious, misleading results. Rather, the signal efficiency was determined by overlaying Monte-Carlo-generated tracks chosen from the hadronic cocktail on real events and measuring the rate of successful reconstructions using the quality and rejection cuts as in the current step of the data analysis. The signal efficiency may also be monitored and optimised using a sample of fully reconstructed Dalitz pairs socol-phd ; damjanovic-phd . The rejection steps were also tuned by Monte-Carlo techniques with generated conversions and -Dalitz decays. Such a Monte-Carlo simulation of the background is quite demanding and was only achieved in the 1996 data analysis lenkeit-phd . In the 1995 analysis, the background was taken from the data sample itself.
By these procedures, each analysis cut is arbitrated objectively according to how much in background rejection is gained for how little loss in signal efficiency. A clear understanding of what is meant by an ‘optimal’ balance is provided by the ‘equivalent background-free signal’222222It is equal to the number of signal pairs of the same statistical significance if there would be no background.
| (10) |
For a given rejection cut which reduces the signal from to and rejects a fraction of the background, the ratio
| (11) |
should be maximised.
In summary, the rejection steps together reduce the number of background pairs by factors of 15 and 12 for mass above and below 200 MeV/, respectively, while signal pairs are reduced by only 20.
3.6 Pairing and subtraction of combinatorial background
The combinatorial background of unlike-sign pairs can be accounted for by the like-sign pair sample because by lack of any physics source the latter is purely combinatoric,
| (12) |
Here, denote the numbers of and pairs, respectively. The relation is exact when charge symmetry is fulfilled. The number of signal pairs is obtained by subtracting the number of background pairs from the number of unlike-sign pairs,
| (13) |
The variance in is approximately232323Combinatorial pairs are non-Poissonian, their variance exceeds the mean. Because the density is only of order per event, the deviation from eqn. (3.14), however, is below 5.
| (14) |
Typically, the open pair signal accounts for only a small fraction of our total unlike-sign pair sample for masses above 200 MeV/.
The asymmetry induced by Compton electrons and decays is below 1 and would alter the factor of 2 in eqn. (3.12) by less than . It is worthwhile to note that eqn. (3.12)

remains a very good assumption also in case of a small imbalance in the number of tracks of positive and negative charge, be it due to different acceptance or reconstruction efficiencies, or to a generic imbalance socol-phd . For an asymmetry of 10 in the number of positive and negative tracks, the factor 2 in the above expression would decrease by 2 only.
The asserted symmetry has been tested by generating purely combinatorial pairs of either type, like-sign and unlike-sign, from data by ‘reversing’ the rejection cuts. The recipe is the following: prepare a clean sample of conversions and Dalitz decays and recombine all tracks such that none meets its original partner. This sample is void of signal pairs and in every respect resembles the experimental pair background. The mass spectra of both components of this artificial background sample are compared with each other in Fig. 18. No significant charge asymmetry is visible between the mass spectra of the like-sign and the unlike-sign pair background, neither in shape nor in absolute yield. Over the full mass range, the ratio of the integral yields is
| (15) |
which excludes an asymmetry larger than 1 at 90 confidence. We shall return to this topic in sect. 6.5.
Let us take an alternative route of estimating combinatorial background. A philosophically correct way is to generate unlike-sign pairs by combining strictly uncorrelated tracks chosen from different events under the same kinematic constraints as applied to the data. This is commonly referred to as the mixed event method. Practically, efficiency losses that occur in the true data for close tracks have not been accounted for. A comparison of combinatorial mass spectra obtained by the two methods from the full 1996 data set
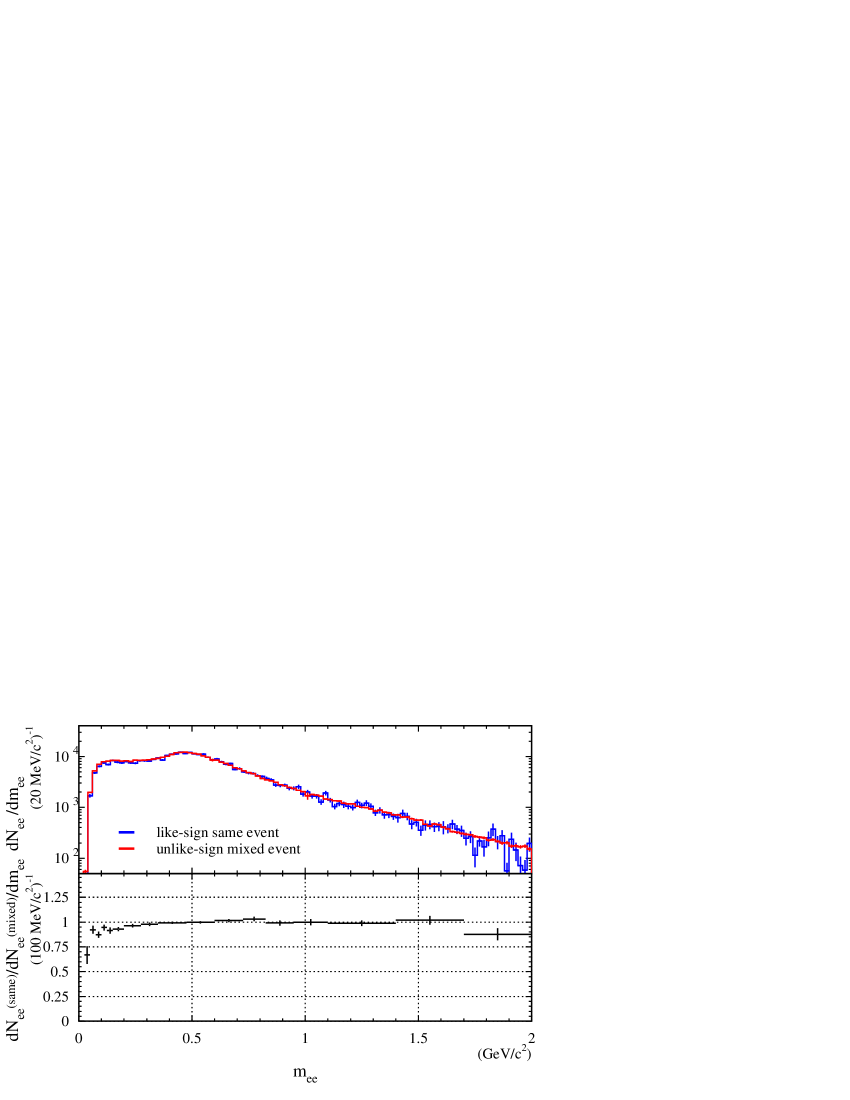
is displayed in Fig. 19. The coarse comparison on a log scale (top panel) does not show deviations. On a finer linear scale (bottom panel), the ratio indicates that the like-sign pairs loose up to 30 compared to the mixed-event generated unlike-sign pairs - which is, however,

due to the mentioned loss in detection efficiency at close track separation; an effect not present in the current realization of the mixed-event method. Yet, the analysis allows to conclude that above 300 MeV/ the ratio stays at unity within a band of less than 1.5.
Measured mass spectra of like-sign and unlike-sign pairs are shown in Fig. 20. For comparison, a like-sign pair background has also been generated by random pairing of electron tracks with momenta, polar angles and transverse momenta chosen at random from measured distributions. The result of such simulation is shown in the figure and compares very well with the measured like-sign mass spectrum. The simulated opening-angle distribution (not shown) also agrees well with the measured distribution.
Figs. 18, 19 and 20 display the typical shape of the combinatorial mass spectrum for the applied cut on track . This kinematical condition produces a falloff towards low masses and a broad peak at about twice the minimum track . The peculiar shape of the combinatorial mass spectrum peaking around mass of 500 MeV/2 where the enhancement dominates raises doubts whether the combinatorial background has been correctly assessed and subtracted. We return to this issue in sect. 6.5 to assert an unbiased background handling.
3.7 Spectra and statistical errors
The raw signal counts and their relative statistical errors are obtained by subtracting the combinatorial background channel by channel from the spectrum of unlike-sign pairs,
| (16) |
The counts per channel add up to the total counts known already from eqns. (3.12) and (3.13),
| (17) |
Pair yields per event, corrected for reconstruction efficiency and normalised to , are written symbolically
| (18) |
with a scaling factor and for efficiency correction, possibly channel dependent. Relative statistical errors are determined by the raw data counts,
| (19) |
To reduce staggering in signal counts due to channel fluctuations in the background spectrum, ‘smoothed’ combinatorial pair spectra free of bin-to-bin fluctuations have been subtracted. The method allows, moreover, to limit the fluctuations in data points of background-subtracted spectra to truly statistically independent errors; it is discussed in the following.
The Monte-Carlo generation of background spectra is described in the previous section. The subtraction from the unlike-sign pair spectrum is done bin by bin,
| (20) |
The fractions add up to . The bin-to-bin errors
| (21) |
in our case of amount to a fraction quite accurately of of the full error of (3.19). The finite sample error in , to which the smooth background spectrum is normalised, was neglected so far. It contributes to each channel a share of the same magnitude as the bin-to-bin error itself242424because these errors add in quadrature..
Since the ‘normalisation’ errors common to all channels differ in size, according to the magnitude of in eqn.(3.20), they cannot be represented as an error in scale. However, there is no need to show them separately; we only have to keep in mind that the data points have normalisation errors which are of the same size as the statistical bin-to-bin errors which will be displayed, but are tightly correlated within the entire spectrum.
3.8 Centrality determination
The measurement of absolute cross sections is hampered by the fact that the number of particles that actually pass the segmented target is not precisely defined; this is because the diameter of the Au disks is not much larger than the beam diameter. We decided therefore to calibrate the centrality of collisions by the shape of the pseudo-rapidity density of charged particles as measured by the SiDC’s. Once the measured distribution is corrected for various instrumental distortions, it is used to calibrate the charge density obtained from minimum-bias UrQMD calculations urqmd . These still differ from the measured distribution at the low- tail due to the non-ideal response of the interaction trigger. The final step consists in describing the triggered distribution by a linear combination of UrQMD calculations belonging to different impact parameters. These steps are described below.

3.8.1 Charged-particle density
Charged-particle density in the range 23 is derived off-line from the number of tracks that emerge from the event vertex and intersect the two SiDC’s sufficiently close to reconstructed hits. The determination of the track reconstruction efficiency is a rather complex problem. To the percent accuracy required, it is influenced not only by hardware imperfections (i.e. dead anodes, electronic noise, pulse shape), but also by the quality of hit and track reconstruction. In particular, ‘pile-up’ effects due to finite double-hit resolution and artificial hit splitting are the most important effects to be corrected for. To that goal, we simulate charged particle tracks in the SiDC’s generated from UrQMD events. The analysis of the Monte-Carlo events uses the standard data analysis software, besides larger matching windows of 5 . Details are described in sect. 4.
The functional dependence of the inverse of the reconstruction efficiency on the measured number of charged particles is of the type
| (22) |
The intercept at corresponds to the inverse ‘static’ efficiency and includes not only losses due to dead anodes, but also gains from artificial hit splitting. It amounted to 97 and 93 in 1995 and 1996, respectively. The parameter is about (6-7)10-4 which corresponds to about 10 relative losses, considerably more than expected from pile-up alone.
The corrected multiplicity distribution of the trigger-selection is shown in Fig. 21. In the middle part and at the high- side, the shape of the distribution is supposed to be an undistorted image of partial cross sections, but not so at low where the trigger profile of the MD with threshold set at 100 becomes visible (see sect. 2.6). The thresholds of the centrality trigger corresponded roughly to 30% for ’96 and 35 of the total inelastic cross section for ’95.
3.8.2 Calibrating the centrality using UrQMD calculations
A more precise calibration of the centralities is described in the following. Minimum-bias distributions obtained by UrQMD (version 1.3) have been scaled slightly to make their upper corners coincide with the measured trigger distributions. From the UrQMD minimum-bias collisions several centrality classes are sorted out according to certain impact parameter ranges. To reproduce the shape of the trigger profile at the lower edge of the
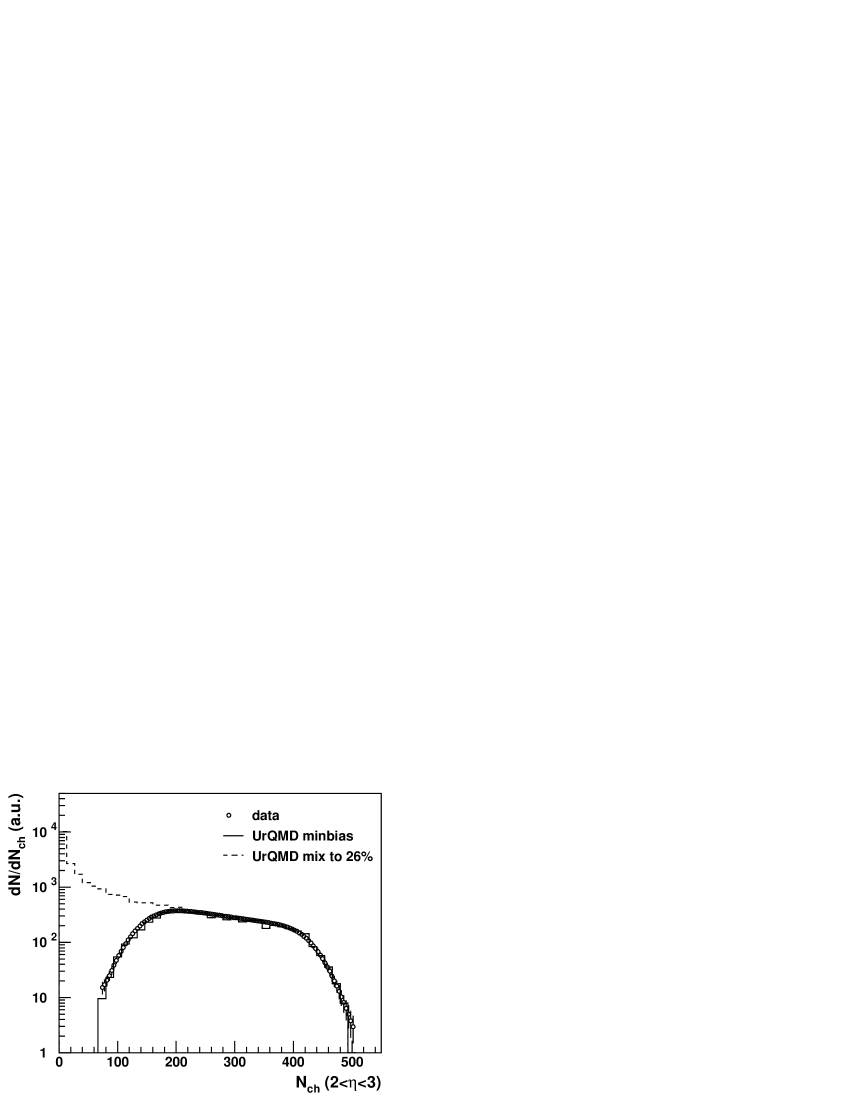
distribution, a suitable linear combination of the corresponding distributions is used. The resulting distributions are displayed in Fig. 22. The total inelastic cross section of 6.94 barn, and the trigger fractions were calculated with a geometrical overlap model. The resulting are:
| (23) |
| (24) |
The systematic error from variation in the linear combinations alone is estimated as 1.5 absolute. For the unified data, an average centrality of 28 of the top geometrical cross section has been adopted with an estimated uncertainty of about 2.
4 Monte Carlo simulation
4.1 Detector simulation
The spectrometer with all material in proper geometry has been implemented in the GEANT geant detector simulation package version 3.15. The present version of GEANT was not able to describe the number of photons per electron ring correctly, which forced us to write our own function.
The detector response is simulated by taking into account the particular signal generation including all known effects that influence position, width and amplitude. In the SiDCs these include the charge division among adjacent anodes, local variations in drift-velocity over radius, diffusion along the drift path in radial and orthogonal direction, anode-wise gain variations including dead anodes, electronic noise from the readout, and digitisation errors. In the RICH detectors we account for chromatic aberration and mirror quality. In the UV detectors and the Pad Chamber, simulations include the transverse diffusion in the conversion zone and the first amplifying gap, the digitisation effects in the last multi-wire amplification, and the noise of the readout electronics.
Most crucial but difficult to achieve is a realistic simulation of the background in which the simulated signal is to be embedded. The background is caused by charged particles, gamma rays and electro-magnetic radiation produced directly or indirectly by the collision, -electrons, and particles passing the UV-detectors.

In addition, the entire spectrometer or parts thereof might deviate from response linear with produced signal charges due to transient saturation effects of various kinds. No sufficiently reliable simulation of the background was possible up to now. We use real data events into which the simulated Monte Carlo (MC) signals are embedded. This is done by adding the MC amplitude for each single cell, or pad, on top of the data amplitude. The systematic error introduced by increasing the detector occupancy has been estimated to be negligible.
The MC signal was reconstructed using algorithms identical with those of the data analysis. By comparing the signals of reconstructed MC tracks and reconstructed data tracks we fine-tuned the parameters of the detector simulations to achieve the best description of the data. The characteristics employed for the comparison were the amplitude distributions of hits, the widths, the numbers of pads/time-bins/anodes contributing to a hit, the number of hits belonging to a ring and the local variations of all these parameters over the detectors. An example of the agreement achieved between MC simulation and data analysis in reconstruction of Cherenkov rings is shown in Fig. 23.
It is crucial to model quantitatively the response to compound signal patterns, like accuracy in reconstruction of hit positions or ring centre positions, or the number distributions of reconstructed photons per ring. Quantities of that kind depend also on characteristics of the physics input like opening-angle distributions of pairs in the sample and the polar distribution of electron tracks. They are therefore best checked on the data itself. For that purpose a special sample enriched in -Dalitz decays was extracted from the data by searching for pairs with opening angles less than 50 mrad plb422 . Such pair sample has a typical signal-to-background ratio of order one.
The properties of this sample compare well with the corresponding properties of simulated -Dalitz decays in ring-parameters and efficiency. There is but one exception: the measured ring centre resolution of the first RICH detector is worse by a factor of 1.4 compared to the MC simulation, and also deviates from the expected resolution for single photon hits. For lack of understanding, we introduce an ad hoc Gaussian random smearing of 0.9 mrad into the simulation to meet the measured value. The influence on final momentum resolution is very weak, since the azimuthal track position measured in the SiDC’s is anyhow more accurate and outweighs the RICH contribution to tracking.
4.2 Determination of reconstruction efficiency
To compare the number of reconstructed electron pairs to any physics-based expectation, an absolute normalisation is required. To correct spectra for reconstruction efficiency252525For unit pair efficiency, all pairs that have both electrons in the acceptance of the spectrometer are reconstructed., measured yields are multiplied by the inverse pair reconstruction efficiency averaged over the full sample of pair candidates. We may call this a correction ‘on a statistical basis’, in contrast to an ‘event-by-event correction’ where the invariant-mass or spectra are incremented with the inverse efficiency of that event, or of particular track candidates.
One way to determine the reconstruction efficiency is to measure the number of pairs from a well-defined physics sample, and adjusting it to the expected number. We first explain this ‘Dalitz method’ and then turn to the alternative Overlay Monte-Carlo technique.
4.2.1 The Dalitz method
Our sample of ‘Dalitz pairs’ with 200 MeV/, but opening angles larger than 35 mrad and track above 200 MeV/ is considered an excellent choice in place. It consists mainly of -Dalitz pairs and a contribution of -Dalitz pairs on the 10 level. The opening-angle cut reduces conversions to (5-10) which can be corrected for. At present, we cannot exclude the (very interesting) possibility that a strong source of thermal electron pairs may compete on the level of a few percent rapp-wambach2000 .
The required average inverse reconstruction efficiency is derived by dividing the measured number ratio of charged-particles to Dalitz pairs by the cocktail expectation,262626By lower case we denote numbers from physics simulation, by upper case measured counts.
| (25) |
With the event generator GENESIS genesis-old the number of electron pairs of the hadronic cocktail is calculated, but it is normalised to the number of neutral pions; using the -to-charged-particle ratio, we obtain the cocktail reference ratio in the required normalisation to charged particles,
| (26) |
Note that only the cocktail part factorises into averages of electron pairs and charged particles272727Since all components of the cocktail scale linearly with , ratios are constant. while the experimental average does not, since depends, via reconstruction efficiency on .
The recipe that follows is to average the ratio of the number of charged particles to the number of Dalitz pairs over all events of a given multiplicity class, and divide by the cocktail ratio to obtain the factor 1/ by which the raw data counts have to be multiplied. The discussion emphasises the importance to measure the reconstruction efficiency as a function of .
4.2.2 The Overlay-Monte-Carlo method
A method of wider application is to reconstruct a MC-simulated sample of electron pairs from the sources under consideration, be it Dalitz decays with masses below 200 MeV/ as discussed below, or the full hadronic cocktail of electron pairs, always under condition of all acceptance and analysis cuts and using standard analysis software. For realistic background conditions, the simulated pairs are overlaid one by one on data events of given
| Reconstruction efficiency | |
| piecewise compound | |
| SiDC1 | 94 |
| SiDC2 | 88 % |
| SiDC-tracks | 83 84 |
| RICH1 | 81 % |
| RICH2 | 86 % |
| MWPC | 96 % |
| full tracks | 55 55 |
| pairs | 31 30 |
, and the desired correction factor is given by the average of the inverse probability of successful reconstruction,
| (27) |
The pair efficiencies can be decomposed into the products of the track efficiencies of the detectors for a meaningful check on the reliability of the simulation. Table 1 compares full-track and pair efficiencies for a standard Dalitz sample with those obtained by piecewise multiplication of individual detector efficiencies; all efficiencies were measured by the Overlay-Monte-Carlo technique. The close agreement between the two indicates that the procedures of track reconstruction and pairing work properly.
A further reduction in pair efficiency by about a factor of two occurs in the course of the background rejection discussed in sect. 4.4; also these efficiency losses are understood by the MC simulations.
The Overlay-MC method applied to high-mass electron pairs suffers from the low efficiency combined with acceptance losses which forbid to collect sufficient statistics samples. We have therefore based all corrections on products of track

efficiencies constructed in such a way that on the one hand the correct dependence of the Dalitz pair efficiency as shown in Fig.24 is reproduced, and on the other, that the specific differences in pair efficiency are taken care of in an approximate way. Those arise from the -dependent hit density and are treated separately.
4.2.3 dependent efficiency
Reconstruction efficiencies for Dalitz pairs with mass below 200 MeV/ are displayed in Fig. 24 as a function of charged-particle rapidity density. The pairs are filtered for opening angles 35 mrad to reduce conversions, and they obey the condition 200 MeV/ on single-electron tracks. For the data points, the dependence on is derived by postulating that sources scale with while the absolute magnitude is fixed by normalising to the MC simulation as explained above. We observe a loss in MC pair efficiency by a factor of 2.2 when rapidity density is raised from 150 to 350. This degradation factor for the three ’96-data analyses socol-phd ; lenkeit-phd ; hering-phd amounts to 2.300.13; the individual results lie remarkably close considering the large spread in absolute efficiencies. The causes of the efficiency loss are twofold. For one, the recognition of hits in the SiDC’s and of Cherenkov rings in the RICHes is deteriorated by an increasing number of background hits. In addition, with increasing track density also the chances increase that rejection of background tracks accidentally vetoes nearby signal tracks.
The strong decrease of pair efficiency with agrees very well with the Overlay-MC simulation also displayed in Fig. 24. In the ’96 data analyses, this curve is used for efficiency correction on an event-by-event basis: signal pairs are stored with weights given by the inverse of the efficiency at given event multiplicity. The same procedure was applied in the ’95 data analysis, but the dependence is considerably weaker; the ratio quoted above is only 1.4 voigt-phd ), possibly because of a lower event background compared to 1996, but also due to a different treatment of close hits in the SiDC’s.
4.2.4 -dependent efficiency
With track density increasing towards small polar angles, the track reconstruction efficiency drops by more than a factor of three over the acceptance, as shown in the upper panel of Fig. 25. Since we will deal only with pair yields integrated over the acceptance, one is inclined to disregard this effect.
A -dependent efficiency, however, combined with the limited acceptance, affects pairs of different opening-angle characteristics in different ways; and we have seen already in Fig. 5 that -Dalitz pairs and pairs from decays have indeed very different behaviour.
The acceptance condition affects wide open pairs considerably. For the given example of decays with typical 400 mrad, only pairs with both electrons at large are accepted and reconstructed with above-average efficiency. The rise in pair efficiency for very large opening angles is seen in the lower panel of Fig. 25. The shallow minimum at 250 mrad is typical for the majority of the open pairs in our sample. We see also that the efficiency changes only by very little towards lower . The flat region even includes our sample of Dalitz pairs; owed to the standard cut 35 mrad, their most-probable polar angle is as large as 190 mrad. So, compared to the ’majority of open pairs’ cited above, the reconstruction efficiency of the sample of Dalitz pairs is almost undegraded. This is very satisfactory for the ’Dalitz method’ described above.
Yet, in order to protect characteristic features in spectra of pairs with opening angles comparable to the acceptance of the spectrometer, the efficiency correction should involve the distributions of the contributing tracks. We describe this method in the following.

The dependence in track efficiency was taken care of in an approximate way under the boundary condition to leave the measured efficiency for Dalitz pairs shown in Fig. 24 unchanged. The pair efficiency is factorised into track efficiencies which are modified according to
| (28) |
The function incorporates the measured dependence of the track efficiency shown in Fig. 25, upper part.
The procedure is to increment in an event of multiplicity for each pair candidate a weight into the like-sign or unlike-sign spectrum which is
| (29) |
The function is suitably normalized to assure that the Dalitz sample is unchanged.
The described event-by-event correction was not performed in the ’95 data analyses while the ’96-analysis of Ref. hering-phd was corrected for a truly two-dimensional efficiency.
4.3 Pair acceptance
The acceptance of the CERES spectrometer for electron pairs has been evaluated by MC simulations assuming uniform input distributions in mass , pair transverse
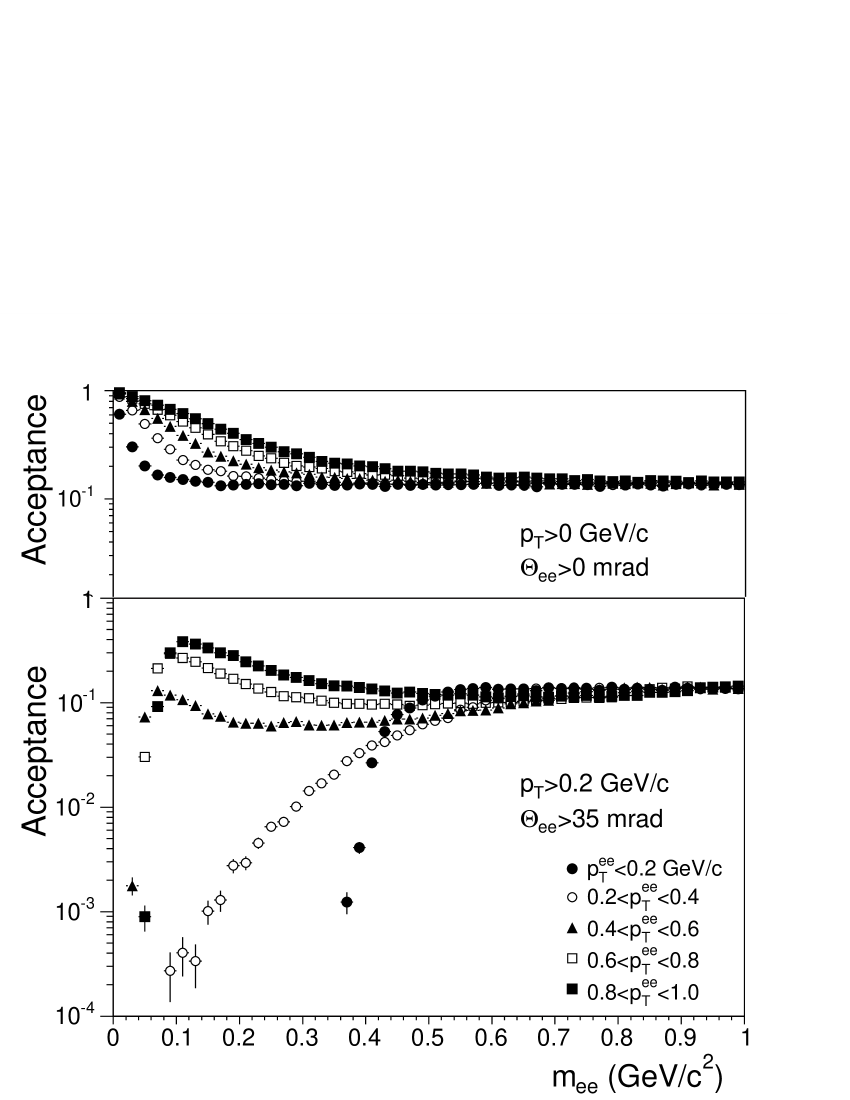
momentum , and rapidity . How the CERES acceptance depends on and is shown in Fig. 26 for the standard rapidity range 2.12.65; the normalisation is done cutting also the virtual photon distribution to this range in the input. We have applied here the standard analysis cuts 200 MeV/ and 35 mrad. The results without cuts are shown for comparison. For masses below 100 MeV/, the acceptance without cuts approaches one, while the angular cut causes a steep reduction. Higher up in mass, the single-electron cut reduces the acceptance at low pair , acting like a cut, while at 400 MeV/, the acceptance becomes more uniform and even, within a factor of two, independent of mass, due to some ‘equalising’ effect of the opening-angle cut. Still higher up, for 500 MeV/, the acceptance is essentially uniform both in mass and in .
An acceptance correction for pairs of ‘new physics’ sources is problematic in principle, since the decay dynamics is not precisely known and may depend on additional parameters, such as helicity angle. In comparison of theories to CERES data, proper accounts of the pair acceptance and other cuts are usually taken by the authors themselves who have the necessary insight into the dynamics of the modelled sources to do so. We therefore correct data only for reconstruction efficiency, not for pair acceptance.
4.4 Optimising rejection of combinatorial background
To foster confidence in the data analysis and to improve on data quality it was essential to understand the combinatorial background in every detail. We have presented in the preceding section how the measured numbers of background and signal pairs evolve with the rejection steps applied. Here, we use the tool of full MC simulation to arrive at a quantitative understanding of the background sources. It goes without saying that the elaborate simulation of background rejection supplied a very effective handle to fine-tune rejection cuts.
Figure 27 plots the number of electron tracks from various physics sources which survive a given rejection step in the MC simulation. The decrease is

either due to rejection of single tracks that have unwanted properties like low , bad matching or suspicious environment, or due to removal of recognised conversion or Dalitz pairs which are still intact and fulfil all conditions.
The experimental points are numbers of background tracks from the post-production steps of the 1996 data analysis. They are derived from the measured total number of background pairs accumulated in 42.2 events, assuming Poissonian track statistics. The agreement between absolute numbers from experiment and simulation is quite reassuring; also the size in relative suppression is in good agreement with the simulation. The residual background remaining after all eight rejection steps is dominated by Dalitz pairs.
5 Hadronic decay sources
The ‘conventional’ sources contributing to the inclusive mass spectra of electron pairs in the mass range below 1.5 GeV/ are free decays of light neutral mesons up to and including the . These contributions have been determined for p-Be and p-Au collisions with considerable precision in an experiment which combined the electron-pair spectrometer of CERES with the photon calorimeter of TAPS neutral-meson-pBe . In addition to the inclusive electron-pair yield, the cross sections and distributions of the mesons have been measured via the electro-magnetic decay modes and , and an exclusive reconstruction of the and -Dalitz decays . These data, supplemented by older measurements from NA27 na27 , allowed us to simulate the electron-pair mass spectra originating from decays of neutral mesons. The result was subject to all experimental cuts and folded with mass resolution. Within error limits it was concluded that the inclusive mass spectra of electron-pairs measured in 450 GeV/c p-Be and p-Au collisions are consistently described by the expected pair ‘cocktail’ of neutral meson decays neutral-meson-pBe .
The hadronic cocktail serves as our reference standard of hadronic sources to expose effects which are specific to nucleus-nucleus collisions, i.e. spectral shapes and yields which cannot be described by a mere superposition of nucleon-nucleon interactions. Supported by evidence from light collision systems becattini96 , particle ratios were originally assumed constant from p-p to heavy systems drees , and particle yields were scaled with charge multiplicity. This cocktail was instrumental in gauging the low-mass excess in 200 GeV/ S-Au collisions prl1995 and in 158 GeV/n Pb-Au collisions from the first (1995) data set ravinovich-qm97 ; plb422 .
The hadronic cocktail is calculated with the Monte Carlo event generator GENESIS genesis-old described in considerable detail elsewhere neutral-meson-pBe . It has been improved since then but the changes with respect to previous CERES analyses of Refs. ravinovich-qm97 ; plb422 ; lenkeit-qm99 ; lenkeit-paris are subtle. These publications are superseded by the present paper.
We sketch here only the main points. Mesons are produced with cross sections scaled up from p-p or p-A, taking into account the modified and rapidity distributions. Open charm contributions have been neglected on the basis of reliable estimates open-charm98 . Mesons are then allowed to decay with known branching ratios. Decay kinematics are simulated for the Dalitz decays of the pseudo-scalar mesons
| decay | branching- | [MeV] | Form factor | |
|---|---|---|---|---|
| ratio | ||||
| 1. | ( | 100 / 230 | pole approximation | |
| =5.5 GeV-2 | ||||
| 0.085 | ( | 238 | pole approximation | |
| =(1.9 0.4) GeV-2 | ||||
| 0.094 | ( | 263 | ||
| 0.069 | ( | 265 | ||
| ( | Breit-Wigner | |||
| =0.65, = 0.05 GeV | ||||
| 0.018 | ( | 292 | ||
| 0.0078 | 285 | Breit-Wigner | ||
| =0.76, = 0.01 GeV |
, for the direct decays of the light vector mesons, , and for the Dalitz decay . Electron momenta are Lorentz-transformed into the laboratory system and convoluted with the experimental resolution profile. The simulated events are subject to the same filters concerning acceptance, and opening angle.
Production cross sections of the neutral mesons, their rapidity and transverse-momentum distributions are essential ingredients for simulating the decay contributions to the dilepton spectrum. When data on hadron production from Pb-beam experiments at the SPS (NA44, NA49, NA50, WA98) became available in time for the 1996 data analysis, we used this input from Pb-beam data whenever possible lenkeit-qm99 ; lenkeit-paris ; lenkeit-phd . Information not directly available was derived from the statistical model which describes ratios of integrated hadron yields at chemical freeze-out very well with only two fit parameters, the temperature and the baryon chemical potential; the particular values used are = 170 MeV and 68 MeV chem-eq99 . The collision system is modelled in a state of collective transverse expansion which is based on the observation wessels96 that inverse-slope parameters of transverse momentum spectra, except for pions, systematically increase with mass stachel-paris98 .
Data on distributions of pions have been measured by CERES bielcikova ; ceretto-tsukuba , NA49 appels-np98 , NA44 kaneta-99 , and WA98 aggarwal-98-01 . They are exceptional in that they can not be described by a single exponential. The spectrum is generated with two slopes: at 200 MeV where it is dominated by secondaries, with = 100 MeV, and for the higher part with an inverse slope of = 230 MeV. The inclusive distribution for neutral pions measured by WA98 is extrapolated to small using the charged pion distributions from NA44. At small the spectra are dominated by secondary decays from heavier mesons. The decay is added separately by hand to the distribution.
The rapidity distribution sikler99 of negatively charged hadrons, described as a Gaussian centred at = 2.9 with = 1.5, has been adopted for all mesons. While the widths of the hadron rapidity distributions decrease with particle mass in proton induced collisions, this is not observed in lead-induced collisions hoehne99 .282828Particle ratios taken at mid-rapidity are therefore the same as those from partially or fully integrated yields.
The parameters from Pb-beam data and the statistical model are given in Table 2. Meson production ratios are implemented relative to the number of ’s and include feeding from heavier resonances. Compared to the earlier reference to proton induced collisions neutral-meson-pBe , the production ratios of heavier hadrons are enhanced as, e.g. the / peitzmann98 and the ratio jouan-falco98 ; puehlhofer98 . The meson yields are normalised to the charged-particle density by the ratio
| (30) |
Brackets denote averaging over the CERES acceptance.
The decay branching ratios given in Table 2 are from Ref. pdg2004 . To simulate the Dalitz decays, the Kroll-Wada expression kroll-wada is multiplied by the electro-magnetic transition form factors fitted to the LEPTON-G data lepton-g . The pole approximation is used for the determination of the form factors of the and the Dalitz decays lepton-g . For the and the , the form factors are determined by fitting a Breit-Wigner function
| (31) |
to describe the resonant behaviour according to the vector dominance model. The parameters used are listed in Table 2. The direct decays of the vector-meson were generated following Gunaris and Sakurai gounaris-sakurai .
The 2-body decay of the meson has been re-evaluated frimann-knoll00 for the new GENESIS code genesis-new . We defer details of the revised formula as it is implemented in the 2003 version of the New GENESIS to the appendix. The resulting mass distribution, due to a Boltzmann-type phase space factor and a momentum dependent phase space, both omitted in the previous code, receives a shoulder on the low-mass side and a steeper falloff to higher masses.
All decays where assumed isotropic in the rest frame of the decaying meson except for the Dalitz decays to e+e- which follow a 1 + cos2() distribution, where is measured with respect to the virtual photon direction.
Figure 28 depicts the cocktail based on the Pb-beam data with all corrections. It is the mass spectrum of pairs in the CERES acceptance with standard cuts 35 mrad and 200 MeV/ . The generator output has been folded with the mass resolution function of the 1996 data set, which includes both the momentum resolution as the dominant source of smearing as in eqn. (3.9), as well as the resolution in pair opening angle; the latter is approximately
| (32) |
where 0.6 mrad and 3.0 mrad are the angular track resolutions taking information from all detectors together. The effects of bremsstrahlung emission by electrons traversing the detector material have been included in the simulations, but due to the low material budget in the acceptance of 1 , they are hardly noticeable. The overall mass resolution is about 6 in the region and 7 in the region of the (see sect. 3.3).
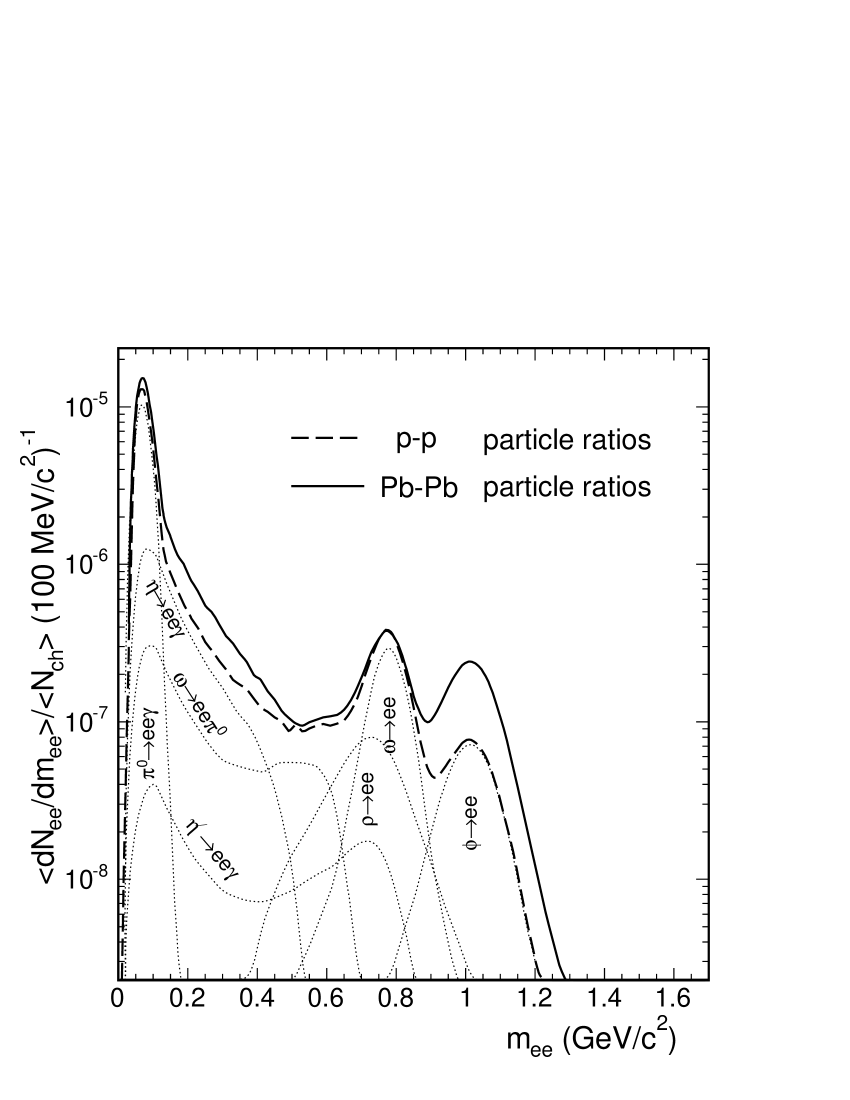
The cocktail for Pb-Au collisions is compared in Fig. 28 to the cocktail of hadronic sources up-scaled from p-p interactions; the latter is also folded with the CERES resolution obtained for the ’96 data analysis.
The systematic errors of the normalised decay cocktail, relevant for the numerical comparison to the experimental pair data in sect. 7, are discussed separately for the mass regions below and above 200 MeV/.
The low-mass region is dominated by the -Dalitz decay, with -Dalitz contributing about 15 . Errors arise from the relative production cross section of the and from the parametrisations of the input rapidity and transverse momentum distributions. Normalising the decay cocktail to the number of charged particles is a very powerful means to keep the error in the ratio of eqn. (4.26) small; it is estimated to be at most 5. The rapidity distribution is uncritical since it is taken directly from pion data; the errors should be less than 3 . The transverse momentum distribution, due to the single-electron cut, is a little more critical. However, quite different assumptions on the shape of the spectrum above the cut, e.g., using from CERES rather than from NA49, lead to differences in yield of only very few percent. This error is therefore also estimated to be below 5. Assuming that the systematic errors are uncorrelated, a total systematic error of 8 is obtained for the low-mass region.
In the high-mass region, the errors are dominated by those of the relative production cross sections of the higher-mass mesons and of the detailed properties of the electro-magnetic decays. Since most of the particle yields relevant for the cocktail have not directly been measured, or like the , suffer from experimental controversy jouan-falco98 ; puehlhofer98 , the statistical model predictions have been used instead, and it is therefore their uncertainties which enter. Judging the average fit quality to measured particle ratios chem-eq99 , we estimate these errors to be 20. The uncertainties in the branching ratios and in the transition form factors have been discussed in detail in Ref. neutral-meson-pBe . They contribute 15 for 450 MeV/, 30 in the mass range of 450-750 MeV/, and 6 for 750 MeV/. Taking these supposedly independent sources of uncertainty together, an overall systematic error of 30 is estimated as the weighted average for the high-mass region.
The integral number of electron pairs per charged particle in the CERES acceptance expected from hadronic sources under standard cut conditions 200 MeV/ and 35 mrad is
| (35) |
where we have quoted the systematic errors of 8 and 30 for the two mass regions, respectively.
6 Results
6.1 Samples of reconstructed pairs
For an overview, the pair samples reconstructed from the two data sets of 158 GeV/n Pb-Au collisions taken by the CERES Collaboration in 1995 and 1996 are listed in Table 3. All analyses apply standard cuts on track and and pair opening angle .
The table lists the pair signal (S) obtained by subtracting the combinatorial background (B) from the measured numbers of unlike-sign pairs, for the mass ranges below (Dalitz pairs) and above 200 MeV/ (open pairs). In this Table, pair yields are not corrected for reconstruction efficiency (other than in the following figures). In analysis no. 5, event mixing was employed to obtain combinatorial background of unlike-sign pairs. Quoted errors are absolute statistical errors in the respective sample numbers amounting to . The pair reconstruction efficiencies are given in the last column.
| Work | Events | Dalitz | S/B | Open | S/B | Open/Dalitz |
| Pairs | Pairs | Pair Efficiency | ||||
| Year of run | ||||||
| 1. 1995a | 8.55 | 103855 | 1.05 | 648105 | 1/8 | 10.9/11.0 |
| Refs. 49,54 | 220 | |||||
| 2. 1995b | 8.55 | 104453 | 1.0 | 468104 | 1/11 | 8.0/10.9 |
| Ref. 55 | 220 | |||||
| 3. 1996a | 42.0 | 5631129 | 1.03 | 2018237 | 1/13.4 | 8.8/11.9 |
| Refs. 50,51,56 | 250 | |||||
| 4. 1996b | 42.0 | 5013128 | 0.88 | 1722236 | 1/15.7 | 9.5/10.8 |
| Ref. 55 | 250 | |||||
| 5. 1996c | 41 | 3537103 | 1.04 | 1305194 | 1/13.9 | 4.3/ 5.6 |
| Ref. 57 | 250 |
We note a considerable spread among the results of different analysis efforts. This originates from the different values of the rejection cuts used along the various analysis chains. However, normalised pair yields, i.e. numbers of pairs per event, per charged particle, and corrected for pair efficiency, as will be shown below, are very stable: the relative spread in the number of Dalitz pairs turns out to be less than 15.
6.2 Inclusive mass spectra
Figure 29 shows the mass spectrum of Ref. plb422 ; voigt-phd from 1995 together with that of Ref. lenkeit-qm99 ; lenkeit-paris ; lenkeit-phd from the 1996 data set. The trigger centralities correspond to the most central 33 and 26 of the inelastic cross section for 1995 and 1996, respectively.
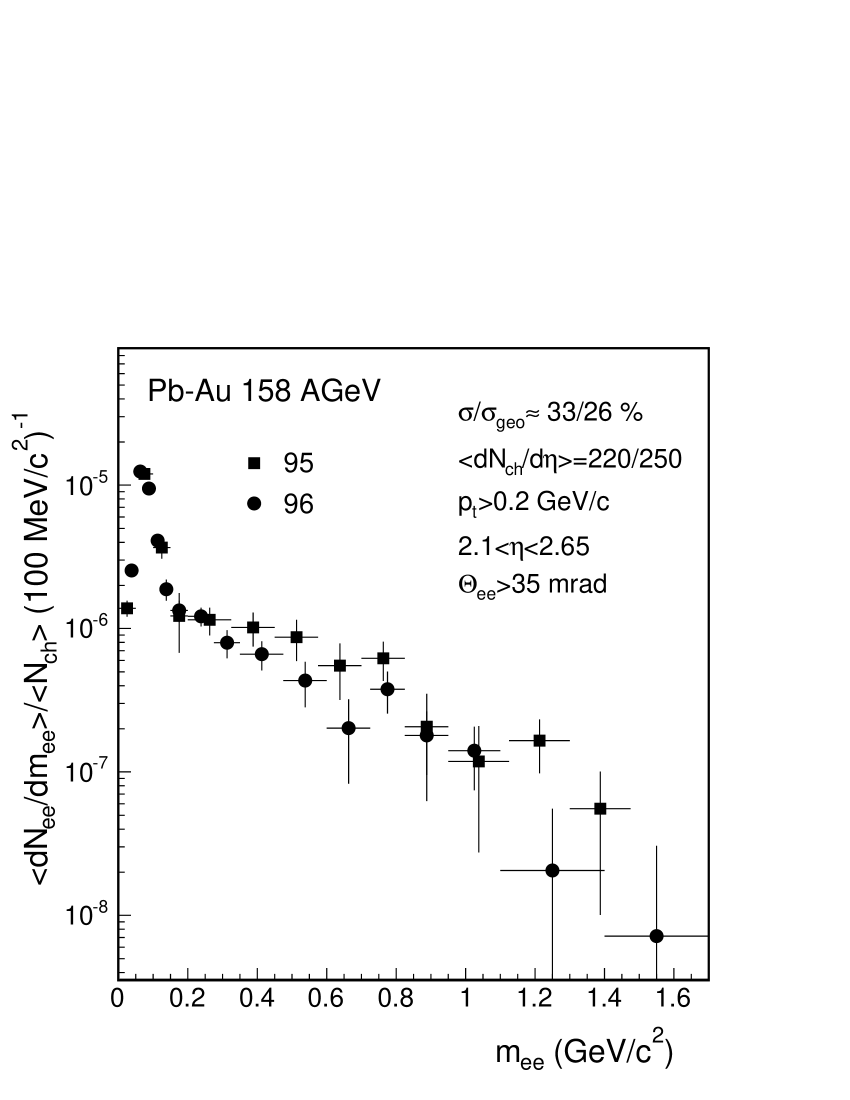
The signal is obtained by subtracting the smoothed like-sign pair background from the spectrum of unlike-sign pairs. The differential pair yield per event is normalised to the mean number of charged particles in the acceptance. The brackets indicate particle yields per event measured within the CERES acceptance. Reconstruction efficiency has been corrected event-by-event by weighting pairs with the value of the inverse pair efficiency at the particular centrality. Shown are the bin-to-bin statistical errors of eqn. (3.18). To include the normalization errors discussed in sect. 3.7, as it may be relevant when individual data points are compared to other data, as in this figure, or to theoretical-model predictions, the errors should be multiplied by 1.4. Note, however, that these larger errors are no longer statistically independent.
It is apparent that the ’95 data points lie systematically higher than the ’96 data points. Apart from the small difference in mean trigger centrality there is no relevant change in setup. The ’95 analysis voigt-phd ; ravinovich-qm97 ; plb422 followed the strategy to optimise the quantity . But while the signal efficiency was determined by Monte-Carlo, the background was taken as the measured like-sign sample; this strategy was discarded when the full MC simulation became available for the ’96 analysis. Although we could find absolutely no indication that statistical fluctuations in might have steered the analysis towards a ‘better’ final sample, such possibility cannot be strictly excluded.
The re-analysis of the ’95 data socol-phd resulted in a mass spectrum closer in absolute yield and shape to the ’96 mass spectrum shown in Fig. 29. In this analysis, any involuntary bias was avoided by sampling the distributions in a random automatic variation of all cut settings simultaneously, and then choosing the centres of gravity. However, seeing no direct evidence for a biased tuning of cuts, we have chosen to keep the original ’95 analysis to expose our actual systematic uncertainties. We return to this issue below.
6.3 Centrality dependence

The efficiency-corrected yield of Dalitz pairs is a solid reference for linear dependence. We have a first look at the centrality dependence of the open pair yield by comparing in Fig. 30 the centres of gravity of three distributions: that of triggered events without any further condition, and two others taken from events which contain a Dalitz or an open pair candidate, respectively. Because of the large open-pair background, the signal is obtained by subtracting the distribution of like-sign-pair events from that of unlike-sign-pair events. The -dependent pair detection efficiency has been corrected for using the curve of Fig. 24.
We see from Fig. 30 that the centres of gravity of Dalitz and open-pair samples are shifted progressively upward; the mean multiplicities are 285 and 310, respectively, compared to = 250 of the trigger distribution. The averages of the trigger distribution calculated for events depending linearly or quadratically on are 287 and 315, respectively. We conclude that the increase of open-pair production is better described by a quadratic dependence on , than by a linear dependence. We will have a closer look at the differential centrality dependence in sect. 7 but note that the current finding bears no reference to the hadronic cocktail.
6.4 Invariant transverse-momentum spectra
Considerable physics potential resides in the spectra of invariant transverse pair momentum, , as displayed in Fig. 31 for the two data samples and three mass bins.
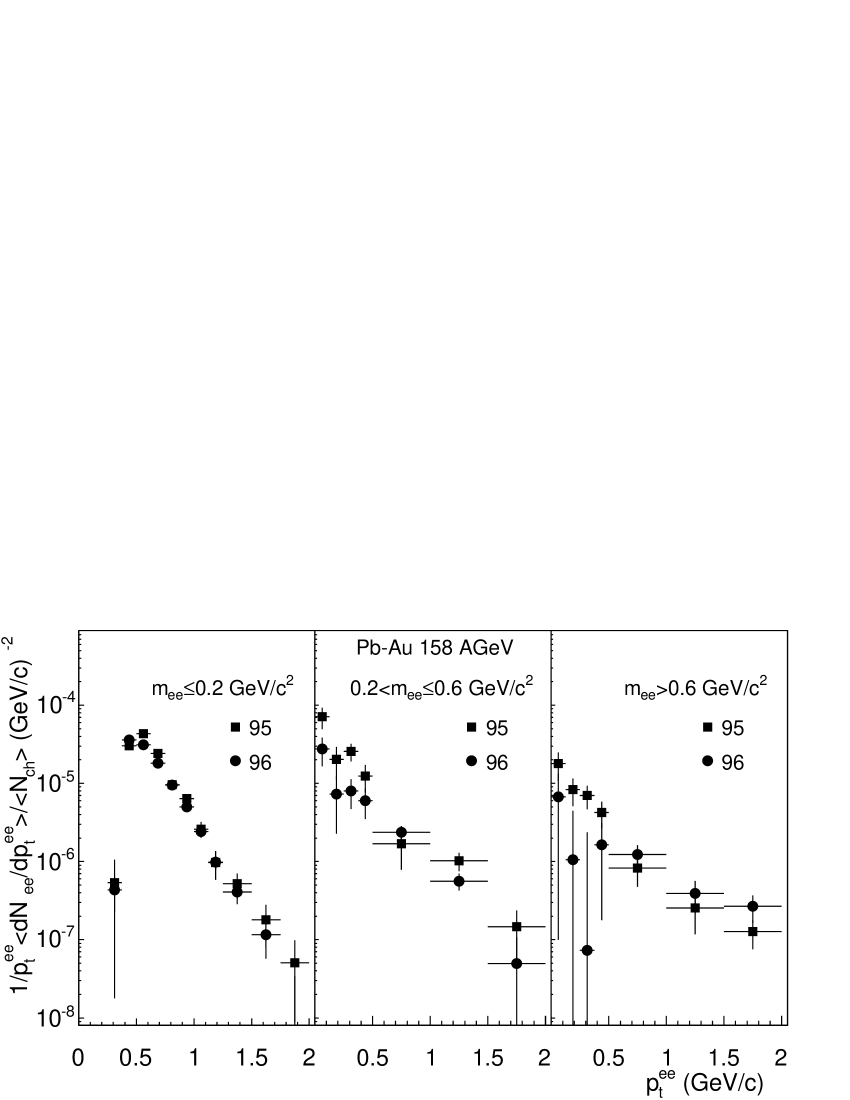
The spectra are normalised and corrected for reconstruction efficiency.
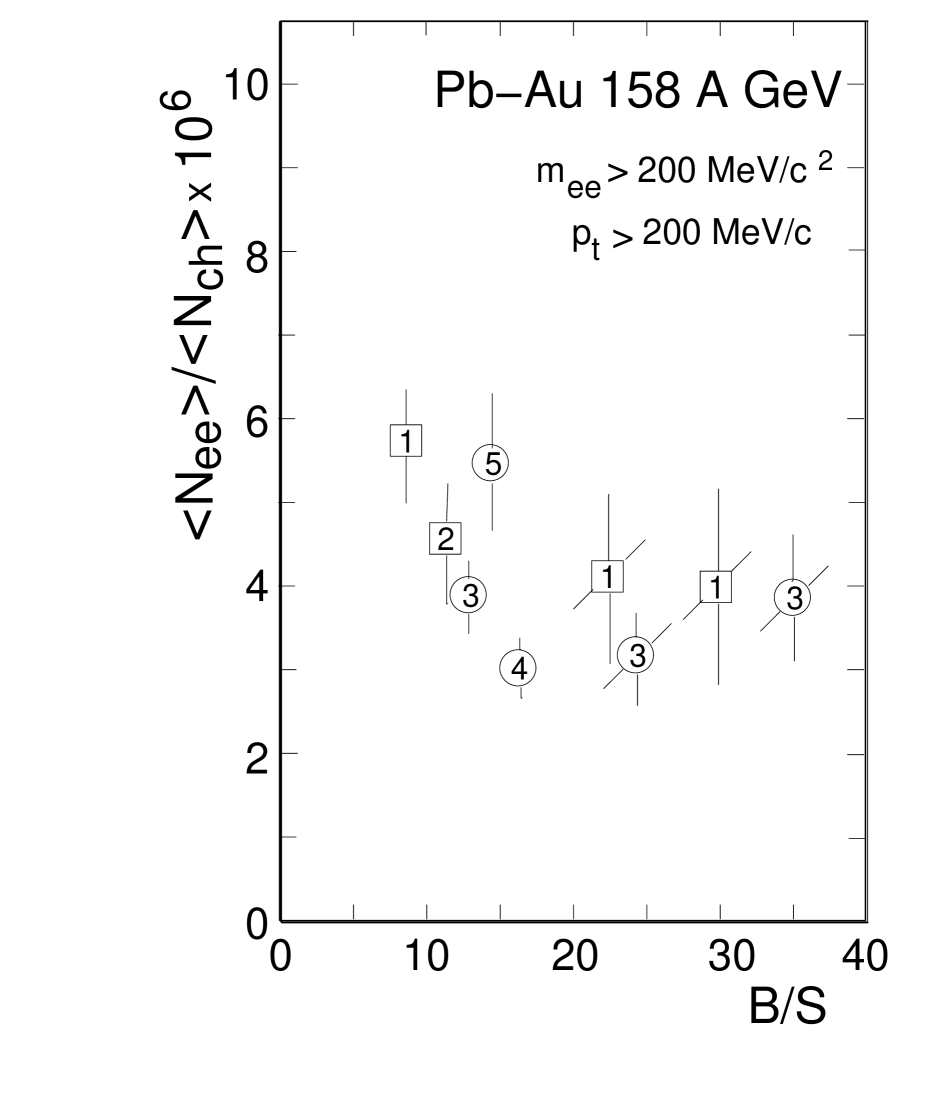
In the Dalitz region, at low the spectrum is void due to the analysis cut; both samples agree very well. Data points scatter considerably for the two other mass bins. The full physics relevance of these spectra emerges only in comparison to the expectations for hadronic sources.
6.5 Stability of results
The optimisation of quality and rejection cuts was done with no feedback from the signal itself not to exploit statistical fluctuations likely in a sample that small. Still, at a signal-to-background level of order 1/10 one is concerned
| Source of systematic error | Comment | Relat. error |
| on | ||
| I. | ||
| MC efficiency correction | ||
| SiDC’s and Pad Chamber | 3.0 per hit on track | 7.3 |
| RICH’s | 5.0 per ring on track | 10.0 |
| Sum detector efficiencies | 12.4 | |
| II. | ||
| Efficiency of analysis cuts | ||
| 11 matching cuts | 1 per cut on track | 4.7 |
| 2 quality cuts | 2 per cut on track | 4.0 |
| 7 rejection cuts | 1 per cut on track | 3.7 |
| Sum analysis cuts | 7.2 | |
| III. | ||
| Triggered mean | comparison to other | 10.0 |
| SPS experiments | ||
| No of events analysed | 3.0 | |
| Total | 17.7 |
how reliable and stable a signal can be that results from subtracting two almost equal large numbers. Even by careful inspection of raw mass spectra by shape, or by magnitude, it would be quite hard to distinguish above 200 MeV/ the signal from background.
Because of cuts and kinematics, it so happens that the combinatorial background spectrum peaks around = 400 MeV/ and is surprisingly similar in shape to the low-mass enhancement.
This raises the question, whether combinatorial background has been insufficiently subtracted. Aside from careful studies of analysis cuts, rejection cuts, the determination of the reconstruction efficiency as a function of centrality, we like to address this question in a quantitative way. A most likely cause leading to wrong subtraction of background is an undetected asymmetry in reconstruction efficiencies, i.e. for like-sign as compared to unlike-sign pairs. It is shown in Appendix C that a 5 asymmetry is required to fake an apparent enhancement factor of three over the hadronic sources, assuming the S/B= 1/13 situation of the ’96 analysis. However, this asymmetry was measured to be less than 1, with confidence limit of 90 lenkeit-phd , as reported in sect. 3.6.
If the low-mass enhancement is faked by leakage of some amount of combinatorial background into the spectrum of signal pairs, the enhancement should increase with the amount added. Figure 32, summarising all CERES pair analyses for 158 GeV/n Pb-Au, does not show that. Rather, we see a pair signal which is, in view of the errors, surprisingly stable despite very large variations in background level.
6.6 Systematic errors
Estimates of systematic errors in the mass-integrated, normalised yield of ‘Dalitz’ pairs292929Note that the use of calligraphic for normalised pair yields is restricted to this section.,
| (36) |
is given in Table 4. The definition of the ‘Dalitz’ sample includes the opening angle cut of 35 mrad and the cut at 200 MeV/. The largest contributions of about 10 each arise from detector efficiencies and the triggered centrality , while the uncertainties due to matching and rejection cuts account for about 7. The resulting total of 18303030If errors from both tracks would be correlated, they would add to a total of 24 instead. is larger than the rms deviation of Dalitz pair yields from all our analyses which amounts to 12.
The normalised yields of signal or open pairs
| (37) |
plotted in Fig. 32 display a relative spread of 24, twice that of the Dalitz sample and now well above the systematic Dalitz-sample error. We presume that the larger systematic uncertainties in open pair yields are caused by the large combinatorial background. We take the relative sample error of 24 in number of normalised open pairs as a reliable measure of the magnitude of systematic uncertainties, arguing that they were obtained in rather independent efforts and by using diverse strategies.
7 Final Results and Comparison to Hadronic Sources
7.1 Inclusive mass spectra
The invariant mass spectrum of pairs produced in 158 GeV/n Pb-Au collisions as obtained from a weighted average of the individual data sets, henceforth called ‘unified mass spectrum’, is shown in Fig. 33. The squares of the inverse relative statistical errors have been used as weights. Plotted is the differential yield per event corrected for pair efficiency and normalised to the number of charged particles in the acceptance, , which corresponds to the rapidity density and the most central 28 of the reaction cross section.
0.48!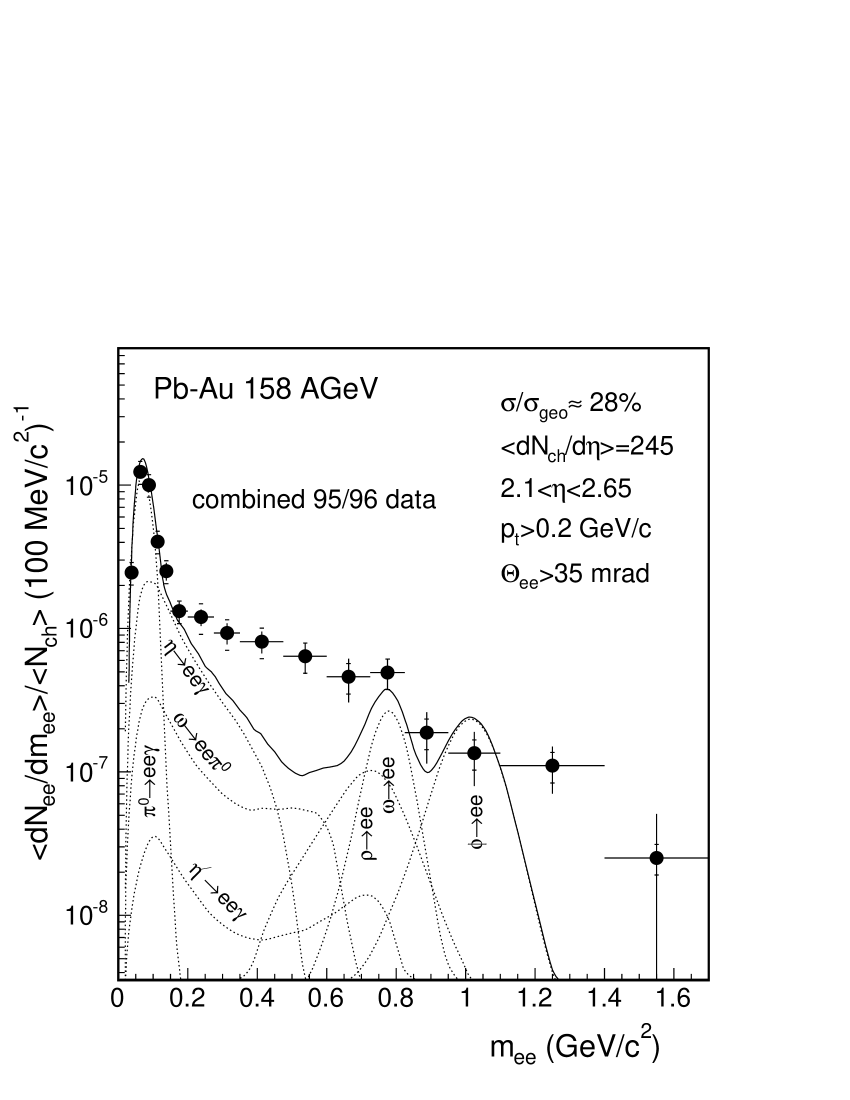
The mass spectrum is compared to the expectation of hadron decays modelled with the updated GENESIS code. The resonance structure of the light vector mesons is hardly visible in the measured spectrum, and within statistical errors, the data points are compatible with a smooth curve. Note that the resonances were clearly visible in the p-Be and p-Au invariant mass spectra(Fig. 1) despite a comparatively poor resolution of 9 at . Note also that the resonance seems to become visible above the continuum in the mass spectrum selected for 500 MeV/ of Fig. 37, to be discussed below.
In the region, the expected mass resolution of 7 being potentially sufficient, statistics hampers further conclusions. We nevertheless quote the ratio of the observed yield (in the mass region 0.95 1.1 GeV/) relative to the cocktail which is dominated by the statistical-model result for the in this region. We obtain a value of 0.68 0.28. With one standard deviation below unity, the statistical accuracy is insufficient to settle the pending controversy on the jouan-falco98 ; puehlhofer98 .
7.2 Enhancement factors
All CERES results for Pb-Au collisions show pair yields in the -Dalitz region which are in good agreement with predictions from known hadron decays. For masses above 200 MeV/, however, the data overshoot the expectation from hadron decays significantly. The largest enhancement over the hadronic cocktail is in the mass range between 400 and 600 MeV/ where it reaches a magnitude of six.
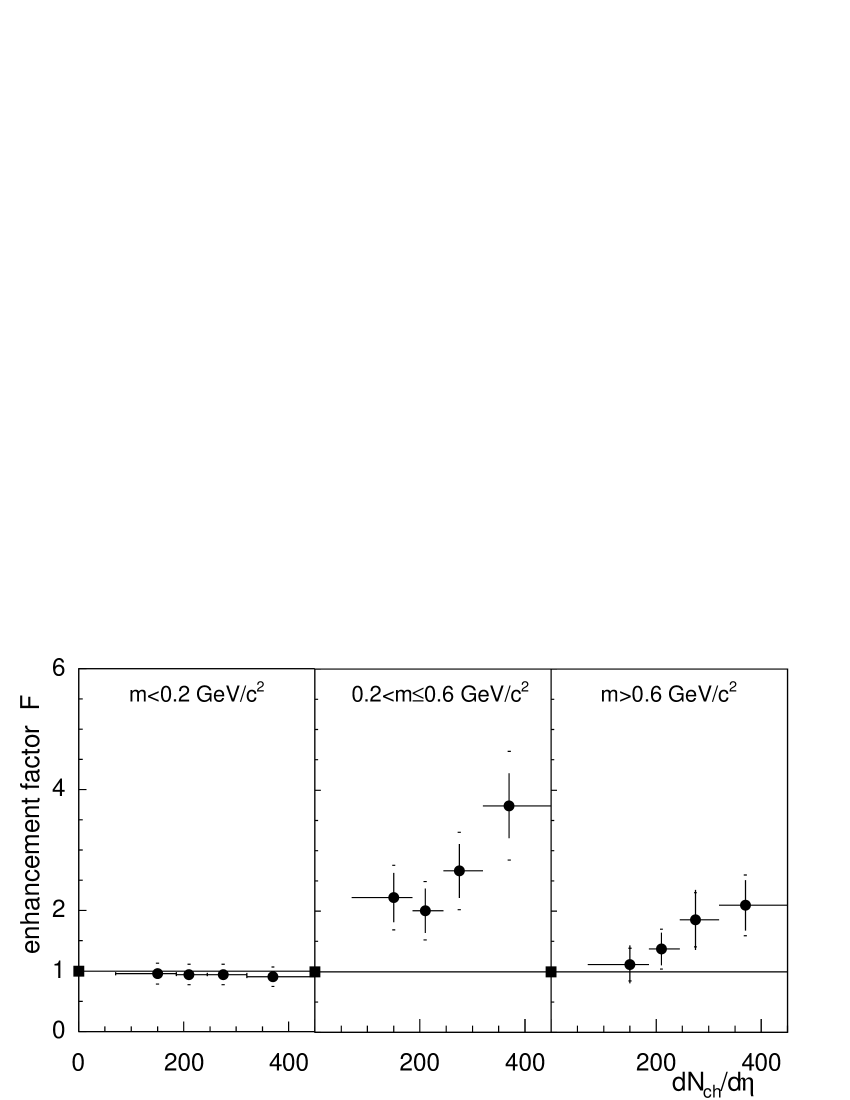
Integrating the normalised yields up to 200 MeV/, for the fraction dominated by -Dalitz pairs (A), and from 200 MeV/ upward for open pairs (B), we obtain
| (40) |
We have quoted the statistical and the systematic errors of 18 and 24, respectively.
The ratios of the measured data to the integrated yields of the decay cocktail (given by eqn. (5.33)) for the two mass regions are
| (43) |
where our estimate of the systematic error in the decay cocktail is given separately. For the low-mass continuum region 200 600 MeV/, the enhancement is even larger,
| (44) |
7.3 Centrality dependence
The enhancement factors are plotted vs charged-particle density for three mass regions in Fig. 34. The enhancement for the mass region 200 600 MeV/ reaches


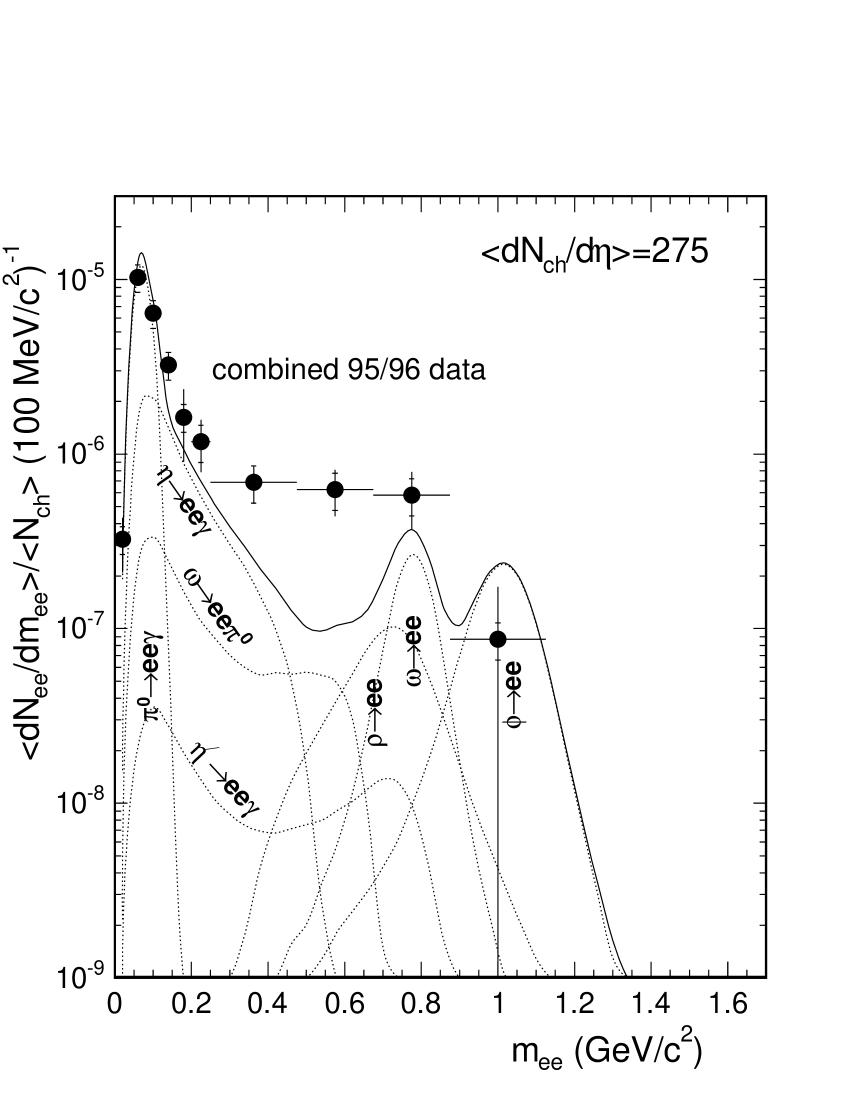
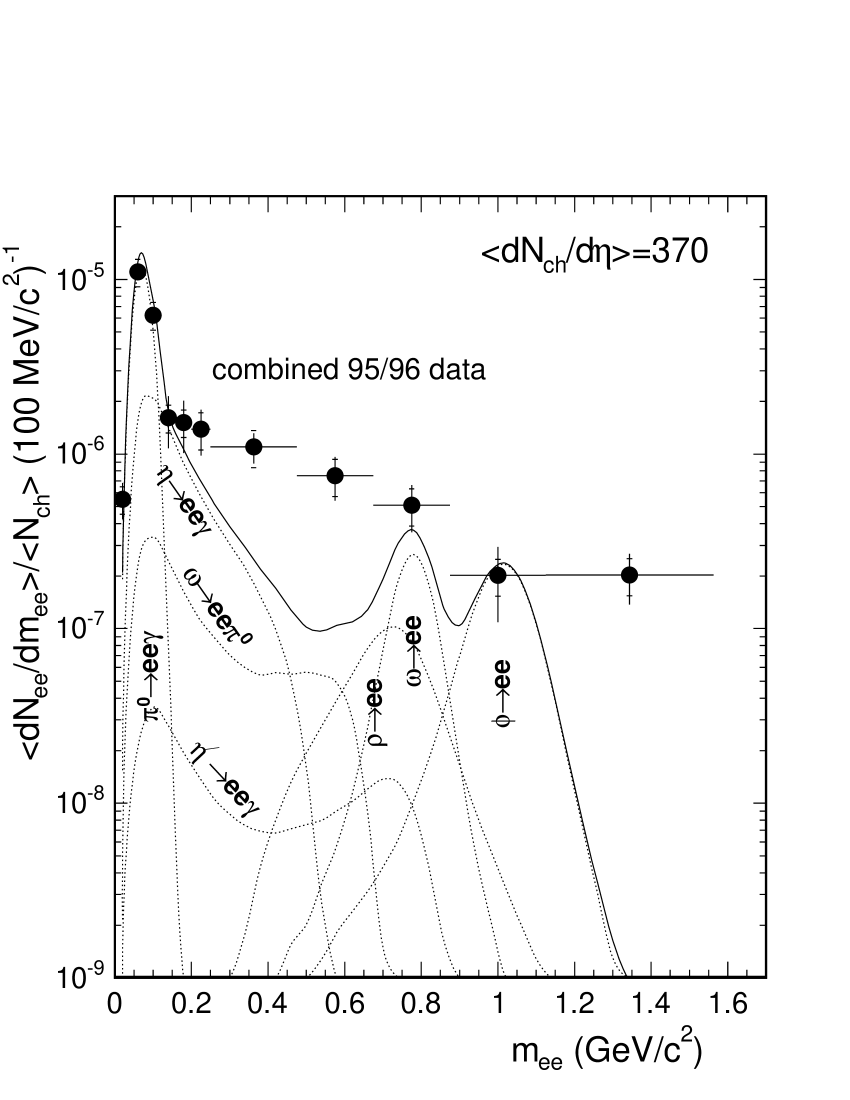
about 4 at the most central collisions, and it is seen to rise about linearly with charged-particle density; a straight-line fit to the five data points gives a slope value deviating from zero by 4 standard deviations. This establishes that the integrated pair yield itself has a stronger-than-linear dependence on charged particle density. (By construction, the cocktail yield per does not depend on ). This enhancement extends to the resonance region, although with reduced significance and smaller values of the enhancement factor. Unfortunately, statistical uncertainties, do not allow to confirm or refute interesting details in the growth of the normalized yield with , like a threshold effect or a saturation behaviour.
To see how the enhancement-typical spectral shape evolves with increasing centrality, unified mass spectra for different ranges in are shown in Fig. 35. The series of spectra clearly demonstrates that the excess over the cocktail for all four spectra occurs between the two-pion threshold and the -resonance position, increasing with centrality. The spectra, being statistically independent samples, corroborate that the largest enhancement is around 500 MeV/, well below the position. With respect to the central issue of in-medium modifications, one should be careful not to establish a direct link to the enhancement factor as we defined it. The reason is that pion annihilation per se, i.e. with a vacuum , proceeding in the hot fireball is already a large, if not the dominant, contribution to the enhancement factor.
7.4 Pair transverse momentum
The Lorentz-invariant transverse momentum distributions of produced electron pairs, observed first in the 1995 data analysis voigt-phd , are shown in Fig. 36 for the combined 95/96 data for the -Dalitz region and for open
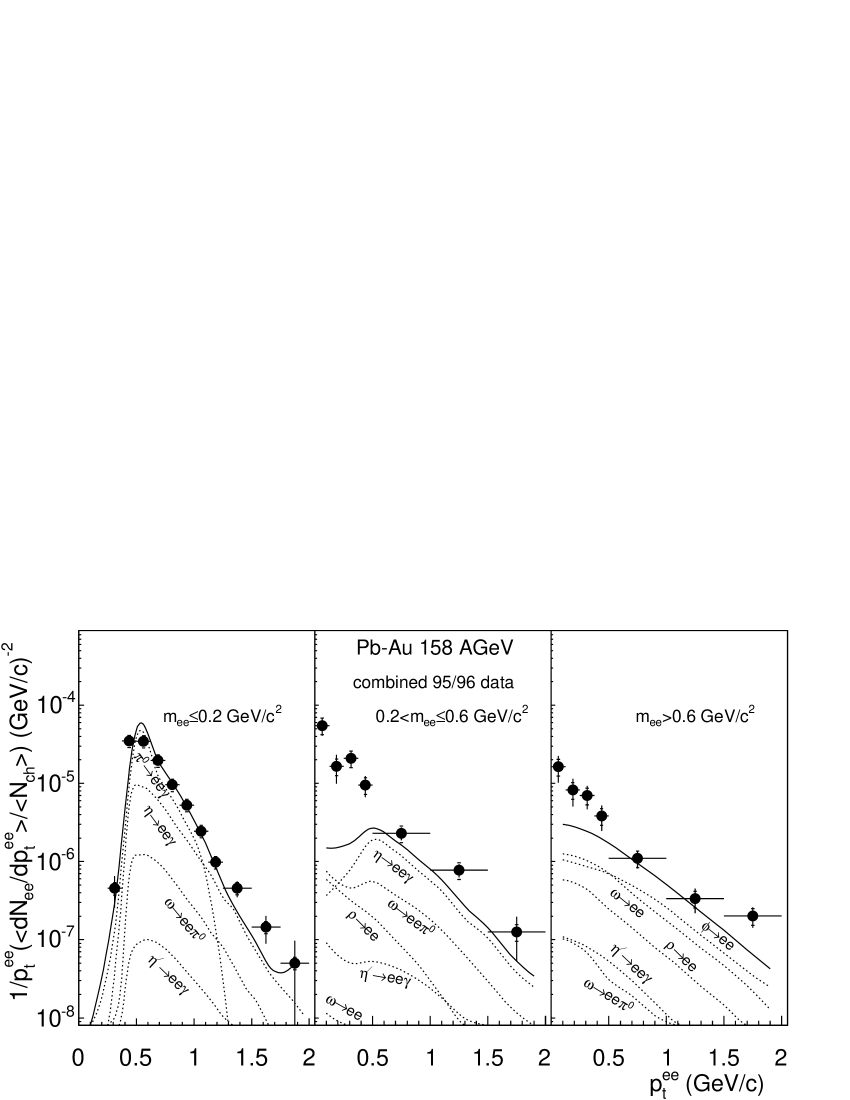
pairs. At low pair , denoted by , the yield is suppressed due to the single-track cut at 200 MeV/c. As to be expected, there is good agreement between data and hadronic cocktail in the Dalitz region. However, the information from the pair distribution in the open-pair mass range is striking: the enhancement grows towards small pair despite the 200 MeV/ condition on single electron tracks. The surplus originates from decays of virtual photons within the fireball that are created favourably at rest. The enhancement above 500 MeV/ pair transverse momentum is considerably reduced. Whether this observation trivially reflects the annihilation kinematics in a thermal pion gas, or contains information about modified hadron properties, will be discussed in sect. 8.
Conversely, the size of the average transverse pair momentum has a remarkable influence on the shape of the inclusive mass spectra. We observe in Fig. 37 that the measured yield dramatically overshoots the hadron decay contributions when low pair momenta are selected. The enhancement in the mass range 500-700 MeV/ reaches locally an order of magnitude.

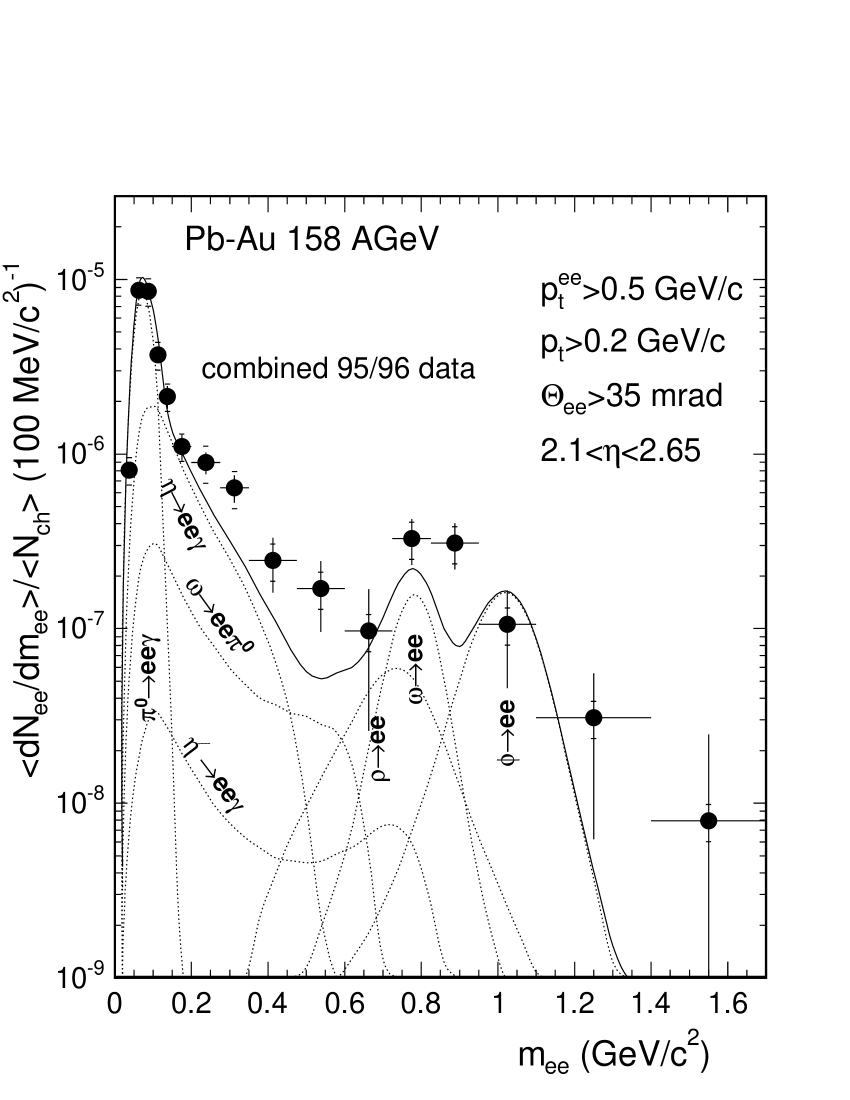
In contrast, for larger transverse pair momenta, the measured yield comes pretty close in shape and magnitude to the cocktail expectations; the resonance region becomes visible as it gains in yield, even on absolute scale, while the previously amplified continuum at 400600 MeV/ is being deflated.
8 Physics discussion
The two CERES runs of 1995 and 1996, combined to the largest statistics sample of 158 GeV/n Pb-Au collisions taken so far, corroborate the enhancement in low-mass electron-pair production over that from hadron decays originally observed in 200 GeV/n S-Au collisions by CERES prl1995 and in S-W collisions by Helios-3 masera1995 . Two additional CERES Pb-Au runs have been performed since then with the new TPC and improved mass resolution, one at the reduced energy of 40 GeV/n adamova-ee03 ; appelshauser02 ; wessels02 the results of which are shortly addressed below, the other at 158 GeV/n marin04 with quantitatively consistent results.
In the region of the -Dalitz decay, 200 MeV/, the yield of the unified sample agrees with the cocktail within the estimated systematic uncertainties. In the mass range upward of 200 MeV/, the normalised pair yield of the unified data analysis significantly exceeds the yield from hadron decays per charged particle, and the enhancement factor is given together with our estimates of statistical and systematic errors in sect. 7.2.
The systematic errors of the decay cocktail were discussed in sect. 4. To address the reliability of the generator in physics terms, the situation has remarkably improved since the practice of scaling yields up from p-p to Pb-Au collisions was abandoned in favour of using particle ratios from statistical model systematics based on Pb-beam data itself. Still, we shortly recall here some particle ratios that have become subject to speculations of being grossly enhanced (i.e. by factors more than two) in nucleus-nucleus compared to p-p reactions, even beyond the statistical-model systematics.
First, the ratio received interest from the fact that the -Dalitz decay is the most important single component of the hadronic cocktail being suspect of enhanced production. It was argued drees-eta , however, that an ratio sufficiently large to explain the electron pair enhancement had not been observed in the photon yield measured by WA80 wa80 .
In the region below the , the gap between cocktail and data might be filled by raising the -Dalitz decay contribution as has been proposed by V. Koch some time ago koch99 . We hold
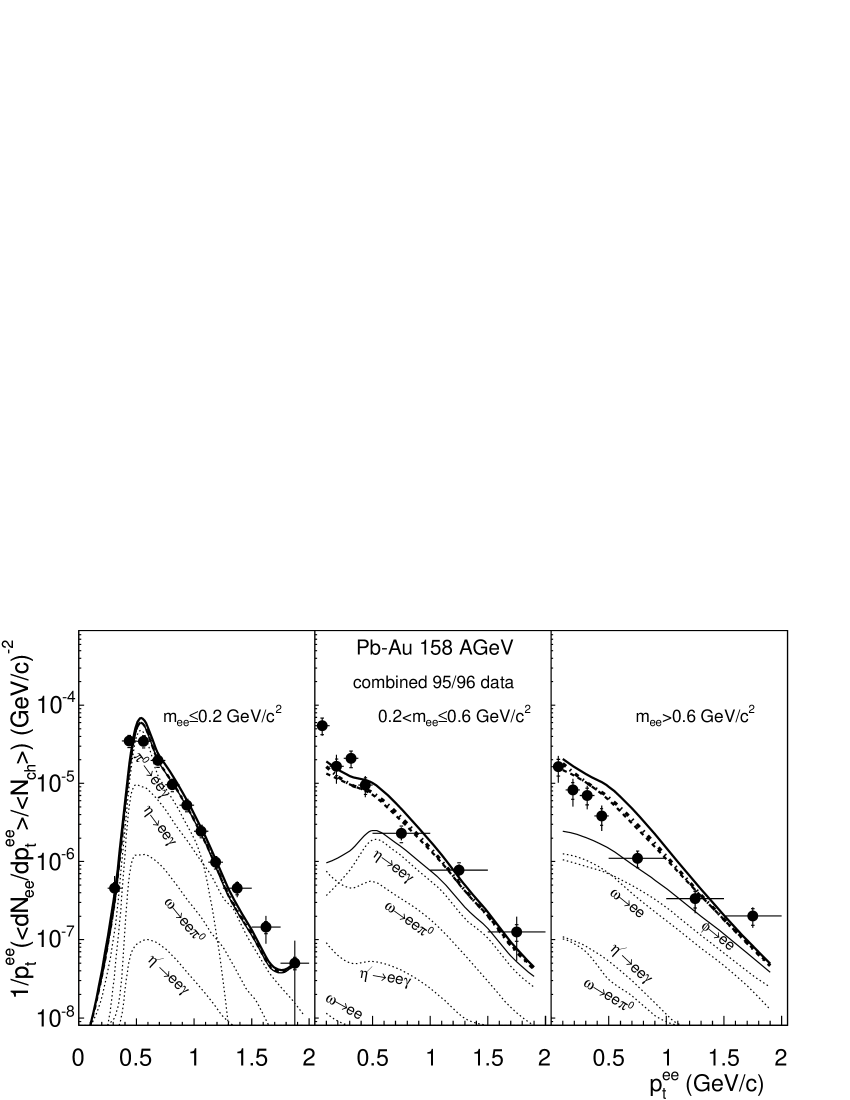
against that there is no indication otherwise for a strongly enhanced production. In addition, a boost in -Dalitz production is limited to an upper margin set by the data of Fig. 33 to the direct decay . Eventually, there is absolutely no reason to believe that open-charm production in nucleus-nucleus collisions should be as enormously enhanced as to explain the low-mass enhancement open-charm98 .
We return to state that the enhanced production of low-mass electron pairs cannot be attributed to decays of produced hadrons. The excess has to originate from processes which are active during the lifetime of the fireball, i.e. between the onset of hadronisation and kinetic freeze-out, if of hadronic origin, and before hadronisation, if created during the plasma phase. Present theoretical studies allocate only a very minor fraction to the partonic part which reflects the supposedly small 4-volumes of deconfined matter at SPS energies.
After having tried to give an overview of theoretical models of dilepton production in the introduction, this discussion will be guided by a few representative theoretical models: the spectral function approach rapp-wambach2000 , the dropping-mass scenario b-r03 , and pion annihilation with a vacuum . In all calculations to be shown, the same fireball model has been used to describe the space-time evolution rapp-special .
Which are the experimental signatures of pion annihilation, the process most widely ascribed to take place in the dense hadronic fireball ? As for any binary process, the annihilation rate is expected to scale with the squared density of the particles annihilating in the fireball (of course, the argument applies as well to annihilation). Unfortunately, the centrality dependence of the dilepton yield is a topic barely addressed by full transport calculations, except cassing-brat1999 .
We take the observed stronger-than-linear scaling of the pair yield (in the mass region of the strongest enhancement) with as strong evidence in support of the two-body annihilation reaction. This deserves some words of justification. An increase in signals a larger pion density only to the extent that it is not compensated by an associated increase in volume, maybe even in lifetime, of the fireball. Therefore, pion annihilation does not necessarily go along with quadratic scaling in . Conversely, however, an observed stronger-than-linear scaling of the pair yield with is sufficient reason to infer a binary reaction at work, i.e. strongly suggesting pion annihilation in hadronic matter, or annihilation in the plasma phase.
As other annihilation processes in a thermal medium, annihilation takes place favourably at small relative momentum of the constituents. This behaviour was indeed encountered already in the pair transverse momentum spectra of Fig 36. From Fig 38 shown here, we learn in addition that pion annihilation with a vacuum is hard to distinguish, by yield and shape of its spectrum, from the medium-modified spectral function and the dropping-mass approaches.
The invariant mass spectra tell more about the physics processes involved. In Fig. 39, the measured invariant mass spectrum is compared to the model calculations. It is evident at first sight that pion annihilation with a vacuum (thick dashed line) does not describe the shape of the spectrum; rather the calculations overshoot the data at the nominal position by about a factor of 2 and under-predict the data in the continuum region by about a factor of 3 – yet, the integral yield comes out about right.
In-medium modifications produce a dramatic change: both the calculations with an in-medium modified spectral function (thick solid line), and with a dropping in-medium mass (thick dashed-dotted line) describe very well the marked increase of the continuum yield around 500 MeV/ as well as the depletion at the vacuum position; the differences among the competing approaches again are rather subtle. We remark that calculations adopting the chiral reduction formalism approach give very similar results, except that the depletion at the vacuum position is absent steele-zahed99 .
Before discussing medium modifications in some detail, let us examine the contributions of and to the cocktail (for 400 MeV/, say), and more speculative, to in-medium pair production. While the with its direct decay and part of its Dalitz decay clearly dominates over the in the cocktail (see Fig. 33), it is the which provides essentially all of the enhancement. One might wonder by which mechanism such drastic change should be accomplished.
Some estimates based on vacuum properties are collected in the appendix. The yield from mesons formed initially by hadronisation is topped by the by its larger electro-magnetic branching ratio. In contrast, by
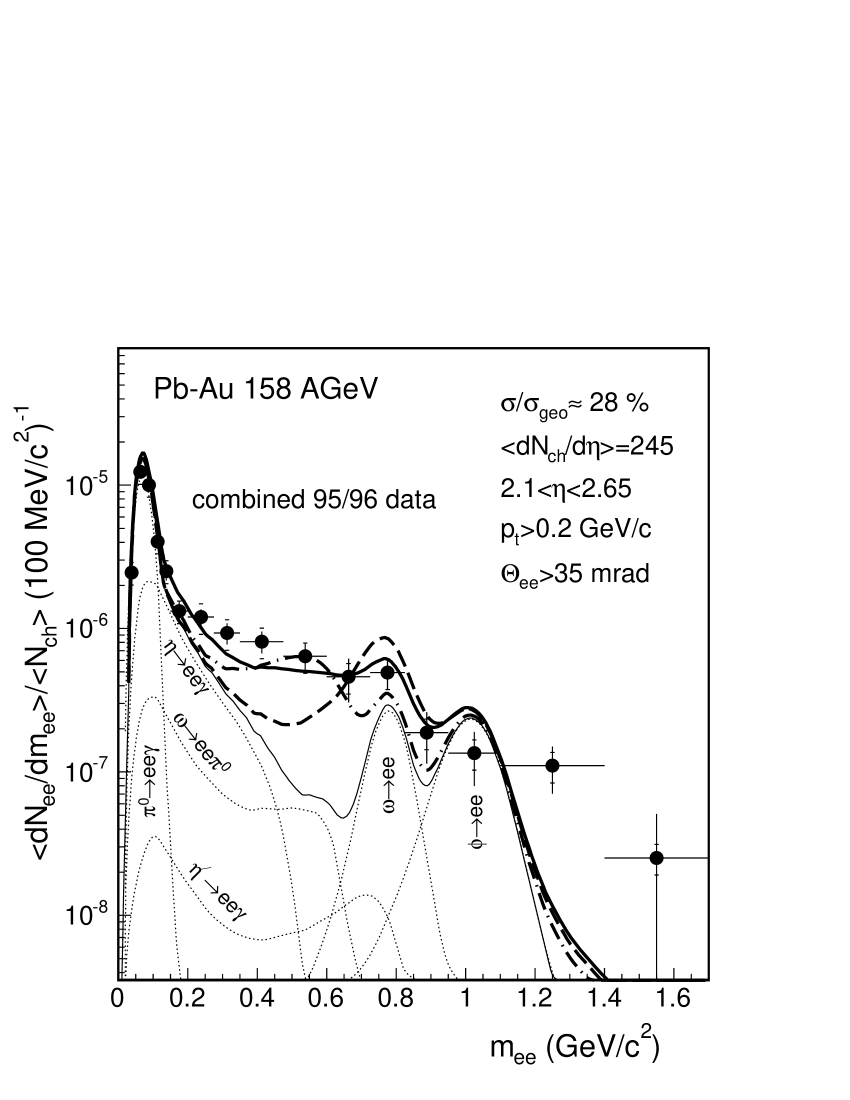
decays from the in-medium meson population, the wins by a large margin due to its much larger width. Altogether, we find that the / ratio of pair yields from secondary, in-medium generated mesons, is by orders of magnitude larger than for initially produced mesons.
This digression illustrates from another point of view what we know already: the exceptional potential of the propagator to dominate electron-pair production quite unrelated to its share in the cocktail – and that there is no way to describe the surplus of electron pairs other than by direct or thermal radiation out of the fireball, i.e. from mesons which are regeneratively produced in annihilation. The chances are feeble to observe such radiation from the , primarily because of its extremely weak coupling to the hadronic medium. Medium modifications, however, might be observed from primary and mesons by the fraction that decays within the lifetime of the fireball.
We return to compare theory to our data. Figure 38 shows that the enhancement at low pair over the cocktail which is seen in the continuum region and to a lesser extent also in the resonance region is a feature present in all model calculations, with minor differences only between a dropping, broadening, or vacuum propagator. We meet here the governing features of pion annihilation, rather than of medium modifications proper.
It is the mass spectrum which uncovers the characteristic of medium modifications as distinct from pion annihilation with vacuum propagator as seen from the comparison of the data with the three modell calculations in Fig. 39. The differences between the two models incorporating medium modifications, however, are rather subtle.
Let us inspect the model calculations of -selected mass spectra compared in Fig. 40 to the data. The drastic impact on the shape of the mass spectrum the selection of low has, is also present in the two model calculations with modified . In these models, the effect maybe somewhat weaker, yet locally the enhancement over the cocktail reaches 10 (see Fig. 37 for the complete cocktail). The vacuum- calculation is only weakly affected by the -selection. For larger , data and model calculations come much closer to the decay cocktail.
The processes causing the in-medium changes of the spectral function, or the dropping mass of the , clearly also favour low pair . Such behaviour would arise most naturally in the dropping-mass scenario from the Boltzmann (or Bose) factor producing the largest gain for small in-medium masses at vanishing 3-momentum (see App. A). For the spectral function approach, the observation had its impact to install the -wave N(1520) -nucleon resonance peters98 ; rapp-wambach2000 as the moving agent in place of the -wave N(1720) resonance which had pioneered the importance of resonances for medium modifications friman-pirner97 ; this change also met requirements by photo absorption data to soften the form factor urban98 .
The effective downward shift of strength to lower masses in the melting- treatment rapp-chanfray-w1997 is largely due to strong meson-baryon coupling, and most approaches agree to its importance for generating in-medium effects rapp-chanfray-w1996 ; klingl-weise1996 ; steele-zahed99 ; a finite nucleon chemical potential is required also for some meson-meson mixing effects to take place in approaching chiral symmetry restoration chan-del-erik98 ; theo01 . Only very small effects of baryon density have been reported for UrQMD transport calculations bleicher00 .313131This conclusion rests on the (false) premise that the data have been satisfactorily described without medium modifications using boosted and Dalitz decays. We have remarked that the CERES run at reduced SPS energy of 40 GeV/n observed an even larger enhancement as in 158 GeV/n collisions adamova-ee03 reaffirming the conclusion rapp-nassau that the increase in baryon density
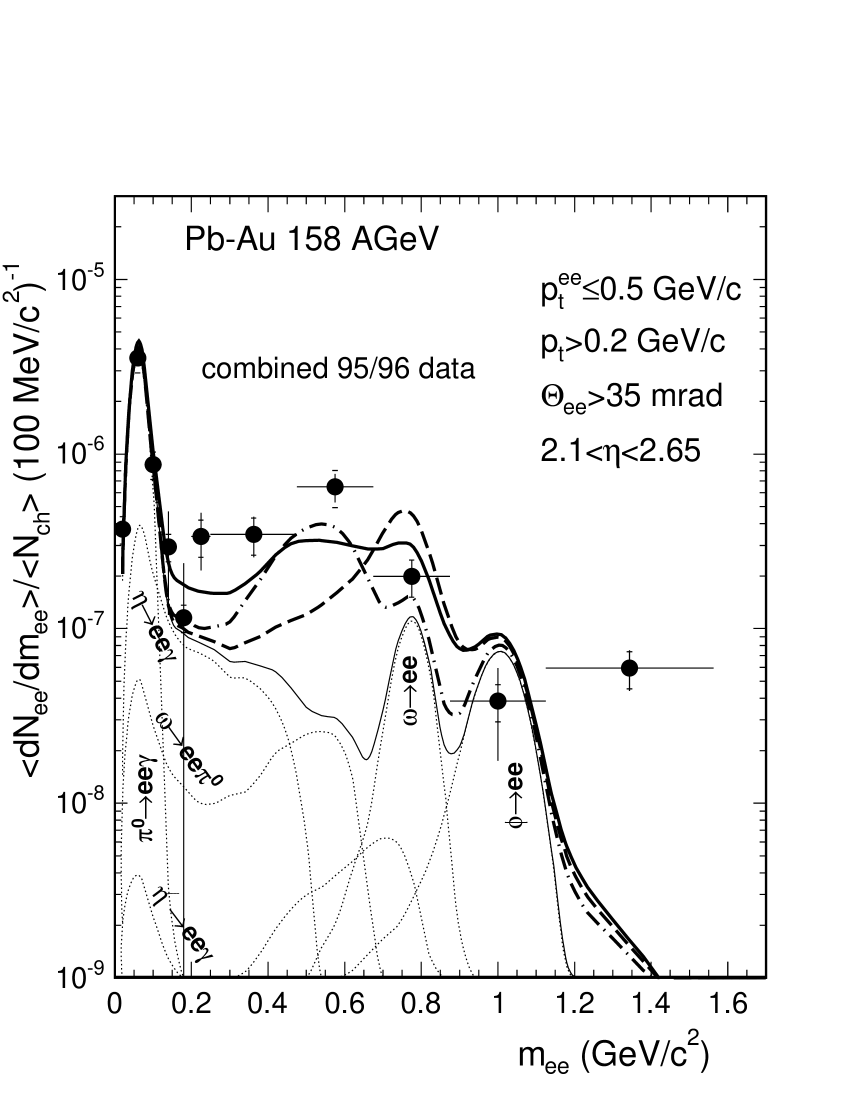
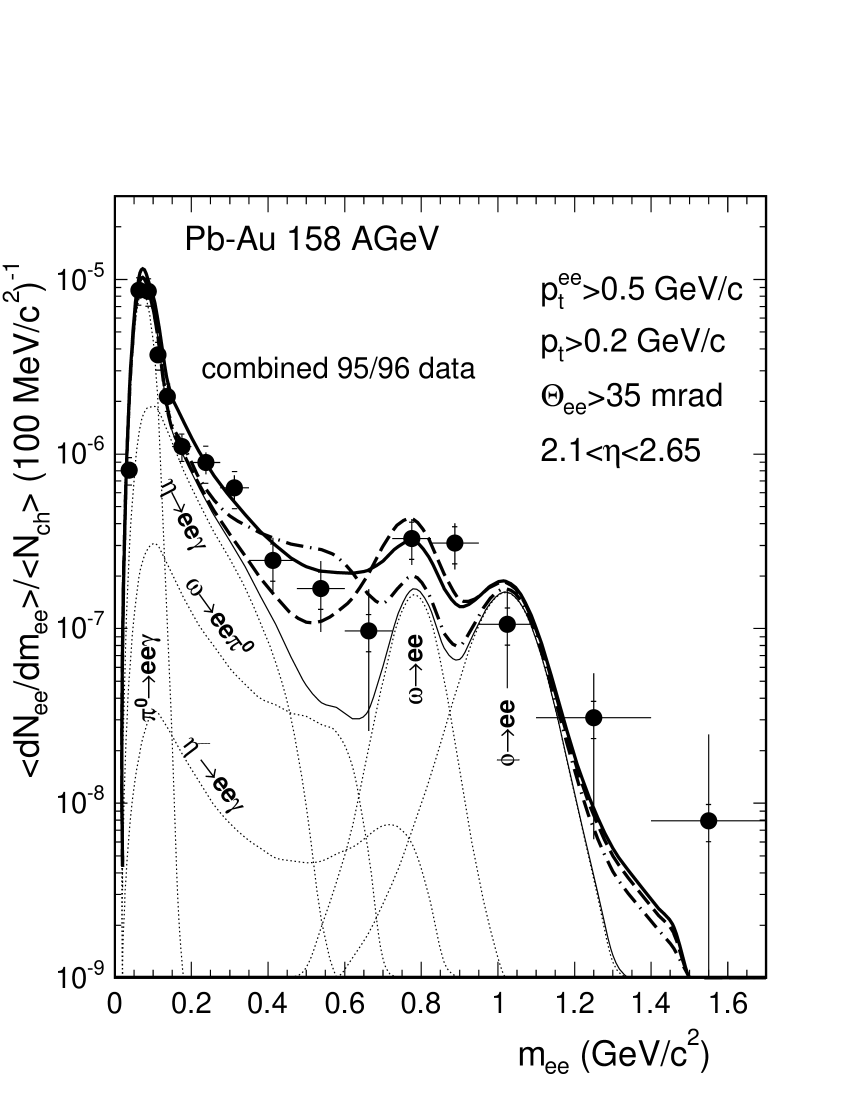
seems to have won over the reduced pion density, or lower temperature. As it is the total baryon density that matters - vector mesons interact symmetrically with baryons and anti-baryons rapp-prc01 - the situation at RHIC energies will not be greatly different from top SPS energy (despite vanishing net baryon density).
In concluding this review of selected theory descriptions of the CERES Pb-Au dilepton data, we like to add that the spectral function approach had also other successes. Within the same framework, the intermediate-mass enhancement observed by NA50 abreu00 has been successfully described as thermal radiation with a 30 share of the quark gluon plasma rapp-shuryak00 ; there was no need to invoke open-charm enhancement. This finding may be seen as the first glimpse of light in the long search for thermal radiation from the quark-gluon plasmashu80 ; mclerran85 .
Still within the same framework, the spectra of
photons in 158 GeV/n Pb-Pb collisions measured by
WA98 aggarwal02 have been reproduced; up to transverse momenta
of about 1.5 GeV/, thermal emission from the expanding hadronic
fireball has been found to dominate with photons mainly of baryonic
origin turbide04 , fully consistent with the closely related
calculations that describe the low-mass dilepton excess observed by
CERES.
9 Conclusion and Outlook
The analysis of the large unified data sample has substantiated the earlier finding of a strong source of continuum electron pairs which contributes to the invariant mass spectrum beyond the decays of produced mesons, most strongly around 500 MeV/. There is ample evidence that we observe dilepton radiation from the interior of the hadronic fireball in which pion annihilation mediated by the propagator plays a major role. The excess yield rises significantly steeper than linearly with charged-particle density, consistent with the binary annihilation process. Another piece of circumstantial evidence for annihilation is delivered by the invariant pair transverse-momentum spectra for the continuum pairs of masses between 200 and 600 MeV/: the dramatic enhancement over the cocktail occurs at very low .
Full calculations with vacuum describe the measured yield about correctly, but fail to account for the characteristic shape of the spectrum of excess dileptons. The propagator is manifestly modified in the medium which is well described by two theories incorporating medium modifications of the , which are, however, very different in concept: while the Brown-Rho scaling hypothesis explicitly refers to restoration of chiral symmetry, the many-body spectral-function approach of Rapp and Wambach, although tracing some of the induced mixings, does not have chiral symmetry restoration as a ruling concept. That it may very well be implicitly included is inferred from the fact that the hadronic dilepton rates extrapolated up to (‘bottom up’) come out very similar to the (‘top down’) extrapolated perturbative QGP rates rw98 . Both theories also give a good description of the mass spectra for selected ranges of pair transverse momentum , where an additional preference of the mechanism generating the medium modifications has shown up.
Three unsolved issues remain. To the present data accuracy, it is not possible to decide between one or the other of the two competing theories so that the role of chiral symmetry restoration for in-medium modifications remains unclear.
Patience seems also advised in localising the source of
medium-modified electron-pair production within the phase diagram. On
one hand, preformation of vector and axial-vector correlator strengths
in the non-perturbative plasma might influence dilepton production
across the
phase boundary lee98 ; jaikumar02 . On the late end of
the time scale, the impact of a growing pion chemical potential for
dilepton production might not be entirely settled yet.
An issue widely overlooked is whether the hadronic fireball is ‘boiling’ long enough to radiate sufficient amounts of dileptons. The time spent by the system between chemical and kinetic freeze-out came under scrutiny on the basis of recent pion interferometric data adamova03-hbt which indicated only a 30 change in volume. If, in addition, chemical freeze-out should occur essentially at the phase boundary between hadronic and quark matter, as suggested by the asymptotic statistical-model result of 170 MeV at higher energies pbm04 , the purely hadronic origin of the low-mass dilepton enhancement might have to be negotiated again.
We look out to further progress that can only be expected from radically better data, with greatly improved statistics and less combinatorial background, but also with improved mass resolution. This will not be easy. But a first step in this direction is the CERES 2000 run with the new Time Projection Chamber; preliminary data have been presented very recently marin04 .
Acknowledgements.
AcknowledgementWe acknowledge the good performance of the CERN PS and SPS accelerators and the excellent support for the central data recording from the IT division. We are grateful to D.A. Pinelli at BNL and O. Runolfsson at CERN for their delicate work in the assembly of motherboards for SIDC’s. We acknowledge the support by Deutsches Bundesministerium für Bildung, Wissenschaft, Forschung und Technologie (BMBF), the U.S. Department of Energy, the Minerva Foundation, the Israeli Science Foundation, and the German Israeli Foundation for Scientific Research and Development.
Appendix A Appendix decay rate
The thermal emission rate of dielectrons from two-body decay of rho mesons has been worked out from Ref. song by B. Friman and J. Knoll frimann-knoll00 as follows:
| (45) |
Here, q is the 3-momentum of the rho meson. The new expression differs from the one used in the previous GENESIS code by the Boltzmann-type phase space factor in the curled parentheses being explicitly momentum dependent. To obtain the final invariant mass distribution, the differential rate has to be integrated over 3-momentum q. The final result used in the 2003 version of New GENESIS genesis-new for comparison to the data reads
| (46) |
Appendix B Estimate of / ratios
We estimate the ratio of electron-pair yields from initially produced mesons and from those produced in a hadronic fireball by using simplified order-of magnitude estimates expressed solely by the (vacuum) particle properties pdg2004 .
Primary mesons are produced during hadronisation. They decay into electron pairs with a fraction given by the electro-magnetic (e.m.) branching ratio . As in p-p collisions neutral-meson-pBe , we assume equal primary populations of and . To the mass range 400 MeV/, the contributes by its direct decay and by about 15 of its Dalitz decay. In this mass range, the ratio of the number of electron pairs emitted by the initial population of ’s and ’s is
| (47) |
The looses in this comparison of e.m. branching ratios due its so much larger total width of = 150 MeV, compared to = 8.4 MeV.
We are mostly interested in mesons that decay into electron pairs within the lifetime of the fireball since the others cannot probe medium modifications. Besides primary produced mesons, an additional source of in-medium decays are from
Secondary mesons. These are continuously produced in the fireball by two-pion annihilation, and most of the time disintegrate back into two pions as expressed by eqn. (1.1). We like to present here a simple estimate of the relative in medium-pair production yields from and which neglects all finer details of the reaction dynamics by assuming that the ratio of rates is given as the ratio of the 2-pion annihilation cross sections, which are estimated from detailed balance, times the ratio of the e.m. decay widths. The two vector mesons differ in an essential manner in strength of coupling to the hadronic medium: while the channel exhausts the large width of the , 1, the (with larger branching into ) is extremely weakly coupled to the channel, 2 . With ,
| (48) |
The estimate demonstrates that by in-medium produced electron pairs, the meson is completely outnumbered by the , unless its in-medium properties should drastically be changed.
Appendix C Instrumental asymmetries as source of enhancement?
Let us assume there is an asymmetry in reconstruction efficiencies for like-sign pairs (L) as compared to unlike-sign pairs (U) which would affect the signal in a most direct way. Asymmetries of this kind might be expected since rings tend to end up in a more or less dense environment in RICH-2 depending on whether they are deflected away from each other, or not.
Writing the pair efficiencies as , the signal is given by
| (49) |
To be definite, let us assume a signal three times the hadronic background, i.e. an enhancement factor of three. The enhancement will be gone if the asymmetry term reduces the signal to one third of . The corresponding asymmetry parameter is
| (50) |
For a signal-to-background ratio 1/13, we find that an asymmetry of 5.1 in efficiencies for like-sign and unlike-sign pairs is sufficient to fake an enhancement factor of 3.
References
- (1)
- (2) See e.g. Proceedings of Quark Matter Conferences, Nucl. Phys. A715 (2003) for QM2002 and J. Phys. G30, S633-S1430 (2004) for QM2004.
- (3) see e.g. F. Karsch and E. Laermann in Quark-Gluon Plasma 3, eds. R.C. Hwa and X.N. Wang, World Scientific, Singapore, 2004, p.1
- (4) J.D. Bjorken, Phys.Rev. D17, 140 (1983).
- (5) J.J. Sakurai, Ann.Phys. 11, 1 (1960).
- (6) G.E. Brown and M. Rho, Phys.Rev.Lett. 66, 2720 (1991).
- (7) R. Rapp and J. Wambach, Adv.Nucl.Phys.25, 1 (2000).
- (8) G.E. Brown and M. Rho, Phys. Repts. 363, 85 (2002).
- (9) R.D. Pisarski, Phys.Lett.110B, 155 (1982).
-
(10)
T. Hatsuda, H. Shiomi, and H. Kuwabara,
Progr.Theor.Phys. 95,1009 (1996). - (11) G.E. Brown and M. Rho, Phys.Rept. 269, 333 (1996).
- (12) F. Wilczek, Lectures given at 9th CRM Summer School: Theoretical Physics at the end of the 20th Century, Banff, Alberta, Canada 1999, hep-ph/0003183
-
(13)
G. Agakichiev et al., CERES Collaboration,
Phys.Rev.Lett. 75, 1272 (1995). -
(14)
P. Wurm, CERES Collaboration,
Nucl. Phys. A590, 103c (1995). -
(15)
M. Masera, HELIOS-3 Collaboration,
Nucl. Phys. A590, 93c (1995). -
(16)
A.L.S. Angelis et al., HELIOS-3 Collaboration,
Eur. Phys.J. C5, 63 (1998). - (17) G. Agakichiev et al., CERES and TAPS Collaboration, Eur.Phys.J. C4, 231 and 249 (1998).
-
(18)
T. Goldmann, Minh Duong-van, and R. Blankenbecler,
Phys.Rev. D20, 619 (1979);
K. Kajantje, J. Kapusta, M. McLerran, and A. Mekjian, Phys.Rev. D34, 2746 (1986). -
(19)
L.D. McLerran and T. Toimela,
Phys.Rev. D31, 545 (1985). -
(20)
J. Cleymans, V.V. Golovizinin, and K. Redlich,
Z.Phys. C59, 495 (1993). - (21) A. Drees, Nucl.Phys. A610, 536c (1996).
- (22) T. Hatsuda and S.H. Lee, Phys.Rev. C46, R34 (1992).
-
(23)
G.Q. Li, C.M. Ko, and G.E. Brown,
Phys.Rev.Lett.75, 4007 (1995). -
(24)
G.Q. Li, C.M. Ko, G.E. Brown and H. Sorge,
Nucl.Phys. A611, 539 (1996). -
(25)
W. Cassing, W. Ehehalt, and C.M. Ko,
Phys.Lett. B363, 35 (1995). -
(26)
W. Cassing, W. Ehehalt, and I. Kralik,
Phys.Lett. B377, 5 (1996). -
(27)
M. Dey, V.L. Eletsky, and B.L. Ioffe,
Phys.Lett. B252, 620 (1990). -
(28)
R. Rapp, G. Chanfray, and J. Wambach,
Phys.Rev.Lett. 76,368 (1996). -
(29)
M. Harada and A. Shibata,
Phys.Rev. D55, 6716 (1997). -
(30)
A. Mishra, J. Reinhardt, H. Stöcker, and W. Greiner,
Phys.Rev. C66, 064902 (2002) -
(31)
Y. Kim, R. Rapp, G. Brown, and M. Rho,
Phys.Rev. C62, 01502 (1999). - (32) H. Georgi, Nucl.Phys. B331, 217 (1990).
-
(33)
M.A. Halasz, J.V. Steele, G.Q. Li, and G.E. Brown,
Phys.Rev. C58, 365 (1998) -
(34)
M. Harada and K. Yamawaki,
Phys.Rev.Lett. 86, 757 (2001). -
(35)
S. Muroya, A. Nakamura, and C. Nonaka,
Nucl.Phys.Proc.Suppl. 19, 544 (2003). -
(36)
W. Cassing and E.L. Bratkovskaya,
Phys.Rep. 308, 65 (1999). -
(37)
M. Hermann, B. Friman, and W. Nörenberg,
Nucl.Phys. A545, 267c (1992); A560, 411 (1993). -
(38)
G. Chanfray and P. Schuck,
Nucl.Phys. A545, 271c (1992);
Nucl.Phys. A555, 329 (1993). -
(39)
F. Klingl, N. Kaiser, and W. Weise,
Nucl.Phys. A606, 329 (1996). -
(40)
R. Rapp, G. Chanfray, and J. Wambach,
Nucl.Phys. A617, 472 (1997). -
(41)
W. Cassing, E.L. Bratkovskaya, R. Rapp, and
J. Wambach, Phys.Rev. C57, 916 (1998). - (42) R. Rapp and J. Wambach, Eur. Phys. J. A5, 415 (1999).
- (43) R. Rapp and C. Gale, Phys.Rev. C60, 024903 (1999).
-
(44)
J. Sollfrank, P. Huovinen, M. Kataya, P.V. Ruuskanen,
M. Prakash, and R. Venugopalan,
Phys.Rev. C55, 392 (1997). - (45) C.M. Hung and E.V. Shuryak, Phys.Rev. C57, 1891 (1998).
-
(46)
T. Renk, R. Schneider, and W. Weise,
Phys.Rev. C66, 014902 (2002). -
(47)
R. Baur et al., CERES Collaboration,
Nucl. Instr. Meth. A371, 16 (1996). -
(48)
T. Ullrich et al., CERES Collaboration,
Nucl.Phys. A610, 317c (1996). -
(49)
I. Ravinovich et al., CERES Collaboration,
Nucl.Phys.A638, 159c (1998) -
(50)
G. Agakichiev et al., CERES Collaboration,
Phys.Lett. B422, 405 (1998). -
(51)
B. Lenkeit et al., CERES Collaboration,
Nucl.Phys. A661, 23c (1999). -
(52)
B. Lenkeit et al., CERES Collaboration,
Nucl.Phys. A654, 627c (1999). -
(53)
M. Bleicher, A.K. Dutt-Mazumder, C. Gale, C.M. Ko,
and V. Koch, nucl-th/0004044. -
(54)
D. Adamová et al., CERES Collaboration,
Phys.Rev.Lett. 91, 042301 (2003). - (55) C. Voigt, Doct. Dissertation, Univ. Heidelberg (1998)
- (56) E. Socol, Ph.D. Thesis, Weizmann Institute, (1999)
-
(57)
B. Lenkeit, Doct. Dissertation,
Univ. of Heidelberg (1998) - (58) G. Hering, Doct. Dissertation, TU Darmstadt (2002)
-
(59)
S. Damjanović, Doct. Dissertation,
Univ. of Heidelberg (2002) - (60) U. Faschingbauer et al., Proposal to the SPSC, CERN SPSC/88-25/P237 and SPSC/88-40/P237/Add1
-
(61)
R. Baur et.al., CERES Collaboration,
Nucl.Instr.Meth. A343, 87 (1994) - (62) W. Chen et al., Nucl.Instr.Meth. A326, 273 (1993)
- (63) P. Holl et al., Proposal: Study of Electron Pair and Photon Production in Lead-Lead Collisions at the CERN SPS, CERN/SPSLC 94-1
- (64) P. Holl et al., CERES/NA45 Report to Cogne 1995, CERN/SPSLC/95-20 SPSLC/M542.
-
(65)
P. Holl, P. Rehak, F. Ceretto, U. Faschingbauer,
J.P. Wurm, A. Castoldi, and E. Gatti,
Nucl.Instr.Meth. A377, 367 (1996) - (66) W. Chen et al., IEEE Trans.Nucl.Sc.39, 619 (1992)
-
(67)
E. Gatti and P. Rehak, Nucl.Instr.Meth. A225, 608 (1984);
E. Gatti et al., Nucl.Instr.Meth. A235, 393 (1987) -
(68)
U. Faschingbauer, Doct. Dissertation,
Univ. Heidelberg (1993) - (69) U. Faschingbauer et al., Nucl.Instr.Meth. A377, 360 (1996)
- (70) W. Dabrowski, Univ. Cracov Preprint, 1993 (unpublished)
- (71) G. Gramegna et al., Nucl.Instr.Meth. A390, 241 (1997)
-
(72)
R. Baur et.al., CERES Collaboration,
Nucl.Instr.Meth. A343, 231 (1994) -
(73)
R. Baur et.al., CERES Collaboration,
Nucl.Instr.Meth. A355, 329 (1995) - (74) G. Agakichiev et al., JINR Rapid Comm.No 3[83] (1997)
- (75) C. Weber, Diploma Thesis, Univ. Heidelberg (1997)
- (76) F. Ceretto, Doct. Dissertation, Univ. Heidelberg (1998)
- (77) T. Ullrich, Doct. Dissertation, Univ. Heidelberg (1994)
- (78) G.A. Ososkov et al., Nucl.Instr.Meth. A371, 243 (1996)
- (79) P.V.C. Hough, U.S.Patent No. 3069654, (1962)
- (80) G. Agakichiev et al., Nucl. Instr. Meth. A371, 243 (1996).
- (81) G. Agakichiev et al., Nucl.Instr.Meth. A394, 225 (1997)
- (82) S.A. Bass et al., Progr. Part. Nucl. Phys. 41, 225 (1998); M. Bleicher et al., J.Phys. G25, 1859 (1999).
- (83) J. Slivova, Doct. Dissertation, Univ. Prague, (2003)
- (84) R. Brun et.al., CERN DD/EE/84-1.
- (85) Th. Ullrich and D. Irmscher, code GENESIS, unpublished
- (86) M. Aguilar-Benitez et al., Z.Phys. C50, 405 (1991)
- (87) F. Becattini, Z.Phys.C69, 485 (1996)
- (88) A. Drees, Proc.Int.Workshop on Gross Properties in Nuclei and Nuclear Excitations, Hirschegg 2000, GSI Darmstadt.
- (89) P. Braun-Munzinger, D. Miśkowiec, A. Drees, C. Lourenco, Eur.Phys.J. C1,123 (1998)
-
(90)
P. Braun-Munzinger, I. Heppe, and J. Stachel,
Phys.Lett. B465, 15 (1999) -
(91)
P. Braun-Munzinger, J. Stachel, J.P. Wessels,
N. Xu, Phys.Lett. B365, 1 (1996) - (92) J. Stachel, Nucl.Phys. A654, 119c (1999)
- (93) J. Bielcikova et al., CERES Collaboration, to be published.
-
(94)
F. Ceretto et al., CERES Collaboration,
Nucl.Phys A638, 467c (1998) -
(95)
H. Appelshäuser et al., NA49 Collaboration,
Nucl.Phys.A638, 91 (1998) -
(96)
M. Kaneta et al., NA44 Collaboration,
J.Phys. G23, 1865 (1997); Nucl.Phys. A638, 419 (1998) -
(97)
M.M. Aggarwal et al., WA98 Collaboration,
Phys.Rev.Lett.81, 4087 (1998) -
(98)
F. Sikler et al., NA49 Collaboration,
Nucl.Phys.A661, 45c (1999) -
(99)
C. Höhne et al., NA49 Collaboration,
Nucl.Phys.A661, 485c (1999) - (100) T. Peitzmann et al., WA98 Collaboration, Proc.29th Conference on High Energy Physics (ICHEP98), Vancouver, British Columbia, Canada (1998)
-
(101)
D. Jouan et al., NA50 Collaboration,
Nucl.Phys. A638, 483c (1998); A. de Falco et al., loc.cit.
487c;
B. Alessandro et al., Phys.Lett. B555, 147 (2002) -
(102)
F. Pühlhofer et al., NA49 Collaboration,
Nucl.Phys. A638, 431c (1998);
V. Friese et al., Nucl.Phys. A698, 487c (2002) - (103) S. Eidelman et al., Phys.Lett. B592, 1 (2004).
- (104) N. Kroll and W. Wada, Phys.Rev.98, 1355 (1955).
-
(105)
R.I. Dzhelyadin et al., Phys.Lett. 102B, 548 (1980);
L.G. Landsberg, Phys.Rep. 128, 301 (1985). -
(106)
G.J. Gounaris and J.J. Sakurai,
Phys.Rev.Lett.21, 244 (1968). - (107) B. Friman and J. Knoll, private communications 2000, 2004
-
(108)
H. Sako, GSI Techn. Report 03-24,
CERES Collaboration, unpublished (2000);
S. Damjanović, unpublished (2003). -
(109)
H. Appelshäuser, CERES Collaboration,
Nucl.Phys. A698, 253c (2002) -
(110)
J.P. Wessels, CERES Collaboration,
Nucl.Phys. A715, 262c (2003) -
(111)
A. Marín, CERES Collaboration,
J.Phys. G30, 709 (2004) - (112) A. Drees, Phys.Lett. B388, 380 (1996)
-
(113)
R. Albrecht et al., WA80 Collaboration,
Phys.Lett. B361, 14 (1995) - (114) V. Koch, Proceedings XXXVIIth Winter Meeting on Nuclear Physics, Bormio (Italy) (1999) and nucl-th/9903008
- (115) R. Rapp, private communications 2004
-
(116)
J.V. Steele, H. Yamagichi, and I. Zahed,
Phys.Rev. D56, 5605 (1997) - (117) W. Peters, M. Post, H. Lenske, S. Leupold, and U. Mosel, Nucl.Phys. A632, 109 (1998)
- (118) B. Friman and H. Pirner, Nucl.Phys. A617, 496 (1997)
- (119) M. Urban, M. Buballa, R. Rapp, and J. Wambach, Phys. Lett. B417, 1 (1998).
- (120) G. Chanfray, J. Delorme, and M. Ericson, Nucl. Phys. A637, 421 (1998).
- (121) O. Theodorescu, A.K. Dutt-Mazumder, and C. Gale, Phys.Rev. C63, 034903 (2001).
- (122) R. Rapp, 18th Winter Workshop on Nuclear Dynamics, Nassau, Bahamas (2002) and nucl-th/0204003
- (123) R. Rapp, Phys.Rev. C63, 054907 (2001)
- (124) L. Capelli, NA38/NA50 Collaboration, Nucl.Phys. A698, 539c (2002); M.C. Abreu et al., NA50 Collaboration, Eur.Phys.J. C14, 443 (2000)
-
(125)
R. Rapp and E.V. Shuryak,
Phys.Lett. 473B, 13 (2000);
G.Q. Li and C. Gale, Phys.Rev. C58,2914 (1998) - (126) E.V. Shuryak, Phys.Rep. 61, 71 (1980)
-
(127)
M.M. Aggarwal et al., WA98 Collaboration,
Eur.Phys.J. C23, 225 (2002) - (128) S. Turbide, R. Rapp, and C. Gale, Phys.Rev. C69, 014903 (2004)
- (129) C.-H. Lee, J. Wirstam, I. Zahed, and T.H. Hansson, Phys.Lett. B448, 169 (1999)
-
(130)
P. Jaikumar, R. Rapp, and I. Zahed,
Phys.Rev. C65, 055205 (2002) -
(131)
D. Adamová et al., CERES Collaboration,
Phys.Rev.Lett. 90, 022301 (2003) - (132) P. Braun-Munzinger, J. Stachel and Ch. Wetterich, Phys.Lett. B596, 61 (2004)
- (133) C. Song et al., Phys.Rev.Lett. B366, 379 (1996)