, , , , , ,
Extensive Particle Identification with TPC and TOF at the STAR Experiment
Abstract
Particle identification (PID) capabilities are studied by using the Time Projection Chamber (TPC) and a Time-Of-Flight (TOF) detector together at STAR. The identification capability of charged hadrons is greatly extended compared with that achieved by TPC and TOF separately. Particle spectra from p+p, d+Au collisions at 200 GeV and Au+Au collisions at 62.4 GeV are used to develop the methods. The transverse momentum () ranges of , and identification are from GeV/ to GeV/. The high reach is limited by statistics in current data sets. An important conceptual advance was developed to identify electrons by using a combination of dE/dx in TPC and velocity information from the TOF detectors, which is important for future low-mass dilepton program at STAR.
keywords:
particle identification, TOF, TPC, dE/dx, STARPACS:
29.40.Cs, 29.40.Gx, 29.85.+c1 Introduction
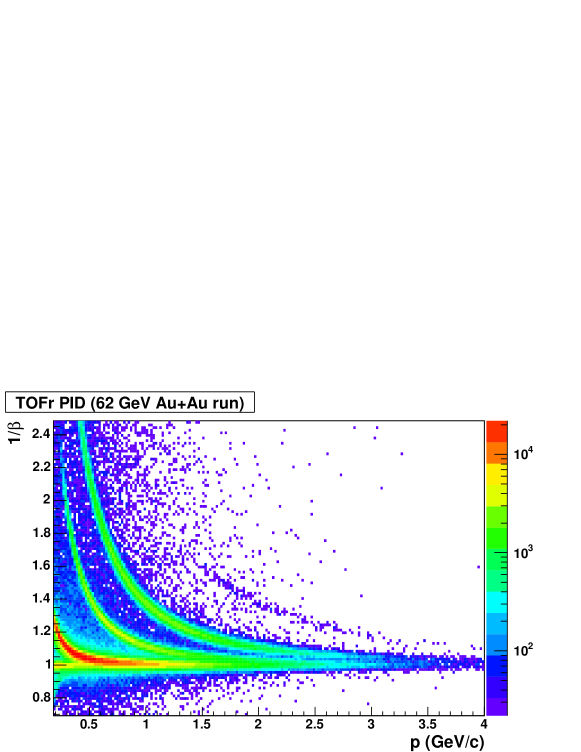
One of the goals of the relativistic heavy ion program at RHIC is to study quantum chromodynamics (QCD) at extreme condition [1]. A unique strength of the solenoidal tracker at RHIC (STAR)[2] is its large, uniform acceptance capable of measuring and identifying a substantial fraction of the particles produced in heavy ion collisions. Detectors relevant to the study presented in this article are the Time Projection Chamber (TPC) [3], and a proposed barrel time-of-flight (TOF) [5]. For stable charged hadrons, the TPC provides /K (+K/p) identification to 0.7 (1.1) GeV/ by the ionization energy loss (dE/dx) as usually been quoted and presented in the physics analyses[3]. However, direct particle identification (PID) capability for stable hadrons at intermediate/high is important for the study of collective flow and strong early-stage interaction in the dense medium formed in relativistic heavy ion collisions [1]. STAR PID capability can be further enhanced by the proposed TOF. A TOF system with a time resolution of 100 ps at STAR is able to identify /K (+K/p) to 1.6 (3.0) GeV/, as demonstrated in Fig. 1 (see also [6][7]). In addition, with relativistic rise of dE/dx from charged hadrons traversing the TPC at intermediate/high ( GeV/) and diminished yields of electrons and kaons at this range, we can identify pions and protons up to very high ( GeV/) in p+p, p+A and A+A collisions at RHIC. An important conceptual advance was developed to identify electrons by using a combination of dE/dx in the TPC and velocity information from the TOF detectors. This has been used to measure charm yield via its semileptonic decay [8]. Electron identification and hadron rejection power will be discussed in detail. This provides a basic tool for the future dilepton measurements with the azimuthal 2 coverage of a barrel time-of-flight system. The proposed dilepton measurements will provide a penetrating probe into the new state of dense matter produced in central heavy ion collisions at RHIC, since leptons do not participate in strong interactions occurring during hadronization and freeze-out.
2 Experiment Setup
At STAR[2], the main tracking device is a TPC, covering full azimuthal angle and units of pseudo-rapidity. A dE/dx resolution of can be achieved by requiring the tracks of charged particles to have at least 20 out of a maximum of 45 hits in the TPC. Detailed descriptions of the TPC and its electronics system have been presented in [3][4]. One tray of prototype time-of-flight detector based on multi-gap resistive plate chambers [9] (TOFr) was installed in STAR in 2003. It covers 1/60 in azimuth and in pseudo-rapidity at the outer radius of the TPC, 220 cm from the interaction point. Two identical pseudo-vertex position detectors (pVPD) were installed to record the start time for the TOFr, each 5.4 m away from the TPC center along the beam line. Each pVPD covers of the total solid angle in . More information of the TOFr and the pVPD can be found in [10][11]. The data used in this study were collected from Au+Au collisions at GeV in 2004, and p+p and d+Au collisions at GeV in 2003 at RHIC. The time resolution of the TOF system is (Au+Au) and (d+Au) respectively, which include pVPD’s contribution of (Au+Au) and (d+Au).
3 Stable Hadron Identification
3.1 PID at intermediate/high by TPC
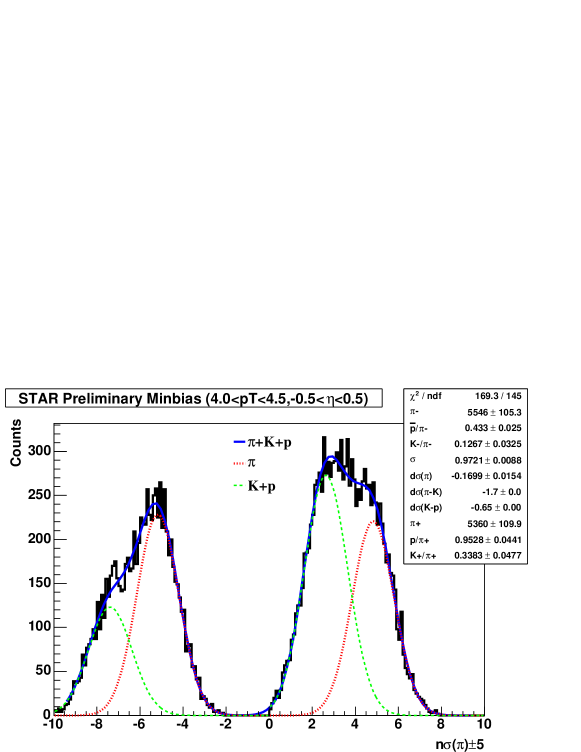
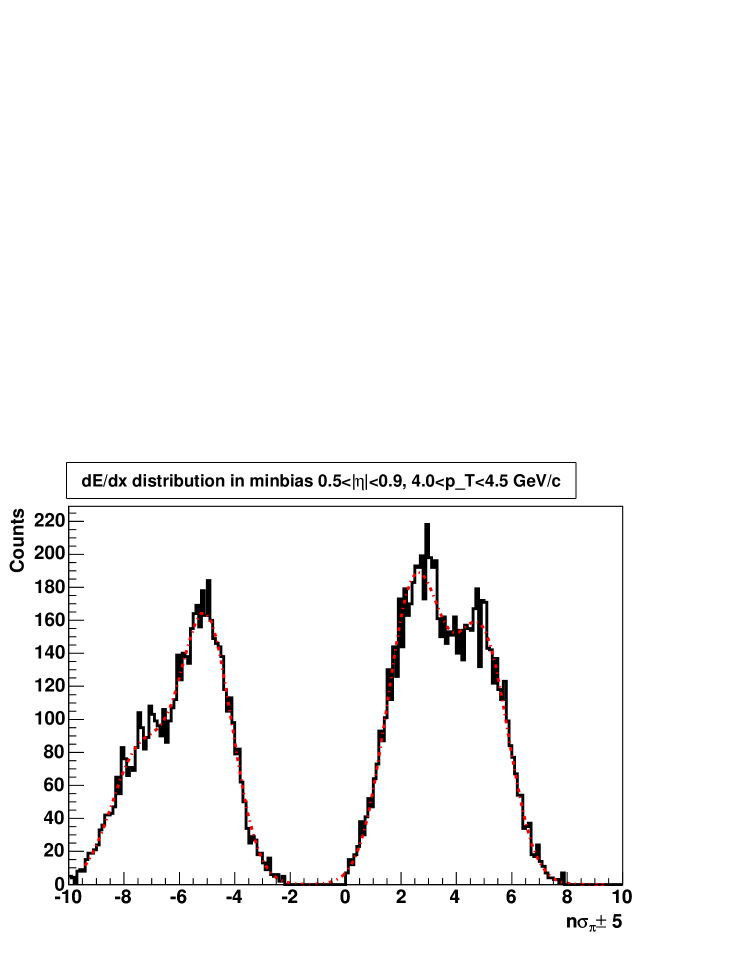
At GeV/, there is a difference of about in the dE/dx between pions and kaons due to the pion relativistic rise of the ionization energy loss. The difference between that of pions and (anti-)protons is even larger. This allows us to identify pions from other hadrons at this range by the TPC alone at level. The dE/dx resolution is , as demonstrated in Fig. 2. Shown in Fig. 3 is the distribution for charged hadrons at GeV/ and , where is the normalized dE/dx of pions. The normalized dE/dx is defined by , in which can be or . is the expected mean dE/dx of a particle , and is the dE/dx resolution of TPC. The distribution is a normal Gaussian distribution with an ideal calibration. The of positive and negative charged hadrons are displaced by +5 and -5 respectively in Fig. 3. Fig. 4 shows the dependence of and relative to , as predicted by the Bichsel function for the energy loss in thin layers of P10 [3]. From Fig. 3 and measurement from TOF [7], the yield difference between positive and negative inclusive charged hadrons is approximately that of proton and anti-proton ( , kaons’ contribution is small). Therefore, the peak positions of dE/dx distribution from should represent well that of protons (since ). Indeed, the calibrated Bichsel function for protons matches the dE/dx peak position of (), as shown in Fig. 4. In addition, as shown later, the dE/dx difference of protons and pions in the momentum range where PID selection is possible by TOF is also found to be consistent with the Bichsel function. These crosschecks confirm that the Bichsel function can be used to constrain the relative dE/dx position between kaons, (anti-)protons and pions. To extract pion yield, we performed a six Gaussian fit to the dE/dx distributions of positive and negative hadrons simultaneously as shown in Fig. 3. The and are fixed in a six-Gaussian fit, where the six Gaussians are for , and at a given bin. The sigma of the six Gaussians are chosen to be the same. The pion yields extracted from the fit can be found in [12]. As shown by Fig. 2 and discussed in [12], the PID of pions at 7-8 GeV/ is obtained with this method. The reach is limited by statistics and not by PID capability in this study.
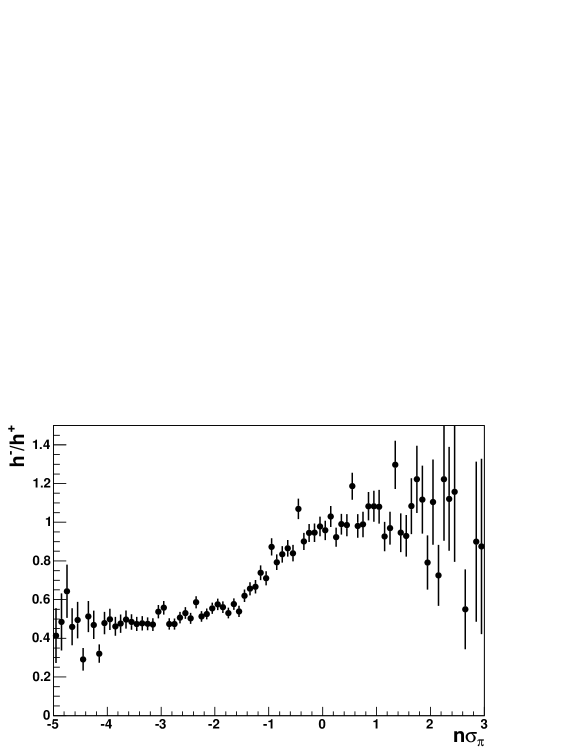
Fig. 4 shows that the dE/dx separation between kaon and proton is less than one at between 3 and 5 GeV/ and larger at around 10 GeV/. However, there are a few methods we can use to identify protons and cross check the contaminations from kaons. Fig. 5 shows the ratio of negative hadrons over positive hadrons as a function of dE/dx in unit of at GeV/. Since the energy loss of particles in TPC is independent of its charge sign, the dependence of on is due to different particle composition and due to the dE/dx separation between pion, kaon and proton. Fig. 5 shows two plateaus. One from and the other from . We will be able to select protons with reasonable purity by requiring in this particular bin. We can then use an independent measurement of from V0 method to constrain the charged kaon yields in the six-Gaussian fit or to estimate the charged kaon contaminations described above to obtain reliable proton yield. Detailed studies and measurements are underway.
3.2 Hadron PID at Intermediate by TPC+TOF
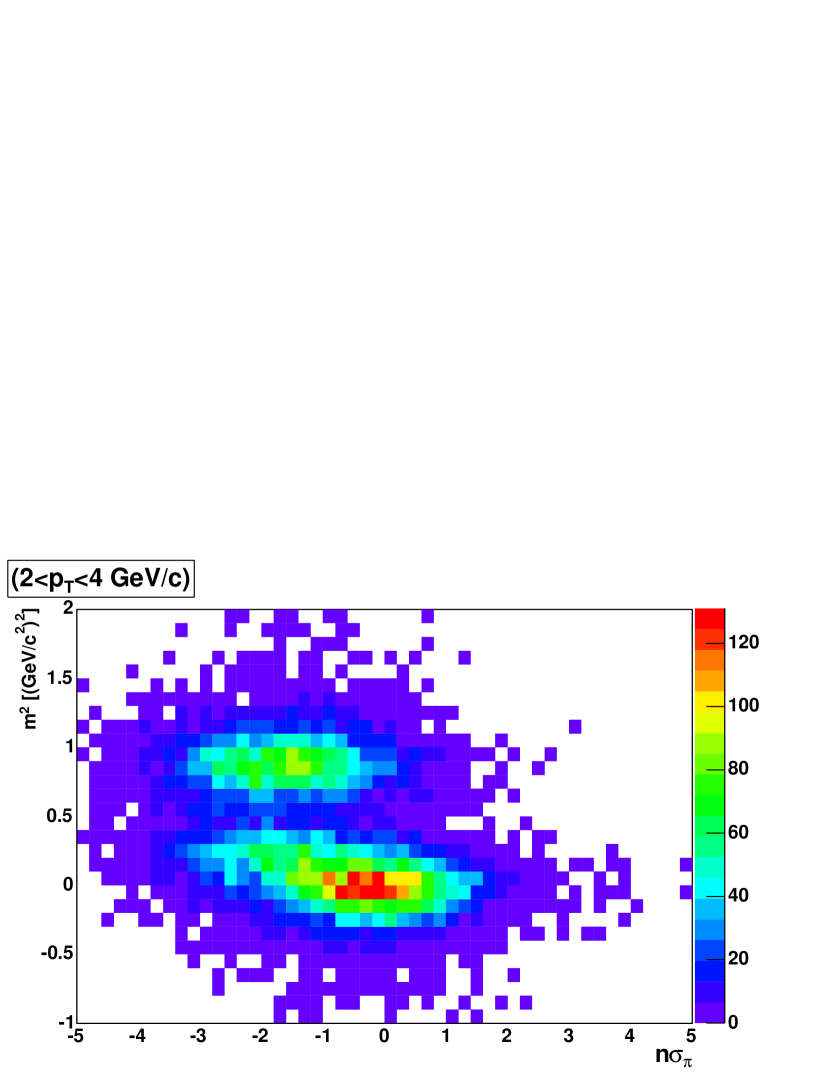
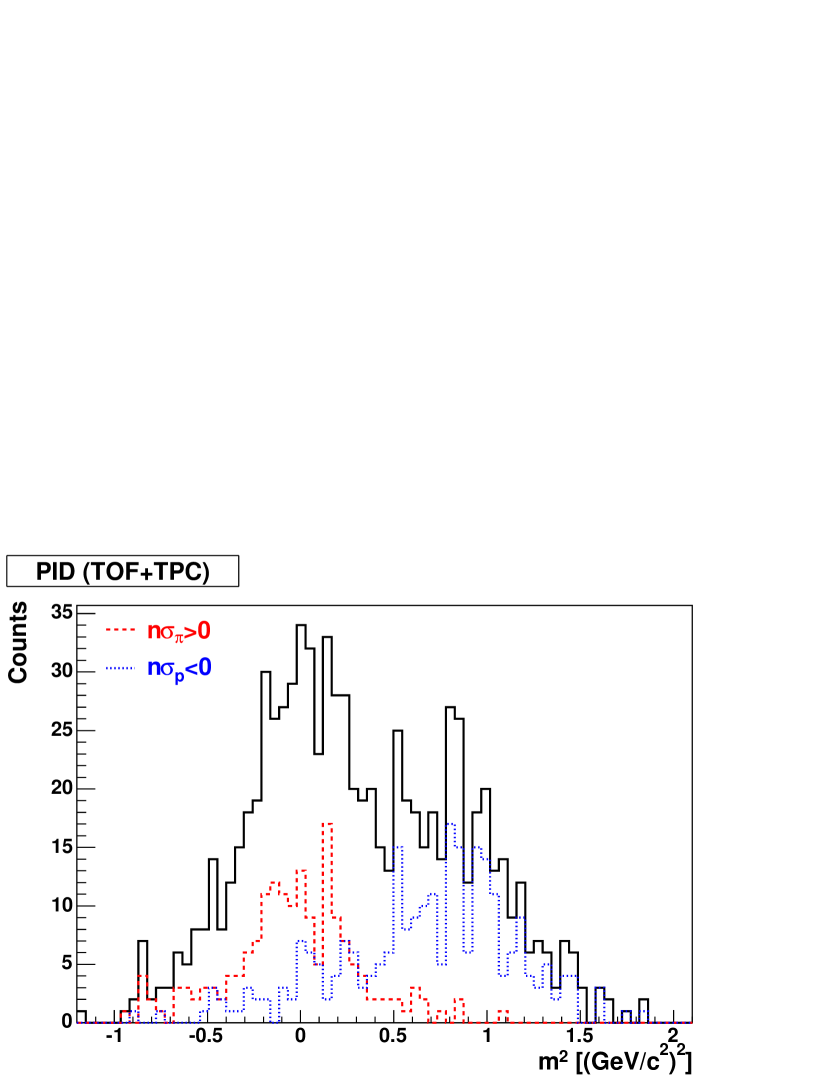
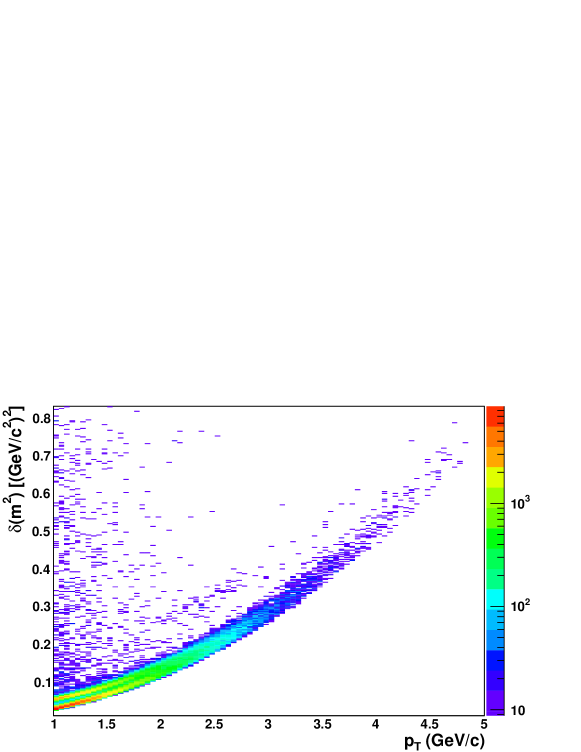
Fig. 1 and Fig. 2 show that TOF alone is not able to separate between pions and kaons and TPC alone is not able to separate pions, and protons at the range roughly between 2.0 and 4.0 GeV/. However, the dependence of on from TOF and that of dE/dx on are different in this range and therefore, by combining these two, we will be able to extend our PID capability. Fig. 7 shows the hadron distribution as a function of and mass square (), with , where p is the momentum, is the time of flight, is the speed of light in vacuum, and is the flight path length of the particle. The pion, kaon and (anti-)proton peak can be clearly seen in Fig. 7. The solid line in Fig. 7 is the projection of Fig. 7 to the direction at GeV/. At this range, the pion and kaon bands are merged together, and cannot be clearly separated from the (anti-)proton band with the TOF. However, if we require and then plot the distribution again (dashed line in Fig. 7), the kaon and (anti-)proton bands are greatly suppressed and a clear pion signal is observed. This is due to the rather large difference between and or in this range, as shown in Fig. 4. Similarly, the pion and kaon bands are suppressed significantly with respect to the (anti-)proton band when is applied. This helps us get a cleaner (anti-)proton signal. Therefore, the combination of the TPC and TOF enhances the particle identification at GeV/ where neither TPC nor TOF can well separate the hadrons.
The invariant yields of pions, kaons and (anti-)protons were calculated for 62.4 GeV Au+Au collisions. The results were shown elsewhere in [7]. The pions and (anti-)protons were identified at 5 GeV/, and the kaons were identified at 3 GeV/. The PID reach is due to low statistics with the small acceptance of TOFr.
3.3 Cross-check at low/intermediate
| - | ||||||
|---|---|---|---|---|---|---|
| (GeV/) | mean | sigma | mean | sigma | measurement | expectation |
| 0.9-1.0 | -0.1850.006 | 0.9800.004 | 4.7270.014 | 1.1100.010 | 4.9120.020 | 4.936 |
| 1.0-1.2 | -0.1710.005 | 0.9770.004 | 3.1760.021 | 1.1710.015 | 3.3470.026 | 3.421 |
| 1.2-1.4 | -0.1500.007 | 0.9580.005 | 1.5620.013 | 1.1120.011 | 1.7120.020 | 1.872 |
| 1.4-1.6 | -0.1800.010 | 0.9460.007 | 0.4640.015 | 1.0730.012 | 0.6450.025 | 0.768 |
| 1.6-1.8 | -0.1950.013 | 0.9380.010 | -0.3220.019 | 1.0210.014 | -0.1270.032 | -0.036 |
| 1.8-2.0 | -0.2280.021 | 0.9230.015 | -0.8340.023 | 0.9890.016 | -0.6060.044 | -0.616 |
| 2.0-2.5 | -0.1710.029 | 0.9720.023 | -1.4580.025 | 1.0340.019 | -1.2870.054 | -1.174 |
| 2.5-3.0 | -1.9120.056 | 1.1610.048 | -1.910.01 | -1.72 | ||
| 3.0-3.5 | -2.3870.113 | 1.1110.121 | -2.400.01 | -2.06 | ||
| 3.5-4.0 | -2.500.02 | -2.27 | ||||
| 4.0-4.5 | -2.520.04 | -2.35 | ||||
| 4.5-5.0 | -2.470.08 | -2.44 | ||||
| 5.0-6.0 | -2.470.15 | -2.47 | ||||
| 6.0-7.0 | -2.600.28 | -2.47 | ||||
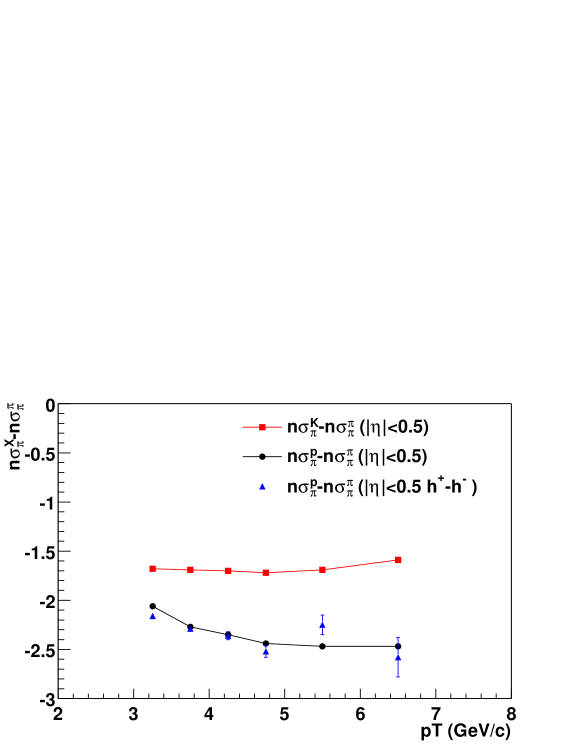
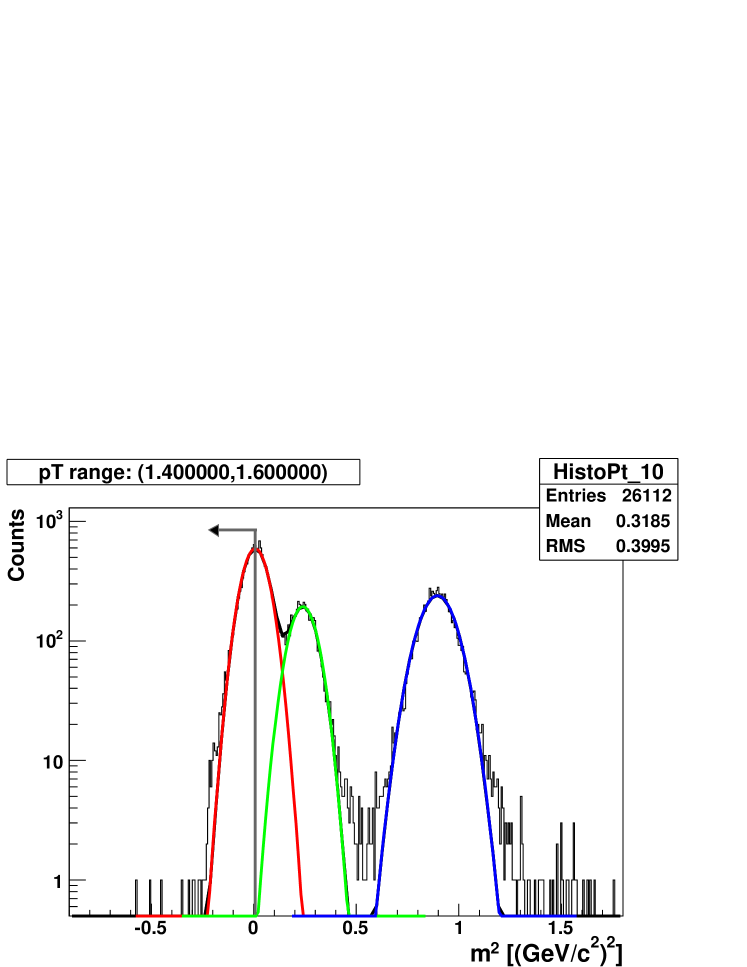
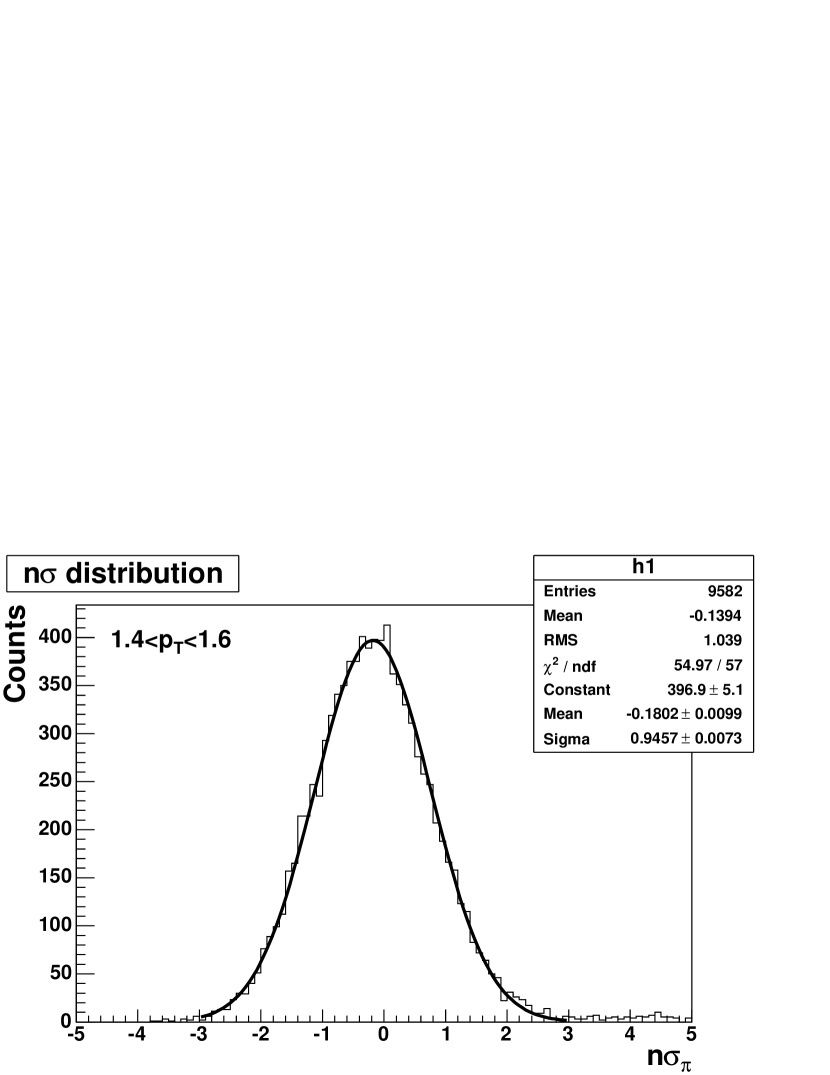
Since dE/dx plays a key role in our methods discussed above, dE/dx calibration has to be carefully studied. Again, with PID capability at overlapping range, we can use identified particles (pions, protons etc.) from TOFr to cross-check the characteristics of (, K, ) distribution at low/intermediate . Fig. 9 demonstrates an example of choosing a pion sample by cutting on . We can then plot the distribution of this sample and fit it with a Gaussian function as in Fig. 9. The mean and sigma of the Gaussian are listed in Table 1 as a function of . The parameters (mean and sigma) obtained from proton samples are also listed in Table 1. We note that the width of is systematically larger than that of pions, partly due to the different resolution from different track length resulting in dispersion of . The values of these parameters for pions and (anti-)protons are almost independent of and consistent with that obtained by pure dE/dx method (see Fig. 3). The last two columns in Table 1 show the measured - compared to Bichsel function calculation. The experimental results agree well with the expectations within errors.
3.4 Contamination in pion identification
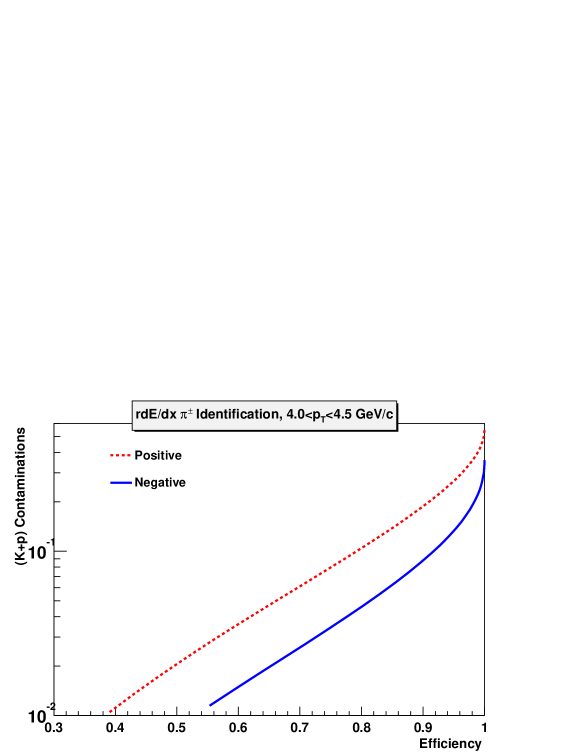
Good particle-by-particle identification is crucial for analyses such as collective flow and fluctuation which provide important physics at RHIC. Not only can pion yields be obtained by statistically fitting of the histogram, pion identification can also be obtained track by track using a dE/dx cut on the . Fig. 10 illustrates the contamination to pions in percentage from kaons and (anti-)protons when we select greater than a given value (threshold). We can achieve pion purity at pion efficiency when requiring . As have been shown previously, is actually not centered at zero due to insufficient calibration. However, this can be easily corrected for. If one can tolerate a pion contamination of , then the efficiency can be as high as . These represent the worst-case scenario since at higher the baryon enhancement is less and the contamination should be smaller.
3.5 Contamination in proton identification
The contamination in (anti-)proton identification is a little more complicated. As shown in Fig. 2, the separation of dE/dx between protons and kaons is at intermediate/high . Therefore the purity of protons at GeV/ is mainly driven by the resolution of TOFr. The resolution is formulated by:
where is the momentum, is the time of flight and is the track length of the particle. Fig. 11 depicts the resolution for all charged particles as a function of , at . The momentum resolution is taken from [3]. and are chosen to be 110ps and 0.5cm, respectively. At intermediate/high , the resolution increases approximately quadratic with momentum. If we require (mass square of ) and , which means an (anti-)proton efficiency of , the contamination from pions and kaons is at GeV/. We have used the invariant yields of /K/p from [7][13] in this estimation.
At higher ( GeV/), TOFr is not effective in identifying (anti-)protons anymore. The contamination to (anti-)proton identification from kaons is mainly determined by the separation between them. Therefore, at efficiency (), kaon contamination is about 20% assuming kaon and proton yields are equal. Again we can use different methods to evaluate the contamination and efficiency as described in previous section.
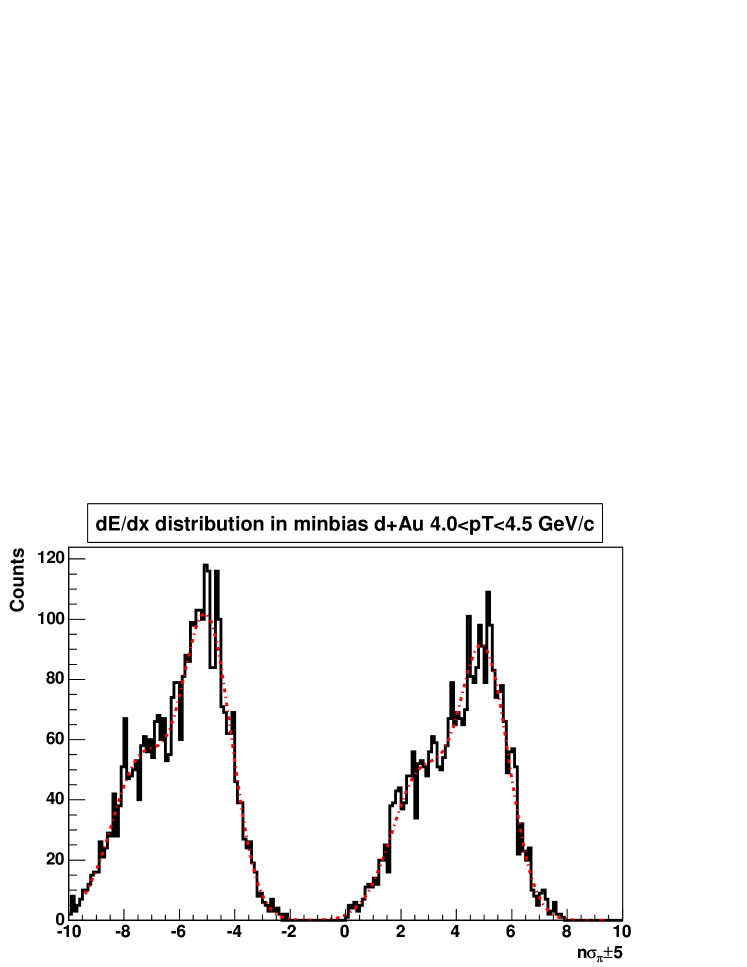
At STAR, the resolution of dE/dx measurement depends on many factors, including magnetic field setting, event multiplicity, beam luminosity, track length and drift distance. It also depends on the number of hits in TPC used to calculate the ionization energy loss for a given track. Excellent readout electronics system (pulse shape control, fine linearity and large dynamic range, etc.) and careful offline calibration are important to achieve high-quality dE/dx measurement. Particle identification may have difference efficiency and purity, depending on the experimental setting and cuts used in analysis. Basically, dE/dx resolution is improved with longer track length, shorter drift distance, stronger magnetic field, lower multiplicity and beam luminosity, as well as more hits in TPC used for track fitting. Fig. 13 and 13 shows pion identification at in Au+Au collisions at GeV and in d+Au collisions at GeV/, respectively. Due to longer track and shorter drift distance for particles produced at higher , the dE/dx resolution gets better. Thus the separation between pions and Kaons or(anti-)protons in Fig. 13 and Fig. 13 are larger than that in Fig. 3, and better identification can be achieved. From the relative heights of pion and proton peaks, it is also obvious that the particle compositions in Au+Au at =62.4 GeV and d+Au at =200 GeV are different.
4 Electron Identification at low/intermediate
In addition to its hadron PID capability, TOFr detector can be used to identify electrons by combining it with dE/dx from TPC. We were not able to measure dilepton with the prototype MRPC TOF tray installed in STAR due to small TOF acceptance. However, single electron spectra are sensitive to charm production and future azimuthal coverage of TOF will enable us to do dilepton physics[8]. In this section, we will discuss the electron identification method, the hadron rejection power at low and rejection of the photonic background from conversions and Dalitz decays [14].
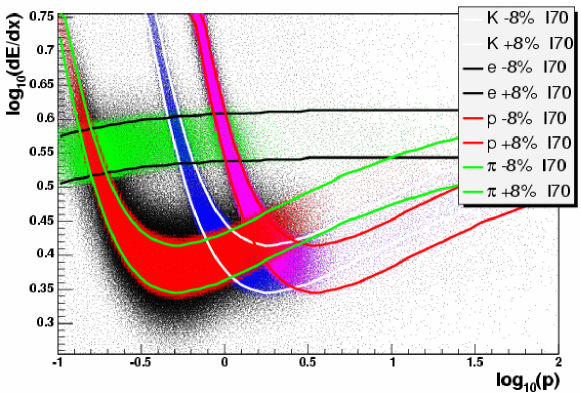
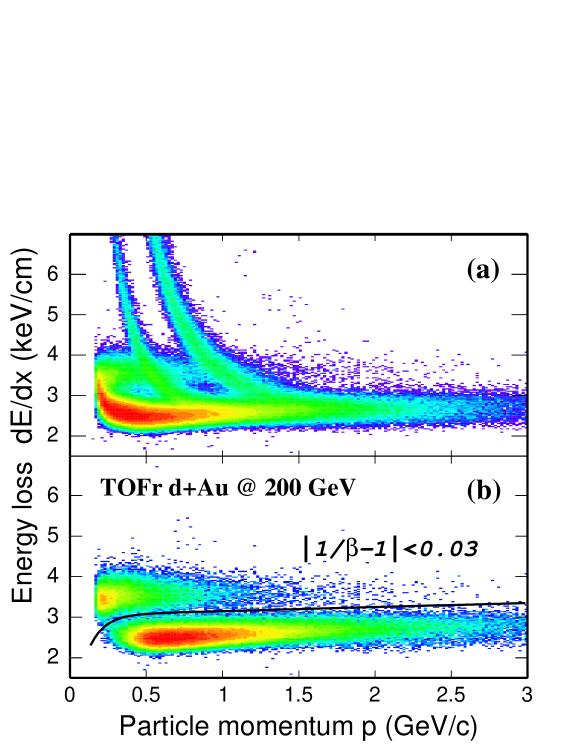
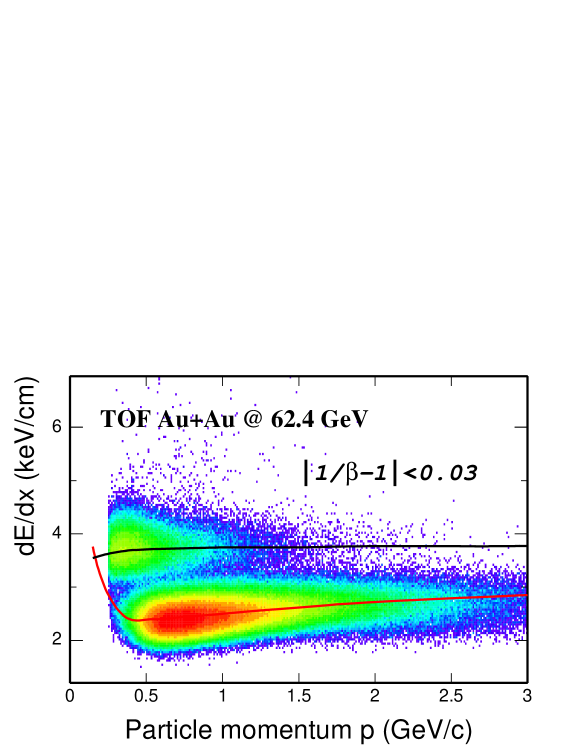
The top panel of Fig. 14 shows the 2-D scatter plot of dE/dx as a function of the particle momentum () for charged particles with TOFr matched hits from +Au collisions. The bottom panel shows that slow hadrons are eliminated and the electron band is well separated from the hadron band with a particle velocity () requirement at . Electrons can then be selected with the following cut (1):
| (1) |
where is in GeV/ and dE/dx is in keV/cm. With the combination of dE/dx from TPC and from TOFr, electrons can be identified above GeV/, while the high reach is limited by the statistics in this analysis.
4.1 contamination for electron identification
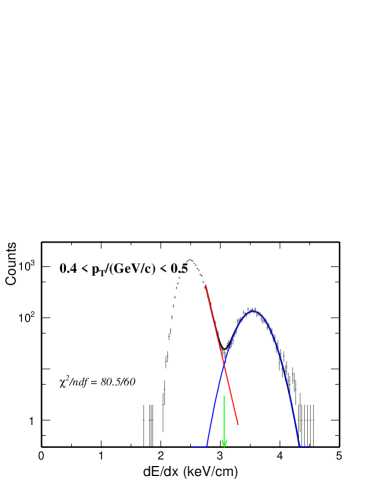
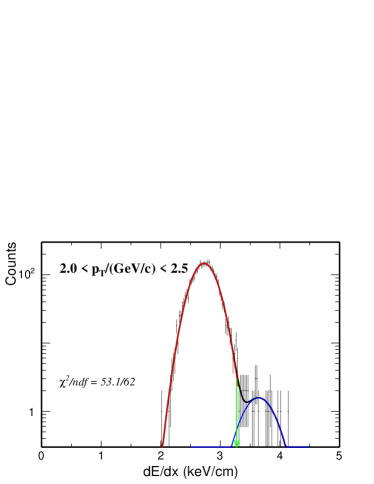
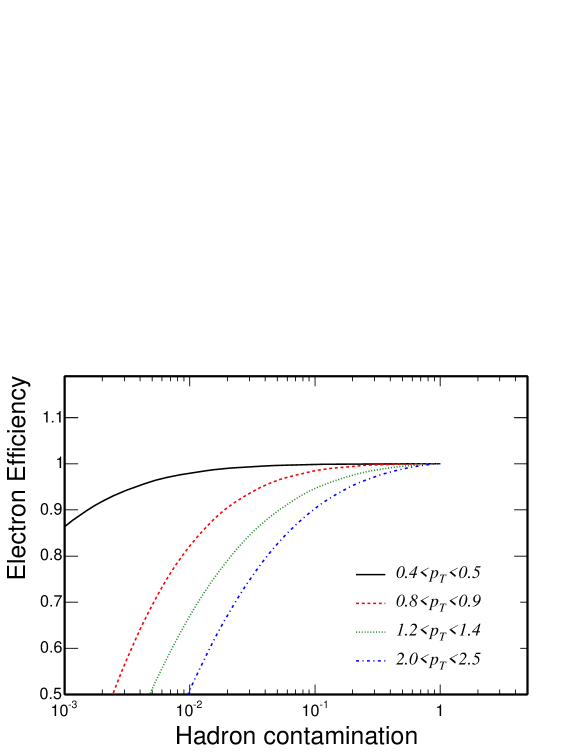
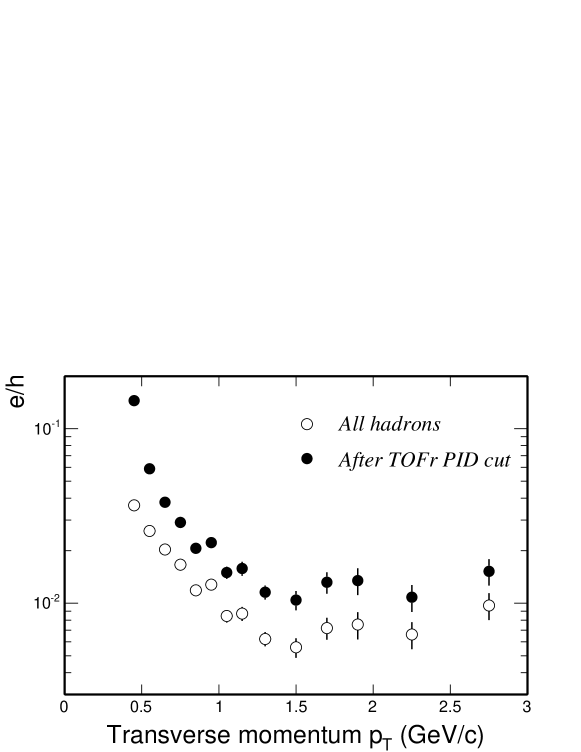
Hadron contamination to electron identification with TOFr velocity cut was studied from the dE/dx distribution in each bin. A Gaussian function with an exponential tail is used in the fit. At GeV/, 2-Gaussian fit is also performed and shows little difference from the Gaussian plus exponential fit. Fig. 15 shows the results in two bins from d+Au collisions. The arrows denote the cut from Eq. ( 1). Hadron contamination ratio is estimated from these fits, and shown in Fig. 16. The electron efficiency is obtained by varying the cut in Eq. ( 1). At low , high electron efficiency and low hadron contamination can be achieved. Even at intermediate , the contamination can be reduced to a low level () if a lower electron efficiency () is chosen. Fig. 17 shows electron to hadron ratio vs. before and after TOFr velocity selection. The hadron rejection power can be evaluated by (hadron contamination)()/(electron efficiency) for a specific condition. It was estimated to be at level at GeV/. At higher , additional hadron rejection from electromagnetic calorimeter in similar fiducial coverage can help reach the same rejection power [16].
4.2 Single electrons from Au+Au collisions at = 62.4 GeV
The purpose of the data analysis of d+Au and p+p collisions is to set up the baseline for heavy ion collisions. Since the large data sample of Au+Au collisions at = 200 GeV is not available yet, the smaller sample of Au+Au collisions at = 62.4 GeV has been analyzed to understand the necessary techniques for Au+Au collisions. There is a significant increase of multiplicities in Au+Au collisions as compared to that in p+p and d+Au collisions, and a consequent decrease of track quality. In this section, we discuss the electron measurements from TOF and dE/dx method and the photonic background estimation. Since the charm yield is low compared to photonic contributions at = 62.4 GeV, any excess of electrons above the photonic background with acceptable errors is not expected. This provides a testing ground to evaluate the quality of background reconstruction.
STAR has accumulated million events in a relatively short run with Au+Au collisions at = 62.4 GeV. With the minimum bias trigger () and vertex z position selection, the events used in this analysis are million. The resolution for TOF detectors is ps for TOF system, with ps start timing resolution included. The hadron PID capability was reported in [7]. As in d+Au and p+p collisions, electrons can be identified by combining TOF and dE/dx in the TPC. Electrons were selected to originate from the primary interaction vertex according to the criteria shown in Table 2.
| Method | TOF+dE/dx |
|---|---|
| 30 cm | |
| primary track ? | Yes |
| nFitPts | 25 |
| ndEdxPts | 15 |
| rapidity | (-1.0, 0) |
| (0., 3.0) | |
| from TOF | |
| TOFr hit quality | |
| /cm | |
| cm | |
| TOFp hit quality | |
| /cm | |
| /cm |
Fig. 18 shows the dE/dx vs. particle momentum after a cut from TOF. The electron dE/dx band can be separated from that of hadrons. The dE/dx resolution in Au+Au collisions decreases when compared to that in d+Au and p+p due to much higher multiplicities and a multiplicity dependence of dE/dx calibration which is not currently implemented. We fit the dE/dx distribution around electron peak with both two-gaussian function and exponential+gaussian function to extract the electron raw yields in each bin.
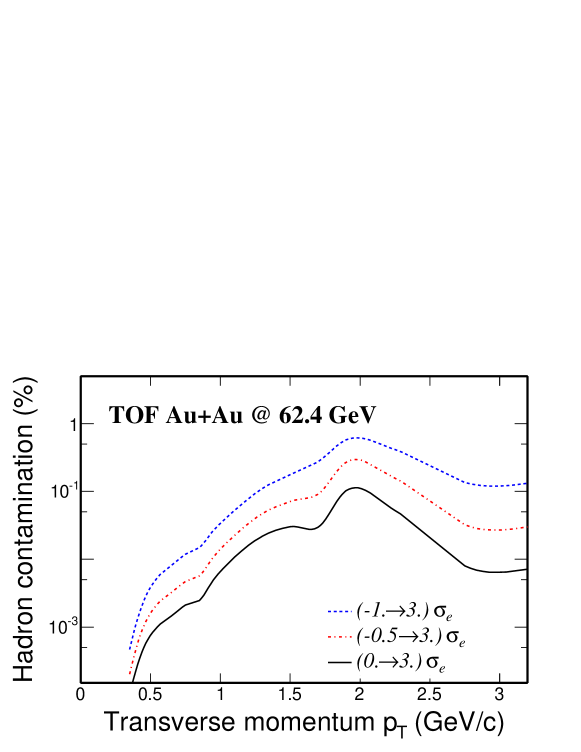
Hadron contamination becomes larger at GeV/ if we select electrons with the same efficiency as in p+p and d+Au collisions. Fig. 19 shows the hadron contamination fractions under different electron selections. The selection with electron efficiency of about is necessary to have the contaminations less than 10% at GeV/. At lower , the identification is not affected as much by the high multiplicity since most of the hadrons are rejected by time-of-flight selection.
4.3 Estimate of electrons from photonic source in Au+Au
| charge | opposite to tagged track |
|---|---|
| primary/global ? | global |
| nFitPts | 15 |
| nFitPts/nMax | 0.52 |
| (0., 3.0) | |
| (-1., 3.0)† | |
| of , | (0.0, 3.0) cm |
† several different cuts have been studied.
Photon conversions and Dalitz decays are the dominant photonic sources of electron background. Since only one TOF tray (120th of the proposed TOF) is available, electron identification of both daughters from conversion or Dalitz decays is not possible at this momentum. To measure the background photonic electron spectra, the invariant mass and opening angle of the pairs were constructed from an electron (positron) in TOFr and every other positron (electron) candidate reconstructed in the TPC [15]. A secondary vertex at the conversion point was not required. In Au+Au collisions, due to large multiplicity, the partner track reconstruction will lead to a large combinatorial background due to hadron contamination without an additional PID from TOF. Even with a stringent dE/dx selection, this combinatorial background is still significant. In the future, dilepton studies would be possible with coverage of TOF for selecting clean pairs. Fig. 20 shows the electron pair candidate invariant mass distribution. The tagged electron was selected from TOF with the cuts shown in Table 2 and additional . The partner track candidate was selected according to Table 3.
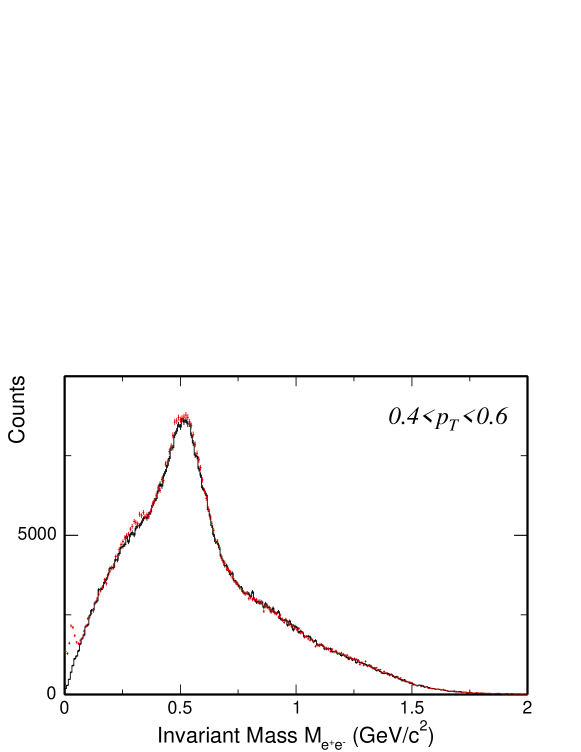
The combinatorial background distribution was provided by rotating the partner track momentum , and normalized to the distribution of the real electron pair candidates in the region / (GeV/) in the invariant mass spectrum. Fig. 20 shows the results in GeV/ where is the of tagged electrons. The plot shows that the combinatorial background was very well reproduced. The peak from photon conversion in detector material is clearly visible near zero mass region, and its offset from zero is due to the opening angle resolution [15] in TPC tracking. The Dalitz contribution is not visible in this case, possibly because the Dalitz contribution is much smaller and distribution is much broader compared to conversion processes. We subtracted the combinatorial background from the real distribution, and integrated the remaining distribution from GeV/c2 to get the reconstructed main photonic background raw yield. In this case, we assumed that both photon conversion and Dalitz decays were reconstructed.
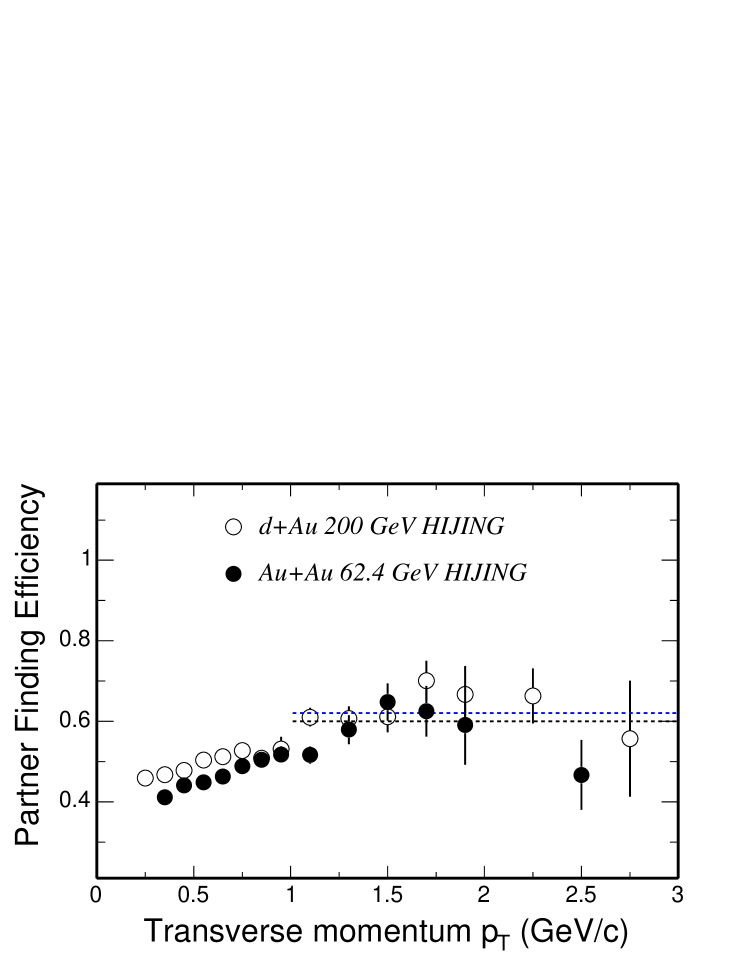
The background raw yield need to be corrected for the reconstruction efficiency, as we did it for d+Au and p+p collisions [8]. This efficiency was calculated from Au+Au 62.4 GeV HIJING events with full detector MC simulations. After cm cut, K events were used in the calculation. We took all TPC electron tracks without any dE/dx and TOF hit cut to improve the statistics. The procedure is the same as we did in p+p and d+Au collisions [8]. Fig. 22 shows the background reconstruction efficiency in Au+Au 62.4 GeV compared with d+Au results. Due to the higher multiplicities, the reconstruction efficiency is relatively lower in Au+Au than that in d+Au.
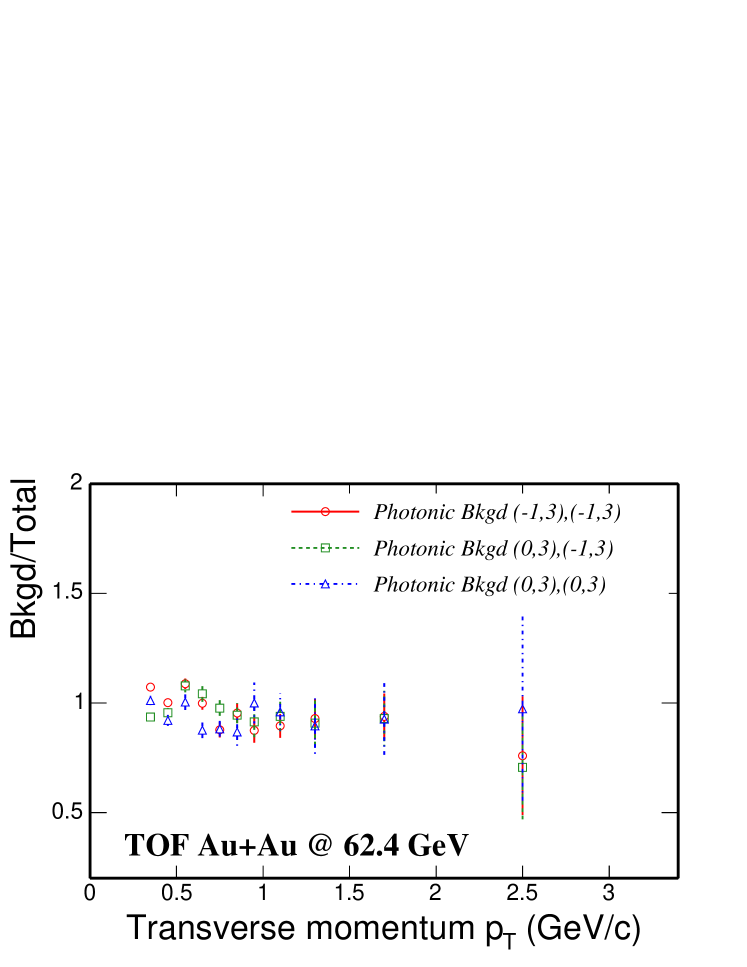
This efficiency was used to correct for the photonic background raw yield obtained from above. In addition, a fraction of other photonic background (from d+Au results) and the selection efficiency were also included. The corrected background spectrum is compared with the inclusive spectrum as shown Fig. 22. The reconstructed background matches the total inclusive electron spectrum. This is expected since the charm yield is more than an order of magnitude lower than the inclusive electron yield at 62.4 GeV [14]. This also demonstrates that we can reconstruct fully the photonic background from conversions and Dalitz decays.
The performance of the electron identification and background studies for Au+Au system makes us confident on extracting the charm signal at GeV/c from the coming 30 M minimum bias 200 GeV Au+Au data. With the STAR upgrade of inner tracker –Heavy Flavor Tracker (HFT), we will be able to reject photon conversions by requiring additional hits in HFT, to reject electrons from charm semileptonic decays by its displaced secondary vertex, and to further reconstruct/reject the low partner of the electrons from the Dalitz decays using inner tracker only. Electron identification at GeV/ can be improved by combining dE/dx from TPC, velocity from TOF and energy from electromagnetic calorimeter. Detailed studies are underway and are beyond the scope of this article.
5 Conclusion
In summary, we have developed a technique to extend the particle identification up to high at STAR. By combining information from the TPC and TOF, we can measure pion, kaon and (anti-)proton in the intermediate/high range and electron in low/intermediate (high limited by statistics). Preliminary spectra obtained in Au+Au collisions at =62.4 GeV shows reliable particle identification to GeV/ for pions and (anti-)protons, and GeV/ for kaons, respectively. The electrons were identified at GeV/, in d+Au, p+p collisions at =200 GeV and Au+Au collisions at =62.4 GeV. A purity of over for pion identification and for proton identification was obtained with this method at intermediate/high . We achieved a hadron rejection power at level for the electron identification at low .
6 Acknowledgement
We thank the STAR Collaboration, the RHIC Operations Group and RCF at BNL, and the NERSC Center at LBNL for their support. This work was supported in part by the HENP Divisions of the Office of Science of the U.S. DOE; the Ministry of Education and the NNSFC of China.
References
- [1] STAR whitepaper:”Experimental and Theoretical Challenges in the Search for the Quark Gluon Plasma: The STAR Collaboration’s Critical Assessment of the Evidence from RHIC Collisions”, nucl-ex/0501009.
- [2] K.H. Ackermann et al., Nucl. Instr. Meth. A 499 (2003) 624.
- [3] M. Anderson et al., Nucl. Instr. Meth. A 499 (2003) 659.
- [4] M. Anderson et al., Nucl. Instr. Meth. A 499 (2003) 679.
- [5] The STAR TOF Collaboration, Proposal for a Large Area Time of Flight System for STAR.
- [6] J. Adams et al. (STAR), nucl-ex/0309012; Lijuan Ruan, Ph.D. thesis, University of Science and Technology of China, nucl-ex/0503018.
- [7] M. Shao (STAR), Hot Quarks 2004, July 18-24, 2004, Taos Valley, New Mexico, USA; J. Phys. G: Nucl. Part. Phys. 31 (2005) S85-S92; L. Ruan (STAR), SQM 2004, Sep. 15-20, 2004, Cape Town, South Africa.
- [8] J. Adams et al. (STAR), Phys. Rev. Lett. 94 (062301) 2005; nucl-ex/0407006.
- [9] E. Cerron Zeballoset al., Nucl. Instr. Meth. A 374 (1996) 132.
- [10] B. Bonner et al., Nucl. Instr. Meth. A 508 (2003) 181; M. Shao et al., Nucl. Instr. Meth. A 492 (2002) 344.
- [11] W.J. Llope et al., Nucl. Instr. Meth. A 522 (2004) 252.
- [12] Z. Xu (STAR), Division of Particles and Fields 2004, Aug. 26-31, 2004, Riverside, CA, USA; nucl-ex/0411001.
- [13] J. Takahashi (STAR), SQM 2004, Sep. 15-20, 2004, Cape Town, South Africa.
- [14] Xin Dong, PH.D. Thesis, University of Science and Technology of China, 2005.
- [15] J. Adams et al. (STAR Collaboration), Phys. Rev. C 70 (2004) 044902; I. Johnson, Ph.D. thesis, U.C. Davis, 2002.
- [16] M. Beddo et al., Nucl. Instr. Meth. A 499 (2003) 725.