A high power liquid hydrogen target for the Mainz A4 parity violation experiment
Abstract
We present a new powerful liquid hydrogen target developed for the precise study of parity violating electron scattering on hydrogen and deuterium. This target has been designed to have minimal target density fluctuations under the heat load of a 20A CW 854.3 MeV electron beam without rastering the electron beam. The target cell has a wide aperture for scattered electrons and is axially symmetric around the beam axis. The construction is optimized to intensify heat exchange by a transverse turbulent mixing in the hydrogen stream, which is directed along the electron beam. The target is constructed as a closed loop circulating system cooled by a helium refrigerator. It is operated by a tangential mechanical pump with an optional natural convection mode. The cooling system supports up to 250 watts of the beam heating removal. Deeply subcooled liquid hydrogen is used for keeping the in-beam temperature below the boiling point. The target density fluctuations are found to be at the level 10-3 at a beam current of 20 A.
keywords:
Charge conjugation, parity, time reversal, and other discrete symmetries , Particle sources and targets , Polarized and other targetsPACS:
11.30.Er , 29.25.-t , 29.25.Pj, , , , , , , , , , , , , , ,
1 Introduction
Cryogenic liquid hydrogen targets have become common experimental equipment in and particle physics experiments. The most powerful new targets have been requested for electron scattering parity violation experiments, which are able to register the small effects of weak interaction at the level 10-6. In these targets heating can reach a few hundred watts, but target density fluctuations should not become larger than 10-3 to reach high statistical accuracy of measurements. One source of target density fluctuations is the heating of the liquid hydrogen by the energy deposit of the electron beam. Overheating can cause boiling. Therefore, the task of in-beam heat removal is to be solved. Recently, Experiments at the MIT-Bates accelerator [1, 2], at the TJNAF [3], and at SLAC [4] have reported on their powerful targets. In this paper we present the target design and realization for the A4-experiment at the MAMI accelerator in Mainz [5, 6, 7, 8, 9].
The aim of the A4-experiment is a precise measurement of the parity violating asymmetry in the elastic scattering of right and left handed electrons on an unpolarized proton target. The expected value of the asymmetry is on the order of 10-6. The experiment is carried out at the MAMI facility in Mainz with a 80% polarized 854.3 Mev electron beam. With modern GaAs photocathodes high currents of polarized electron beam combined with online intensity and polarization monitoring have been realized [10]. A large calorimeter with 1022 crystals to handle a total of 100 MHz counting rate has been developed. An innovative feature of this detector is a use of new, high resolution and very fast PbF2 Cerenkov radiators [11]. The 10 cm liquid hydrogen target provides a luminosity of cm-2s-1 at 20 A electron beam current. This corresponds to about 100 watts of heat absorbed in the liquid hydrogen and in the aluminum windows. The target cell is included in a closed loop with a hydrogen-helium heat exchanger, where the liquid hydrogen circulation is forced by a mechanical tangential pump. This is a common scheme for the high power cryogenic system in which a high mass flow and a high heat transfer rate can be achieved. We outline the characteristic features of this target as follows.
-
-
The target has a wide aperture for scattered electrons in forward (optionally in backward) direction. It is axially symmetric with respect to the incident beam axis.
-
-
The hydrogen moves along the beam. Therefore a special flow geometry was applied to intensify a turbulent transverse mixing in the hydrogen stream. The turbulence causes a mass exchange and a heat removal from the heated region transverse to the beam direction.
-
-
The helium cooling system was designed in a way to maintain deeply subcooled (down to freezing point) liquid hydrogen in order to enlarge the head room for the beam heating without boiling.
-
-
A powerful cryogenic pump was used. It produces up to 0.3 bar overpressure and can provide a mass flow of several hundred grams per second of liquid hydrogen. This would cover the needs of a few kilowatt cryogenic system, provided the corresponding helium refrigerator power is provided.
-
-
The circulation contour was designed in a way to apply the largest available pressure decline very locally at the target cell right to the region of beam heating. To this end a low flow resistance hydrogen-helium heat exchanger was developed.
-
-
The target works well even without running the mechanical pump up to 120 watts heat load since an intensive natural convection driven circulation takes place in the loop. This regime is useful for applications when the density fluctuations do not play an important role.
-
-
The target gas system is simple and reliable. It contains only 5 m3 of hydrogen at 2.2 bar of absolute pressure. All safety requirements, conventional for the accelerator environment, are fulfilled and the target it inherently safe in case of a sudden loss of cooling.
In the following sections we explain our design approach, give a description of the target and present the results obtained.
2 Local beam heating and luminosity fluctuations
In this section we aim at an estimate of the luminosity fluctuations caused by temperature variations in the hydrogen stream. We try to reveal the essential parameters for the effective suppression of the fluctuations considering a primitive model of turbulence, since the exact treatment of fluid dynamics in the turbulent regime is difficult and would require detailed numerical simulations. The numerical estimates are based on an electron beam with 854.3 MeV energy and 35 A. It deposits a heating power of 160 W into the liquid hydrogen target. We assume a hydrogen flow in a tube coaxial with the electron beam. The diameter of the tube is 1.2 cm.
2.1 Estimation of local beam heating
Following Prandtl’s concept of turbulent mixing length [12] we have the space scale of turbulent local fluctuations as
| (1) |
where is an empiric constant and is the distance from a parallel wall to the flow direction. This corresponds to half of a tube diameter . In our case the resulting turbulent mixing length mm, which is of order or larger than the possible electron beam diameter in mm. We can also apply the concept of relaxation time of the turbulent transfer, that defines the time scale of turbulent fluctuations:
| (2) |
with the dynamic velocity , the friction coefficient , and the Reynolds number . In our case the relaxation time is in the region of several milliseconds. For example, for hydrogen of T=16 K and m/s the relaxation time results in ms. In this simple model any existing local fluctuation, for example temperature fluctuation , will exponentially dissipate with time as
| (3) |
The heating due to the electron beam occurs through Bethe-Bloch energy deposit at a constant specific volume energy deposition rate . Fluctuations of temperature arises from cold fluid entering the beam and dissipate as the heated mass is replaced by cold mass from the region outside the beam. For a static case, the temperature rise due to the beam heating is
| (4) |
where denotes the specific liquid hydrogen heat capacity and the hydrogen density. Combining this with Eq. 3, we get a time structure of the temperature fluctuations of
| (5) |
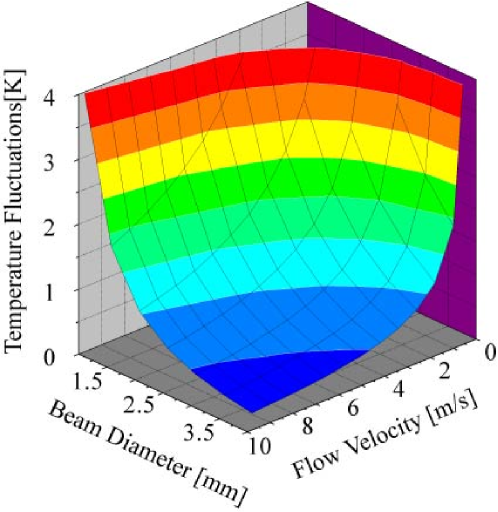
This function has a maximum at . This gives the amplitude of temperature fluctuations as
| (6) |
which drops with the beam size (due to ) and with flow velocity as shown at Fig. 1. An efficient heat transfer from the beam area takes place when both mm and m/s.
2.2 Luminosity fluctuations without boiling
Even without boiling, luminosity fluctuations can originate from target density fluctuations arising from temperature fluctuations. The scale of these fluctuations is given by the value of . An accomplishable value, is K, as one can see from Fig. 1. The corresponding relative luminosity variation amounts to
| (7) |
for 16 K hydrogen. This estimate is for a single turbulent fluctuation with size of order . In order to get an estimate of the overall luminosity fluctuations over the whole target length, we average the single fluctuations over the the beam volume containing a number of single fluctuations contributing to beam scattering during the integration time window ms. Since , the number of simultaneous fluctuations penetrated by the beam is , where is the target length of 10 cm. This value has to be integrated over , yielding
| (8) |
With the assumptions as stated above, the total luminosity fluctuations result in
| (9) |
This estimate for the luminosity fluctuations is of the same order as required by the experiment. It can be much larger if local boiling takes place.
2.3 Boiling at the aluminum windows
The electron beam deposits energy not only in the hydrogen volume, but also in the thin aluminum entrance and exit windows. This heating amount to 1.9 W for 0.1 mm of aluminum thickness which corresponds to a specific heat flow from the beam spot at the aluminum window of cm2 for beam diameter of mm. A more detailed analysis shows that the heat is not transferred directly to the liquid, but is spread over the aluminum window due to the aluminum heat conductivity. Nevertheless, the specific heat flow from the aluminum to the liquid hydrogen does not get below 5 W/cm2 to 10 W/cm2. This exceeds the first boiling crisis value ( W/cm2) [13] and causes unavoidable boiling around the beam spot in the hydrogen volume right at the aluminum window. It should be noted that at such a large value of the boiling regime is not stable in time. The wall temperature is also unstable and its average value is determined mainly by the heat spreading over the wall trough the bulk aluminum and can, in our case, reach a few ten degrees. This process does not depend much on beam size or on aluminum wall thickness. With increasing flow velocity its contribution to the luminosity fluctuations will be proportionally less.
2.4 Design criteria summary
We summarize the target efficiency parameters as they follow from our estimations which is a delicate problem down to the level of fluctuations of . We need a beam size of a few millimeters in diameter as an alternative to the method of beam rastering. The temperature of liquid hydrogen should be close to the freezing point in order to give several degrees of headroom to the boiling temperature. The cross section of the tube (nozzle), which guides the hydrogen stream along the beam, should be minimized. This minimum has to provide the necessary mass flow (a mass flow of 20 g/s gives a 1 degree rise of the bulk hydrogen temperature at 160 W heating power). The flow velocity has to be maximized. A limiting value is defined by the pressure drop in the nozzle. They are evaluated as a local pressure decline
| (10) |
with the coefficient . This is a central item for the design of the heat exchanger cooling system since it requires a careful optimization with respect to the flow resistance, which has to be small compared with the value given by formula 10 for the remaining parts in the hydrogen system.
3 Experimental setup
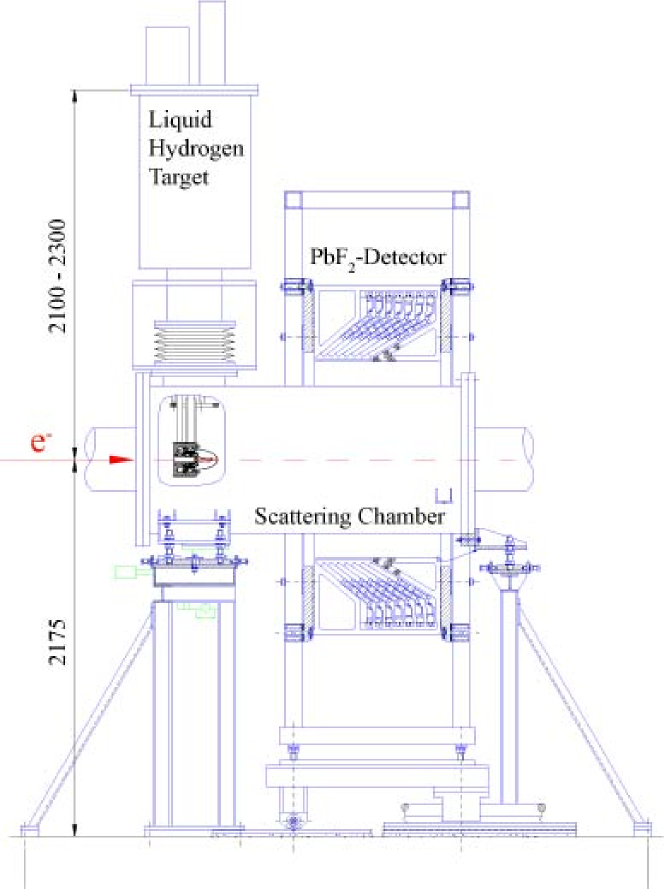
Fig. 2 shows the experimental setup. The electron beam enters from the left and hits the high power liquid hydrogen target in the vacuum vessel of the scattering chamber. The scattering chamber is surrounded by the large acceptance (0.64 sr) multichannel PbF2-detector that registers electrons in the electron scattering angle range of [9]. The luminosity is measured under small scattering angles of . The target cryostat is placed on an elevator system. The large elevator bellow allows a 20 cm expansion along the vertical axis in order to move the target in and out of the beam line. An adjustable incline of the axis under any azimuthal angle is possible, so that the target cell can be aligned.
4 The target cell
The axial symmetry of the detector which is required by the physics of the A4 parity experiment is also reflected in the liquid hydrogen target cell design.
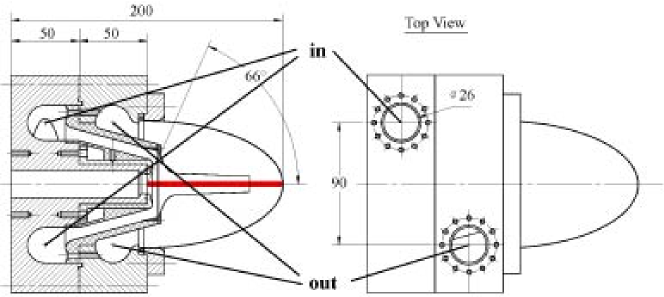
Fig. 3 shows the target cell design. The target consists of aluminum parts joined with an indium sealing, so that the target can be reassembled many times. The target thickness is limited to 10 cm for forward scattering experiments by the variation of the scattered electron energy. The liquid hydrogen fluid enters the toroid shaped collector. The hydrogen flow is directed into a nozzle of 12 mm diameter along the beam path, where the maximum flow velocity and the maximum degree of turbulence is reached. The fluid leaves the target cell through the exit collector. The aluminum entrance window has a thickness of 75 m. The large parabolic aluminum cap which contains the hydrogen has a regular wall thickness of about 250 m, but at the place of the beam exit it is thinned to 100 m. The nozzle walls are 200 m thick, so that a cone of up to 66∘ has a low thickness of material in the way of the scattered electrons. This construction has been tested up to 6 bar pressure in the cell against vacuum. The target cell is fixed through a thermally isolating bridge to the bottom cryostat flange in order to minimize mechanical vibrations and temperature variations.
The heating by the electron beam is concentrated in the small volume of the electron beam path. As the flow is directed along the beam axis, the only efficient mechanism of heat removal from this overheated volume is the turbulent transverse mixing, which is more efficient at higher velocity. This mechanism was considered in section 2. An even smaller nozzle diameter would enhance the degree of turbulence to such an extend, that the mass flow along the beam would drop too much. The nozzle cross section must be large enough to avoid additional background arising from scattered electrons at small scattering angles.
5 The target cooling system
5.1 Cooling principle
A schematic of the target cooling system is shown in Fig. 4.
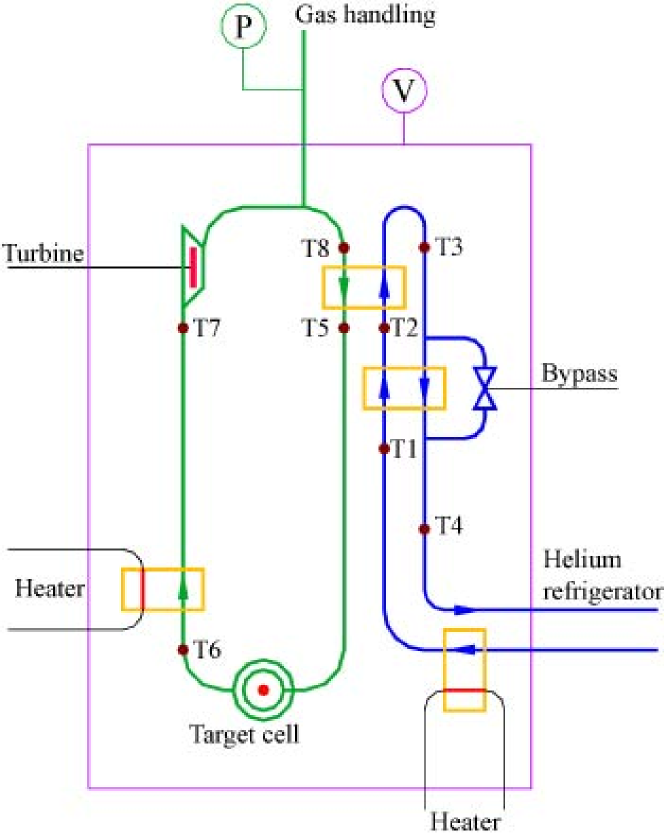
The system consists of a closed liquid hydrogen circulation loop and a cold helium gas cooling loop including a 400 watt Linde helium refrigerator. For the heat transfer from hydrogen to helium we use a counterflow heat exchanger, placed at the top of the hydrogen loop. The hydrogen target cell is located at the lowest point in the loop. The liquid hydrogen circulates clockwise driven by a tangential pump from the target through the pump to the heat exchanger top. After cooling in the heat exchanger it flows again to the target. In order to stabilize the total heat load of the refrigerator a temperature controlled electrical heater is added in the loop right behind the target. This provides a stable operation at variable electron beam currents and provides a heat load even in case the beam is turned off. The loop hight is about 2 m. For safety reasons, the hydrogen loop is always connected to an external gas tank of 5 m3 at room temperature. The hydrogen system in total contains, including the gas tank, an amount of hydrogen corresponding to 2.2 bar of absolute pressure at room temperature. When the helium temperature gets below the hydrogen boiling point, the heat exchanger works as a liquifier until the loop is completely filled with liquid hydrogen. The loop volume of liquid hydrogen is about 5 l, therefore the pressure in the system drops to 1.2 bar. When the liquid covers the heat exchanger completely, it will be cooled down further to helium temperature since the condensation process stops. When there is no cooling the liquid is naturally evaporated filling the buffer gas tank back to the 2.2 bar. There is an additional electrical heater in the helium loop, in order to maintain the temperature level of incoming helium at an appropriate level. In the helium-helium heat exchanger incoming cold helium gas is heated by warm Helium, coming from the helium-hydrogen heat exchanger. The additional helium-helium heat exchanger, controlled by a bypass valve, allows further regulation of the temperature at the working point without changing the load on the helium refrigerator. This is especially useful when deuterium is used instead of hydrogen. The system has eight temperature sensors. It is controlled by a computer with an interface card having analogue to digital converters (ADC) and digital to analogue converters (DAC). Two modes of operation are possible. A soft mode, where the control system regulates only the power of the helium heater to keep the incoming helium temperature T2 right above the hydrogen freezing point (15 K). It is convenient for automatic target cool-down and for operation in natural convection mode. When operating with the electron beam on the target, the control system regulates both the power of the hydrogen heater (T8 is kept stable) and the incoming helium temperature T2.
5.2 Natural convection
The hydrogen loop has been optimized to provide the conditions for a hydrogen circulation based on natural convection driven by the density differences of cool and hot hydrogen liquid. For many target applications this regime is quite sufficient. It is known [14], that optimized natural convection can provide significant heat removal, up to a few kilowatts of power. For the optimization high flow resistance parts in the loop have been removed such as pipe bends, sharp changes of cross sections and so on. As a result of this approach about 2/3 of the total pressure loss along the whole loop comes from the target cell. For natural convection the difference of static pressure between cold (on the right side) and warm (on the left) loop branch should be compensated by the dynamic pressure loss over the whole circulation loop. The static pressure difference can be calculated from the density difference
| (11) |
where m/s2 and m is the loop height. The maximum of is achieved when the hydrogen temperature in the cold branch is close to freezing temperature and the warm branch is close to boiling temperature. From this follows that is of order 1 mbar and 2/3 of that have to be applied in the nozzle. This corresponds to a local pressure loss caused mainly by narrowing of the stream before and its expansion after the nozzle. It is proportional to the square of the flow velocity according to formula 10. With a 12 mm nozzle diameter we achieve a flow velocity of m/s and a hydrogen mass flow of g/s. These values provide a stable operation of the target in natural convection mode, but they are not sufficient to suppress luminosity fluctuations down to the required level of . Operation with a mechanical tangential pump gives a significant improvement since the possible pressure drop increases due to a pump about 300 times reaching 0.3 bar. A sufficiently high velocity of 15 m/s, as estimated from
| (12) |
and a mass flow of 130 g/s is possible in this case.
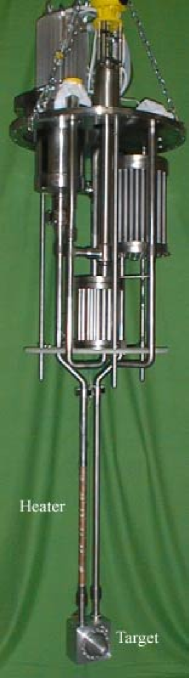
5.3 Construction design of the hydrogen loop system
The liquid hydrogen loop and target cooling system is incorporated in one cryostat with all inputs going through a top flange. Fig. 5 shows a photograph of the inner part of the cooling system without the super isolation. The photograph corresponds to the elements in the diagram of Fig. 4. The target cell at the bottom of the picture is connected on the left side to the hydrogen turbine and on the right side to the main hydrogen-helium heat exchanger located right under the top flange. This heat exchanger consists of 78 tube-in-tube elements with total heat transfer surface about m2. The helium-helium heat exchanger in the center is smaller. It contains 32 short tube-in-tube elements. The total height of the loop is about 2 m, the top flange diameter 0.6 m. The hydrogen target cell is made from aluminum, all other parts are made from stainless steel. Joints are made using conflat flanges with copper gaskets unless welded. The system is fixed to the top flange by the cold valve body, attached to the helium-helium heat exchanger top collector. All thermal length changes are compensated by bellows.
As a hydrogen pump (on the left of the main heat exchanger) we use the Barber-Nichols tangential pump BNHeP-15-000 giving a closed pressure difference of 0.3 bar. It has originally been designed for high flow rate (up to 600 g/s at 100 Hz) transfer of liquid helium. We run the pump at a rotation speed of 70 Hz. We estimate the heating of the hydrogen by the pump as W corresponding to about half of the total parasitic heat load of the system. The additional liquid hydrogen volume required by the tangential pump corresponds to about 1 l. The turbine can be substituted by a short piece of tube if only the natural convection mode is needed. A 400 watt Linde helium refrigerator is available for target cooling. It produces a flow of cold helium gas at a temperature of 7-11 K. Helium transfer lines of 18 m length deliver the coolant to the experimental hall. The helium mass flow is about 6-8 g/s. Though the nominal refrigerator power is rather high, it cannot be utilized for the hydrogen system because of the poor mass flow. That puts currently limit on the cooling power of below 250 W, though the cooling system design allows to use a helium mass flow of up to 30 g/s providing a possible cooling power of up to 1000 W. The heat exchanger design allows freezing of the liquid in it without safety hazard. This is important as the input helium temperature can be safely reduced to 12 K and below.
6 The gas system
Fig. 6 presents an operational flow diagram of the complete hydrogen target system.
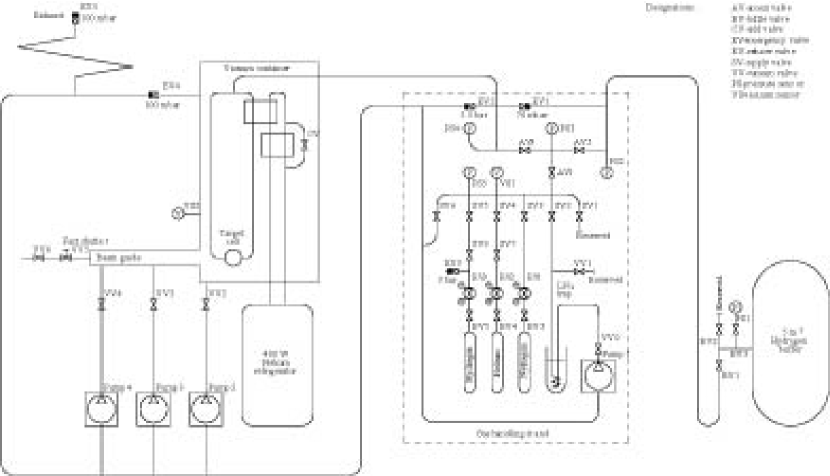
The cryogenic part is located in the vacuum container formed by the target cryostat united with the scattering vacuum chamber and the attached beam guide. The cold hydrogen loop is connected to the 5 m3 hydrogen gas buffer tank through the gas handling stand. For the standard operation of the cold target the valves AV2, AV3 and BV1 have to be open providing a free transfer of hydrogen between the cold part and the buffer tank. This connection is ensured by a one-way release valve EV1. Access to the hydrogen system with vacuum pump and various gases for its preparation and filling is achieved from an access valve AV1. The safety valve EV2 prevents overfilling of the system by venting the hydrogen to the exhaust line on the building roof. The vent tube is kept filled with nitrogen gas that is trapped at its far end by 100 mbar release valve EV5 in order to keep the line always free of oxygen from air. In the case of a target crash the beam guide will be closed by the fast shutter valve VV5 preventing hydrogen from entering the high power microwave system of the accelerator. In the case of hydrogen escape to the experimental hall two hydrogen sensors control a special venting procedure of the experimental hall.
7 Target control
The target control system includes the readout of all the operation parameters (16 input channels), the control of two feedback loops for regulating the helium and the hydrogen heater power, and the control of the cold helium bypass valve. The scheme is realized with a computer interface card DAP 2400e/5 board of Microstar Laboratories. The board is controlled by DIGIS software on a single PC. The helium refrigerator has an independent automatic control and readout. The temperature sensors (see Fig. 4) are standard silicon diode sensors, except , which is a carbon glass resistor. This type of sensor has a high radiation resistance, which is necessary for the a temperature sensor located near to a target cell.
8 Test results
8.1 Tests with the electrical heater in the hydrogen circuit
In order to commission the hydrogen target cooling system we operated the system after liquifying the hydrogen gas without the electron beam, only using the electrical heater in the hydrogen loop. All target cooling system parameters like the temperatures, the heating power of both heaters, the valve positions etc. (as displayed in Fig. 4) have been measured during the tests. The efficiency of the hydrogen heater is 100 % i.e. all the electrical power is transferred to the hydrogen liquid. It simulates the global heat load of the electron beam.
For a high heat load of 250 W the highest temperature in the system T8 behind the target rises 19.7 K which is still about 1.3 K below the boiling point of hydrogen. The target entrance temperature T5 for this high heat load is 18 K corresponding to 3 K subcooled hydrogen. For working conditions corresponding to a more realistic heat load of 100 W and the tangential pump rotation frequency to 50 Hz, the maximum system temperature T8 settles at 17.3 K. The target entrance temperature T5 stabilizes at 16 K corresponding to 5 K subcooled hydrogen. These first tests show rather quantitatively, that the target can be operated at the working conditions of the A4 experiment.
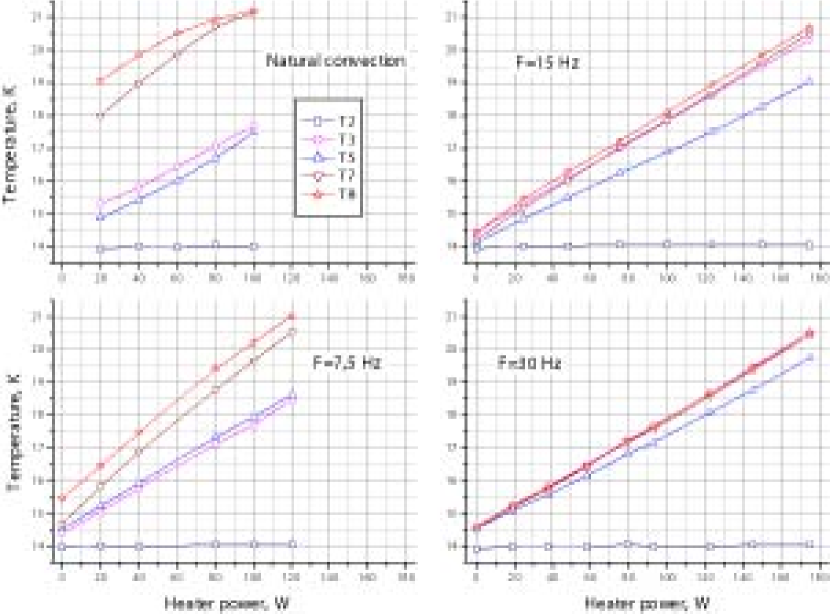
In order to determine the efficiency of the hydrogen-helium heat exchanger we have studied the temperature variation in the system for different tangential pump rotation speeds (corresponding to different values of the hydrogen mass flow) as a function of the electrical heater power. The four plots in Fig. 7 show the results for T2, T3, T5, T7, and T8 for natural convection (lowest mass flow rate), tangential pump speed of 7.5 Hz, 15 Hz, and 30 Hz. T2 has been stabilized to 14 K for all four pump speeds. T2 corresponds to the helium inlet temperature of the hydrogen-helium counterflow heat exchanger and T3 corresponds to the helium outlet temperature (see Fig. 4) whereas T8 corresponds to the hydrogen inlet temperature and T5 to the hydrogen outlet temperature. The difference THe=T3-T2 is proportional to the cooling power at constant helium mass flow. One sees that for all four mass flow values the helium cooling power ( which is proportional to THe) varies linearly with the electrical heater power. Only for the case of natural convection, the difference shows nonlinear behavior due to the fact, that the mass flow for natural convection is a function of the temperature. The difference of T8-T7 is proportional to the heat deposition coming from the tangential pump. When the heater is off, T degree that corresponds to about 15 W of parasitic heating. This parasitic heating is sufficiently small and does not distinctly depend on the pump speed. The outlet helium temperature T3 linearly rises as the heating power approaches the hydrogen boiling temperature ( 21 K) at about 200 W. The Helium is heated by hydrogen, therefore the inlet hydrogen temperature T8 is always higher than the outlet helium temperature T3. The data for 30 Hz pump speed show a very efficient heat transfer since T8T3. The efficiency becomes worse as the speed reduces. In case of natural convection the difference T8-T3 arrives at about 3 degree being almost independent from the heater power. The maximal hydrogen temperature depends on the outlet helium temperature which is, in its turn, defined by the helium mass flow. The temperature T5, at which hydrogen comes into the target cell, is limited by T8. This test with the heater demonstrates that the target cooling loop performs like expected from our estimates based on simple fluid dynamics rules. The overall performance of the target cooling loop is currently limited only by the available helium refrigerator.
8.2 Tests of the target cooling system with the MAMI 85 MeV electron beam.
8.2.1 Influence of Hydrogen Mass Flow and Temperature on the Target Density Fluctuations
We have studied the target density fluctuations in the liquid hydrogen target by hitting the hydrogen target cell with the MAMI 854.3 MeV electron beam [15] at different target cooling system conditions.
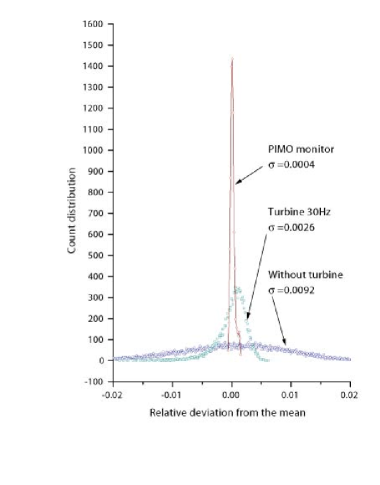
For these tests we have measured the luminosity (which is the product of electron beam current and target density) with a system of water Cherenkov detectors detecting electrons from Møller scattering at electron scattering angles 4.4∘ 10∘ [16]. We have measured the electron beam current simultaneously. During the tests, the cross section of the electron beam has been kept small with an approximate size of 3 104 m2. In Fig. 8 we show on overlay of three histograms. The peak labeled “Without turbine” shows the distribution of the luminosity signal for the case where the tangential pump was not rotating and the loop was circulating in natural convection mode with low mass flow. The measured normalized RMS for this case amounts to = = 0.0092. The peak labeled “PIMO monitor” shows a histogram of the beam current monitor signal. The normalized RMS of the beam current for this measurement has been = = 0.0004 which is a factor 23 smaller than the luminosity fluctuations, showing that the observed luminosity fluctuations arise to a high extend from target density fluctuations only. The peak labeled “Turbine 30 Hz” shows the luminosity distribution for the case when the tangential pump was running at 30 Hz giving a higher hydrogen mass flow. The effect of the turbulent mixing in the hydrogen target cell leading to a higher effective heat transfer can be clearly seen,
since the normalized RMS of the luminosity distribution with high mass flow is = = 0.0026 corresponding to a factor of 3.5 decrease in the width of the target density distribution. We have made more tests varying the pump rotation speed and the beam current. Fig. 9 shows some of the results. One recognizes that the normalized RMS of the target luminosity varies from = = 0.032 at 30 A
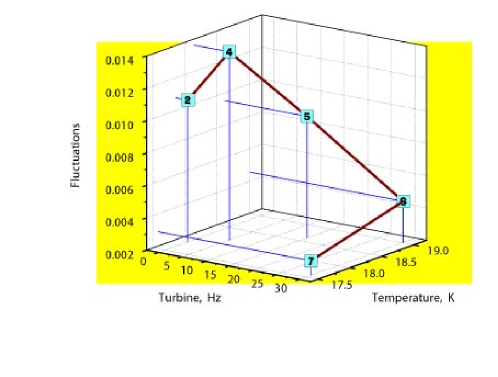
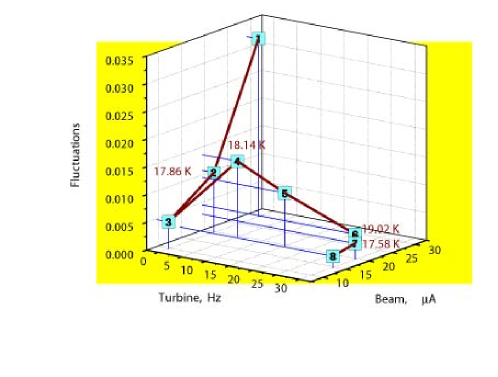
and low mass flow (natural convection mode) to a value of = = 0.0023 at high hydrogen mass flow and 20 A electron beam current corresponding to an improvement of a factor of 14 due to the turbulent mixing of cold and warm hydrogen in the target cell caused by the higher mass flow. We studied the target density fluctuations at 20 A in more detail since the working point of the A4 parity violation experiment at the MAMI electron accelerator in Mainz corresponds to an electron beam current of 20 A. The results of those measurements are shown in Fig. 10. As expected, the target density fluctuations diminishes with the hydrogen mass flow (tangential pump speed) due to higher degree of turbulent mixing in the target cell. The observed decrease of the fluctuations with the hydrogen temperature is also expected since the temperature difference of the hydrogen to the boiling point temperature is larger corresponding to more subcooled hydrogen.
8.2.2 Influence of Electron Beam Cross Section and Exact Beam Position
As estimated in Sec. 2 the size of the cross section of the electron beam should have an essential influence on the target density fluctuations. Fig. 11 shows the the measured absolute fluctuations over a running period of about 1000 hours of 854.3 MeV electron beam as a function of the run number. There are two regions in Fig. 11, which are separated by the vertical dashed line at run 6600. For the runs up to run 6600, we tried to widen the electron beam diameter or electron beam cross section. The change of the electron beam diameter on the target position
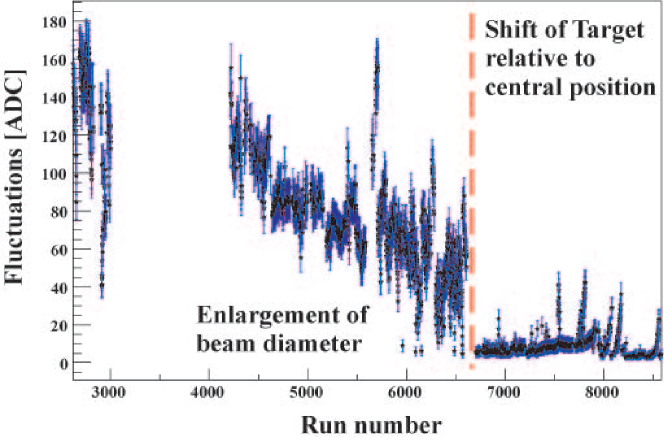
is not straightforward, since besides the beam diameter on the target other beam parameters like divergence, energy stability, helicity correlated position and angle fluctuations and also the beam tune in the accelerator have to be optimized at the same time. Over the running time of a few months, we were able to continuously increase the beam diameter of the electron beam on the target by studying the beam tune in the electron accelerator and in the beam optics of the focusing and bending magnets in the beam line to our accelerator hall. The effect of continuously widening the beam cross section can be be seen in Fig. 11 between run 2800 and run 6600
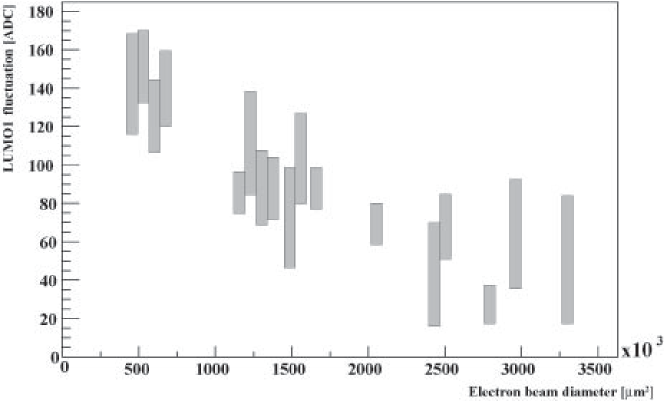
where one recognizes a steady decrease of the measured absolute fluctuations which is caused by the increase of the beam diameter over the time of the runs. In order to verify this, the measured absolute fluctuations are plotted as a function of the measured area of the elliptical beam cross section in Fig. 12. On can clearly recognize a correlation between the measured fluctuations and the size of the beam area. A further reduction of the target density fluctuations was possible after we found, that there is a cool spot on the entrance or exit window of the target cell. When we move the electron beam 1 mm vertically out of the center of the target cell, the measured fluctuations decrease by an additional factor of 4-8 as can be seen in Fig. 11 after run 6800. This can be explained tentatively by the nonsymmetric flow of the hydrogen inside the target cell, since right at the axis of symmetry all transversal directions of movement are equivalent to each other. This leads to a suppression of transversal movement and forms dead zones at windows. The asymmetric inlet in the target cell causes a rotation of the hydrogen stream around the axis of symmetry, that is a transversal velocity component. When the beam is moved from the axis of symmetry, we see the effect of this rotation on heat removal. The
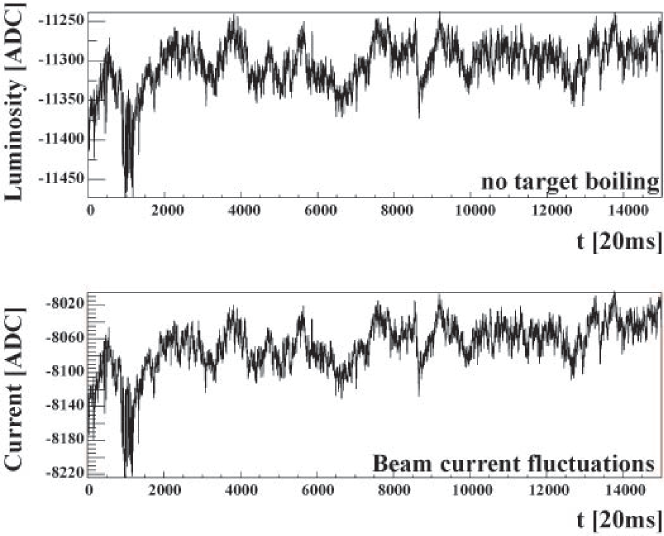
resulting low level of residual target density fluctuations can best be illustrated by the two plots in Fig. 13. The upper plot shows the luminosity monitor signal of the water Cherenkov monitor at small scattering angles downstream the hydrogen target as a function of time in units of 20 ms integration gates. The lower plot shows the signal of the electron beam current RF-cavity monitor in the accelerator beam line 3 m upstream the hydrogen target. The luminosity signal follows even in details the electron beam current signal which means that the contribution of target density fluctuations to the observed luminosity fluctuations is very small. A quantitative result on the luminosity fluctuations in the 20 ms of the integration time window can be yielded from a correlation analysis of the PIMO and LUMO signals of Fig. 13.
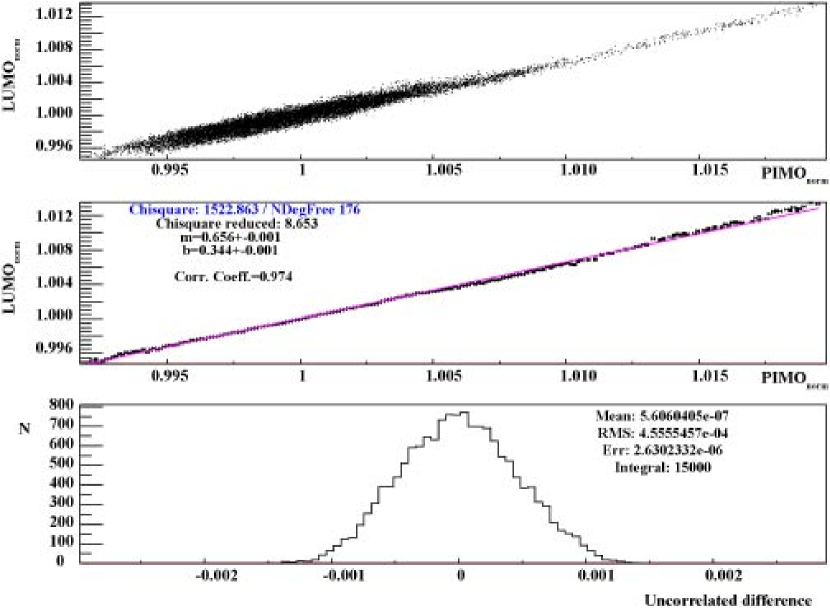
which is shown in Fig. 14. The upper graph shows a scatter plot of the data from Fig. 13. The luminosity monitor # 5 is for this plot normalized to its mean value as well as the current monitor signal PIMO, which is normalized to its mean value too. The linear correlation arises from electron beam current variations during this run. The width of the band of points in the scatter plot is a measure for the individual fluctuations of the monitors either due to their intrinsic noise or due to residual target density fluctuations. A linear fit to the averaged data (middle plot) is used to disentangle the correlation due to beam current fluctuations. For each point in the upper plot the closest difference of the data points to the straight line fit is calculated. These histogrammed differences are shown in the lower plot. The width of this histogram is the independent (quadratic) sum of the three contributions: a) the intrinsic noise of the current monitor PIMO (), b) the intrinsic noise of the luminosity monitor LUMO , and c) the residual target density fluctuations (). The observed RMS of the histogram of the normalized differences (lower plot) in Fig. 14 is . If the intrinsic noise of both PIMO and LUMO monitor would be zero, would directly correspond to the residual target density fluctuations. The intrinsic noise of the luminosity monitor can be determined by applying the same method as in Fig. 14 to the pair of luminosity monitors # 5 and # 6 to . The intrinsic PIMO noise can be determined similarly by combining PIMO # 27 with PIMO # 08 in the beam line further upstream to . The residual target density fluctuations within the integration time window of 20 ms can be calculated from
| (13) |
to corresponding to in the data taking run time of five minutes.
9 Summary
We have designed a new cryogenic liquid hydrogen target system for the A4-Experiment at the MAMI accelerator in Mainz. The special requirements posed by the smallness of the measured parity violating cross section asymmetry of order 10-6 has put special demands on the design and construction of the target cooling system. We have chosen the new approach which uses a high turbulent flow in the target cell in order to enhance the transverse mixing of the cold target liquid and thus enhancing the transverse heat transfer. This new approach allows in combinations with an enlarged beam spot slightly off center on the target to abandon rastering of the narrow beam spot on the target cell. In tests with and without electron beam we have been able to reduce the target density fluctuations from a factor 23 larger then the electron beam fluctuations to negligibly lower than the electron beam fluctuations. We plan on further parity violation measurements including the use of deuterium and a cell with 20 cm length at backward angles. The stability and the low level of target density fluctuations of the liquid hydrogen target as it has been presented in this paper has shown to fulfill the high demands of a parity violation experiment.
10 Acknowledgements
This work has been supported by the Deutsche Forschungsgemeinschaft in the framework of the SFB 201 and the SPP 1034. We are grateful to V. Lobashev for useful discussions and participation in a very early state of the experiment.
References
- [1] E. J. Beise et al., A high power liquid hydrogen target for parity violation experiments, Nucl. Instr. and Meth. in Phys. Res. A 378 (1996) 383.
- [2] D. T. Spayde, et al., The strange quark contribution to the proton’s magnetic moment, Phys.Lett. B583 583 (2004) 79.
- [3] K. A. Aniol et al., Parity violating electroweak asymmetry in polrized e--p scattering, Phys. Rev. C 69 (2004) 065501.
- [4] P. L. Anthony et al., Observation of parity nonconservation in møller scattering, Phys. Rev. Lett. 92 (2004) 181602.
- [5] F. E. Maas et al., Measurement of strange quark contributions to the nucleon’s form factors at =0.230 (gev/c)2, Phys. Rev. Lett. 93 (2004) 022002.
- [6] F. E. Maas et al., Measurement of the transverse beam spin asymmetry in elastic electron proton scattering and the inelastic contribution to the imaginary part of the two-photon exchange amplitude, Phys. Rev. Lett. 94 (2005) 082001.
- [7] F. E. Maas et al., Evidence for strange-quark contributions to the nucleon’s form factors at =0.108(gev/), Phys. Rev. Lett. (2005) in print.
- [8] F. E. Maas et al., Parity violating electron scattering at the mami facility in mainz: The strangeness contribution to the form-factors of the nucleon, Eur. Phys. J. A 17 (2003) 339.
- [9] F. E. Maas et al., Proc. of the ICATPP-7, World Scientific, 2002, p. 758.
- [10] K. Aulenbacher et al., The mami source of polarised electrons, Nucl.Ins.Meth.A 391 (1997) 498.
- [11] P. Achenbach et al., measurements and simulations of cerenkov light in lead fluoride crystals, Nucl. Instrum. Meth. A 465 (2001) 318.
- [12] W.Frost, T.H.Moulden, Handbook of Turbulence, Plenum press, 1977.
- [13] J. W.G.Fastowski, A.E:Rowinski, Kryotechnik, Akademie-Verlag Berlin, 1970.
- [14] A. I.S.Altarev, V.A.Mityukhljaiev, A.A.Zakharov, Cold and ultracold neutron sources in gatchina, russia, Journal of Neutron Research 1 (4) (1993) 71.
- [15] H. Euteneuer et al., Beam measurements and operating experience at mami, Proc of the EPAC (1994) 506.
- [16] T. Hammel et al, A luminosity monitor for the a4 parity violation experiment at mami, to be submitted to Nucl. Instr. and Meth. A .