Measurement of the reaction at photon energies up to GeV††thanks: This work is supported in part by the Deutsche Forschungsgemeinschaft (DFG) (SPP KL 980/2-3)
Abstract
The reaction was measured in the photon energy range from threshold up to 2.6 GeV with the SAPHIR detector at the electron stretcher facility, ELSA, in Bonn. Results are presented on the reaction cross section and the polarization of the as a function of the kaon production angle in the centre-of-mass system, , and the photon energy. The cross section is lower and varies less with photon energy and kaon production angle than that of . The is polarized predominantly at . The data presented here are more precise than previous ones obtained with SAPHIR and extend the photon energy range to higher values. They are compared to isobar model calculations.
pacs:
PACS-keydescribing text of that key and PACS-keydescribing text of that key1 Introduction
Hadronic final states produced in hadron- or photon-indu-
ced reactions on nucleons at low energies are investigated with
respect to production mechanisms, in particular to the formation of
baryonic resonances which decay into hadrons. Most of the known nucleon
and delta resonances were discovered in this way. However, model
calculations (theory1 , theory2 ) predict more resonant
states than have been observed in experiments so far. Some of the missing
non-strange resonances are predicted to decay into final states comprising
strange particle pairs.
The SAPHIR experiment has measured such final states. Results on the reactions
and were
published elsewhere Glan03b . Here we report about the reaction which adds another
isospin configuration of the final state.
Results on based on 30 million triggers
from earlier data taking with SAPHIR were published Goers99 .
The new results presented here are based on 180 million triggers which were taken
with an upgraded SAPHIR detector setup in an extended photon energy range from
reaction threshold up to 2.6 GeV. This measurement of cross sections is more reliable
than the previous one, since it has been found that, in the previous analysis, background
from other reactions was underestimated and not sufficiently eliminated from the event
sample of the reaction . In the current analysis this
background has been removed thoroughly. The new cross sections show systematically lower values.
The data are available via internet.111http://saphir.physik.uni-bonn.de/saphir/publications
2 The experiment

Data were taken with the magnetic multiparticle spectrometer SAPHIR Schwille at
the 3.5 GeV electron stretcher facility ELSA Husmann . The setup is shown
schematically in fig. 1. An extracted electron beam of 2.8 GeV was directed
on a radiator target to provide an energy-tagged photon beam within the range from
0.868 to 2.650 GeV. The data taking was based on a trigger defined by a coincidence of
signals from the scattered electrons in the tagging system with at least two charged
particles in the scintillator hodoscopes and no signal from a beam-veto-counter downstream
of SAPHIR which detected non-interacting photons.
The drift chambers served to measure charged particles. The scintillator hodoscopes
were used for time-of-flight (TOF) measurements which allowed together with the track
momentum (measured with the drift chambers in the magnetic field) to calculate
the particle masses.
The experimental set-up of SAPHIR was upgraded for this data taking. A new tagging system
tof with improved energy resolution and extended electron energy range was installed.
A planar drift chamber was added to the central drift chamber which improved the track
reconstruction in forward direction Glan03a . The data analyzed here stem from four
data taking periods in 1997 and 1998.
3 Event reconstruction and event selection
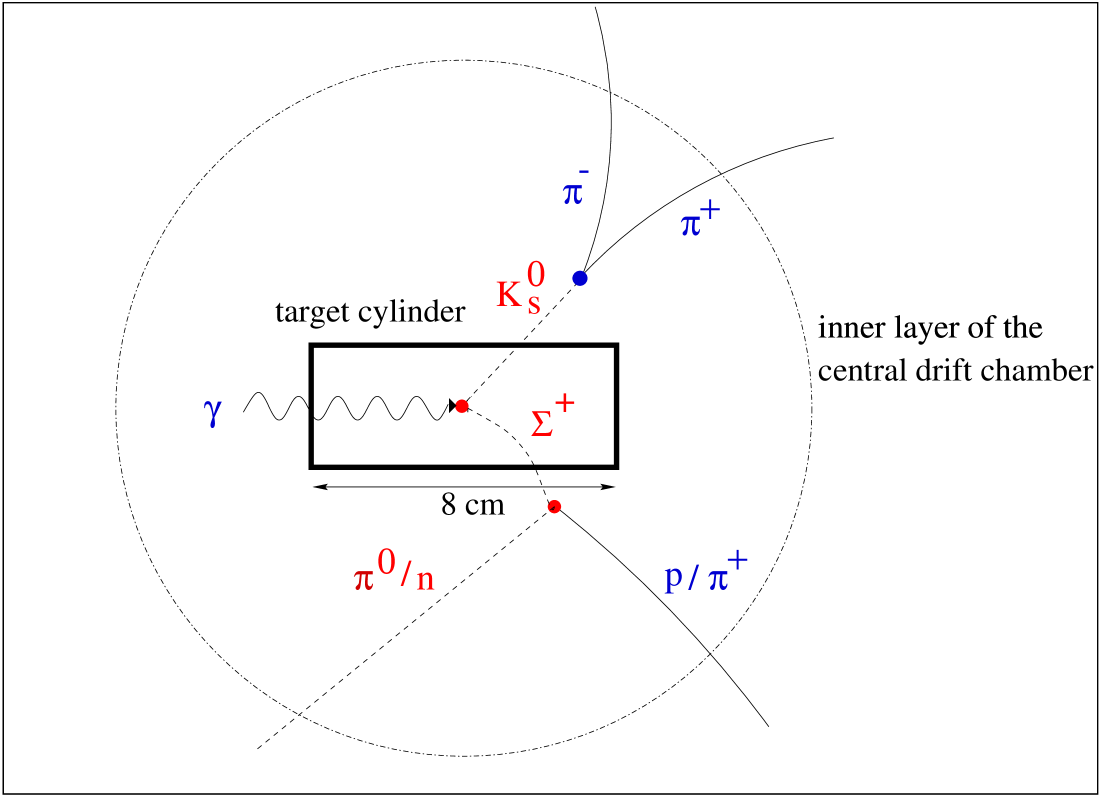
The events of the reaction were reconstructed from the measurement of the charged decay products from , and respectively (see fig. 2).
The measured 3-momenta of the positively and negatively charged particles together
with the incident photon energy (measured in the tagging system) provided all the information
needed to reconstruct the complete event topology and to determine the 3-momenta of
the unmeasured particles, i.e. , and the neutral decay particle
or , respectively, by kinematical fits.
First the unmeasured decay was reconstructed by extrapolating two tracks of
opposite charge back to the decay vertex. Using the energy
measurement of the incident
photon and the reconstructed 3-momentum of the candidate a kinematical fit
was carried out assuming the primary reaction
which yielded the momentum of the missing .
In the next step the primary vertex and the decay were reconstructed
simultaneously by an iterative method that was already described in a previous
publication Goers99 . The positively charged track
(not belonging to the candidate) and the track at the decay vertex
allowed to reconstruct the four-momentum of the neutral decay particle or ,
respectively.
An event was accepted if it was successfully fitted to the kinematics of the complete
reaction while the assigned charged particle masses were consistent with the TOF-measurements
or undetermined (for tracks which were outside the geometrical acceptance of the hodoscopes
or had no signal due to hodoscope inefficiencies).
The reconstructed decay time distributions of and are shown in
figs. 4 and 4 respectively.
Monte-Carlo simulated events assuming the proper lifetime are also drawn.


The comparison indicates that there is a substantial excess of background
from other reactions mainly at low decay times for and at a
smaller scale at large decay times for . In order to reduce this background
the event sample was restricted to and
.
These cuts were not sufficient to remove the falsely included events completely. In
particular, the main background reactions and
were still present in the accepted ranges of the decay times of
and according to the limited spatial resolution of the decay
vertices.
Since such background events must have a common vertex formed by three charged tracks,
corresponding background reactions were simulated (see sect. 5)
and studied with respect to the probability of the vertex fit.
The dependence of the reaction cross section
from a cut on this probability after all other selection cuts is displayed
in fig. 5 (total distribution). The light grey area
represents the estimated total background
from other reactions (see table 1 in sect. 5).
Events with a vertex fit probability bigger than were removed both in
data and simulated background events.
The cut was chosen so that
the background contribution to the cross section was at most about on average.
The final cross section (dark grey area) was obtained by subtraction of
the accumulated background events (see sect. 6).

The following plots display the final data sample after all cuts: fig. 7 depicts the invariant mass distribution of the system at the kaon decay vertex corresponding to the mass, and the missing mass distribution calculated at the primary vertex, corresponding to the unmeasured signal. In fig. 7 the squared missing mass distributions at the decay vertex are shown, corresponding to and , respectively. The missing mass at the primary vertex was calculated from the 4-momenta of the incident and the reconstructed assuming the reaction . The missing mass squared at the decay vertex was calculated from the 4-momenta of and /, respectively.


(a) , (b) for (see text).
4 Acceptance of the events
The acceptance was determined by means of Monte-Carlo simulations. Events of the reaction were generated according to phase space with propagation of both particles according to their lifetimes and the decays and /. Charged particles in the final state were tracked through the drift chamber system of the SAPHIR detector taking into account the magnetic field and multiple scattering in all materials of the detector setup passed by the particles. Simulated events were treated like real events. The determination of the acceptance comprised the trigger efficiency of the data taking periods, the event reconstruction efficiency and the data reduction according to the event selection cuts. The acceptance was on average varying between and throughout the kinematical range spanned by the complete production angular range in the CMS and the photon energy range of the data.
5 Background from other reactions
In order to estimate possible background contributions the reactions listed in
table 1 were simulated according
to phase space assuming a dependence in the photon energy range of the data
and processed like real data through the reconstruction and selection procedure.
The acceptance of background of events falsely selected as
and the estimates of their contributions in terms of cross sections obtained on average
after all cuts are shown in Table 1. The errors of the cross
sections (last column) are in the order of or less.
The background contributions were also quantified in bins of the photon energy and the
production angle. The reactions and
contribute preferentially at low energy and
in backward direction in the center of mass system. To give an example,
fig. 8 shows simulated events of
which were falsely accepted as events from the reaction in
the analysis procedure, distributed in the - plane. The numbers
of events were weighted by multiplying with to enhance the
rare events at high .
Smaller, but non-negligible contributions stem from the reactions
which contribute preferentially at higher energies and
towards higher production angles (not shown).
For subtracting the background as a function of the photon energy and the production
angle the sum of the contributions of all the reactions was taken into account bin-by-bin
(see sect. 6).
| Reaction | () | () | () |
|---|---|---|---|
| - | 0.0002 | 0.0032 | |
| - | 0.0062 | 0.0503 | |
| - | 0.0031 | 0.0090 | |
| 0.0100 | 0.0014 | ||
| 0.0110 | 0.0016 | ||
| 0.0100 | 0.0014 | ||
| 0.0060 | 0.0003 | ||
| 0.0030 | 0.0009 | ||
| 0.0010 | 0.0003 | ||
| Total | 0.0684 |

6 Results
The final event sample of the reaction consisted of 3310 events, 2114 with the
decay and 1196 with the decay .
For each data taking period, cross sections were determined in bins of the photon energy,
, and of the production angle in the center-of-mass system,
. They were calculated separately for both decay modes taking
into account the branching ratios. The cross sections obtained were found to be consistent
with each other.
Background contributions to the cross sections stemming from other reactions
(see sect. 5) were also determined separately for each data taking period
using the same binning. The errors were calculated by quadratic addition of the statistical
errors and the assumed normalization uncertainty of (see sect. 5).
Fig. 9 shows as an example the distributions of the measured cross section of
corrected for the branching ratios of and
decays and the estimated background from
and in the photon energy range
between and GeV.
The accumulated background contributions were subtracted bin-by-bin separately for each data
taking period. The errors of the subtracted cross sections were calculated by quadratic addition
of the single errors.

Finally, the cross sections were calculated as statistically weighted means of the subtracted
cross sections of the four data taking periods. Two sorts of errors were calculated:
at first the statistical error of the weighted mean of the four measurements,
, and secondly the standard deviation of the four measurements from the weighted
mean, . In case it was assumed that the error
accounts for systematic uncertainties in the run conditions which were not properly taken into
account in the simulation. The larger of the two errors was accepted as total error. A more
detailed discussion of the error calculation can be found in Glan03a , Lawall .
Differential cross sections after subtraction are shown in fig.10. The
corresponding values are given in table 2.
The reaction cross sections as a function of the photon energy were obtained by
summing up the differential cross sections over the angular range. Errors were determined
by quadratic addition of the single errors in the angular bins. The results are shown in
fig. 11 and table 3. Previous measurements Goers99 , ABBHHM69
are also shown.
The cross sections from the previous data set taken at SAPHIR Goers99 are
to higher than the current results. Careful investigations carried
out in the course of the new analysis have shown that background, in particular from
, had not been removed sufficiently in the analysis
of the first data set and moreover the error calculations did not account sufficiently
for this uncertainty.
The polarization of the -hyperon has been measured through its parity-violating
weak decay. The angular distribution of the decay nucleon is given by LeeGatto :
where is the asymmetry parameter which is equal to for
and for
PDG . The parameter P measures the hyperon polarization and is the decay
angle of the nucleon measured with respect to the normal to the production plane of
and in the rest system.
P has been determined by fits to the polarization angular distribution for the decay mode
as a function of for photon energies
below and above GeV. This decay mode is more sensitive than
due to the larger asymmetry parameter. The values of are shown in fig. 12
and table 4 together with the previous measurement at SAPHIR Goers99 .
The error bars refer to and respectively as described above.


(b) above GeV.
| (GeV) | ||||
|---|---|---|---|---|
| 1.050 - 1.150 | 1.150 - 1.250 | 1.250 - 1.350 | 1.350 - 1.450 | |
| -1.0 -0.8 | 0.040 0.015 | 0.054 0.019 | 0.038 0.025 | 0.012 0.013 |
| -0.8 -0.6 | 0.016 0.009 | 0.046 0.014 | 0.066 0.015 | 0.022 0.014 |
| -0.6 -0.4 | 0.009 0.015 | 0.033 0.023 | 0.034 0.011 | 0.032 0.016 |
| -0.4 -0.2 | 0.011 0.012 | 0.032 0.020 | 0.038 0.016 | 0.062 0.016 |
| -0.2 0.0 | 0.010 0.006 | 0.033 0.013 | 0.057 0.017 | 0.057 0.020 |
| 0.0 0.2 | 0.006 0.005 | 0.035 0.011 | 0.038 0.011 | 0.062 0.010 |
| 0.2 0.4 | 0.007 0.006 | 0.013 0.016 | 0.033 0.010 | 0.052 0.010 |
| 0.4 0.6 | 0.013 0.006 | 0.021 0.008 | 0.028 0.010 | 0.059 0.009 |
| 0.6 0.8 | 0.022 0.009 | 0.035 0.016 | 0.039 0.020 | 0.054 0.009 |
| 0.8 1.0 | 0.028 0.011 | 0.054 0.010 | 0.081 0.012 | 0.053 0.027 |
| (GeV) | ||||
|---|---|---|---|---|
| 1.450 - 1.550 | 1.550 - 1.650 | 1.650 - 1.750 | 1.750 - 1.850 | |
| -1.0 -0.8 | 0.007 0.016 | 0.006 0.013 | 0.010 0.013 | 0.005 0.015 |
| -0.8 -0.6 | 0.022 0.024 | 0.007 0.012 | 0.010 0.013 | 0.006 0.013 |
| -0.6 -0.4 | 0.038 0.014 | 0.017 0.011 | 0.015 0.011 | 0.020 0.011 |
| -0.4 -0.2 | 0.024 0.015 | 0.024 0.011 | 0.038 0.012 | 0.011 0.023 |
| -0.2 0.0 | 0.047 0.011 | 0.055 0.012 | 0.025 0.011 | 0.021 0.017 |
| 0.0 0.2 | 0.062 0.013 | 0.040 0.009 | 0.025 0.009 | 0.039 0.009 |
| 0.2 0.4 | 0.038 0.012 | 0.057 0.010 | 0.034 0.011 | 0.037 0.010 |
| 0.4 0.6 | 0.065 0.010 | 0.051 0.009 | 0.045 0.016 | 0.056 0.016 |
| 0.6 0.8 | 0.074 0.016 | 0.080 0.012 | 0.057 0.011 | 0.040 0.011 |
| 0.8 1.0 | 0.060 0.024 | 0.080 0.017 | 0.079 0.021 | 0.034 0.016 |
| (GeV) | ||||
|---|---|---|---|---|
| 1.850 - 2.050 | 2.050 - 2.250 | 2.250 - 2.450 | 2.450 - 2.600 | |
| -1.0 -0.8 | 0.016 0.009 | 0.010 0.014 | 0.005 0.012 | 0.012 0.011 |
| -0.8 -0.6 | 0.007 0.007 | 0.001 0.005 | 0.003 0.005 | 0.002 0.007 |
| -0.6 -0.4 | 0.004 0.005 | 0.000 0.005 | 0.001 0.006 | 0.001 0.006 |
| -0.4 -0.2 | 0.002 0.010 | 0.010 0.008 | 0.010 0.007 | 0.000 0.006 |
| -0.2 0.0 | 0.012 0.005 | 0.012 0.007 | 0.012 0.006 | 0.006 0.005 |
| 0.0 0.2 | 0.022 0.005 | 0.015 0.005 | 0.005 0.003 | 0.006 0.005 |
| 0.2 0.4 | 0.027 0.005 | 0.011 0.006 | 0.010 0.004 | 0.004 0.004 |
| 0.4 0.6 | 0.034 0.008 | 0.032 0.006 | 0.012 0.004 | 0.010 0.005 |
| 0.6 0.8 | 0.026 0.014 | 0.023 0.016 | 0.007 0.005 | 0.002 0.009 |
| 0.8 1.0 | 0.009 0.008 | 0.016 0.008 | 0.006 0.009 | 0.004 0.010 |
| [GeV] | () |
|---|---|
| 0.205 0.040 | |
| 0.447 0.054 | |
| 0.579 0.057 | |
| 0.612 0.059 | |
| 0.588 0.058 | |
| 0.575 0.037 | |
| 0.466 0.045 | |
| 0.391 0.051 | |
| 0.238 0.029 | |
| 0.201 0.033 | |
| 0.125 0.025 | |
| 0.086 0.027 |
| GeV | GeV | |
|---|---|---|
| -1.0 -0.6 | -0.016 0.128 | 0.007 0.334 |
| -0.6 -0.2 | 0.428 0.152 | 0.630 0.457 |
| -0.2 0.2 | 0.759 0.126 | 0.433 0.343 |
| 0.2 0.6 | 0.464 0.116 | 0.154 0.105 |
| 0.6 1.0 | 0.061 0.085 | -0.090 0.116 |
7 Comparison with
The reaction was measured in the same experiment
Glan03b . In the following the results are compared to
.
Both reaction cross sections culminate at a photon energy around GeV (see
fig. 13). However, while shows a pronounced peak
at this energy, varies more slowly and the cross section stays on a
much lower level. If the cross sections in the peak region are dominated by the
production of a resonance (e.g. or ) Clebsch-Gordan
coefficients predict that the ratio of cross sections is four in favor of .
The difference between both reactions is also evident in the angular dependence. As an
example, the comparison of the distributions in the peak region
is shown in fig. 14.


The polarizations of and are compared to each other in
fig. 15. The polarization measured in bins
of is found to rise as
a function of the kaon production angle Glan03b while the
polarization tends to go through a maximum value around .
The polarization grows in magnitude when going from the lower to the higher energies.
The polarization is consistent with little energy dependence.
An analysis of the data with respect to the underlying production mechanisms
and resonance production can be made by the comparison to model calculations (see section
8).
8 Comparison with theory
Here we discuss the comparison with model calculations of Bennhold and Mart bennhold as well as with previous results from KAON-MAID maid . Since the phenomenological KAON-MAID model222The model consists of a background part which is constructed from the standard Born terms, and -channel exchanges, and the resonance part which includes the isospin 1/2 nucleon resonances , , and , as well as the isospin 3/2 deltas and . bennhold ; maid was fitted to previous SAPHIR data Goers99 ; saphir98 , it obviously overpredicts the cross sections of this new measurement. This is clearly elucidated in Figs. 16 and 17. In order to see the effect of new data on the model, we refitted the corresponding coupling constants to the latest data Glan03b together with the data presented here using fixed values of the resonance parameters PDG . The result is shown in columns (b) of Table 5. For comparison, column (a) contains the result of the fit to the data only. It is obvious from Table 5 that the new data have a significant impact on the fit result. In general, including the new data reduces the coupling strengths of exchanged particles. This phenomenon can be understood from the fact that models which nicely fit the data tend to notoriously overpredict the cross sections Mart:1995wu . All coupling constants need to be readjusted in order to reproduce the new data. Since both and coupling constants are fixed to the SU(3) values, the coupling constants decrease by almost one order of magnitude. The tensor coupling of becomes also smaller after the inclusion of new data. It has been known that the and exchanges strongly determine the shape of angular distribution of the differential cross sections. It is important to note that if the Born terms dominate the process then, due to the missing of intermediate state in the channel, the calculated differential cross sections show a backward peaking behavior. However, as shown by the hadronic form factor cut-off in Table 5, the model is not dominated by the Born terms. Therefore, only readjustment of the coupling constants is required in order to fit the new data. The coupling constants, which are responsible for the divergent behavior of cross sections at higher energies Mart:1999yc , are strongly suppressed. Nevertheless, in view of the large obtained after including the new data, further improvement is inevitably required.
| Coupling Constants | (a) | (b) |
|---|---|---|
| 1.20 | 1.20 | |
| 1.56 | ||
| 3.22 | 0.46 | |
| 5.00 | ||
| 0.06 | ||
| 0.04 | ||
| 0.11 | 0.04 | |
| 0.46 | 0.58 | |
| 0.34 | ||
| - | ||
| (GeV) | 0.53 | 0.55 |
| (GeV) | 1.38 | 1.07 |
| 2.36 | 4.14 | |
| 676 | 818 |
| Resonance | Mass or | Original | Model 2 | Model 1 |
|---|---|---|---|---|
| Width | value PDG | |||
| 1650 | 2167 | 1795 | ||
| 150 | 186 | 158 | ||
| - | - | 2112 | ||
| - | - | 400 | ||
| 1710 | 1690 | 1680 | ||
| 100 | 100 | 100 | ||
| 1720 | 2133 | 2141 | ||
| 150 | 256 | 279 | ||
| 1900 | 1920 | 1900 | ||
| 200 | 355 | 329 | ||
| 1910 | 1936 | 1800 | ||
| 250 | 399 | 400 | ||
| 4.14 | 2.44 | 1.76 |
Since there is no hint for a new resonance neither in the differential nor in the total cross section (see Figs. 16 and 17), an arbitrarily inclusion of new resonances to improve the is by no means advocated. Instead, we left the masses and widths of and resonances as free parameters within certain ranges to be determined by the fit. The result is shown by Model 2 in Table 6, where we can see that the is significantly reduced to 2.44. It is, however, especially interesting to see that both and masses are shifted to higher values (2167 MeV and 2133 MeV, respectively), whereas those of other resonance states are relatively stable. For the fits prefer a width at the lowest value allowed. Reference Mart:2004ug pointed out that such a behavior could be an indication for the existence of another resonance with a relatively different mass. As a first step to check this conjecture, we put two resonances and leave their masses and widths to be determined by the fit. As shown by Model 1 in the same Table, we obtain from such a fit two signals with masses 1795 MeV and 2112 MeV, respectively, which seemingly supports the finding in Ref. Mart:2004ug . This could be another indication that more “missing resonances” are required to explain kaon photoproduction process, a point which should be addressed in future studies.


Figure 16 compares the differential cross sections obtained from different isobar models. It is evident from this figure that the KAON-MAID fit to the previous data is unable to reproduce neither the shape nor the magnitude of differential cross sections. In contrast to this, both Model 1 and Model 2 can fairly describe these new data up to some structures shown, except at low energies for backward angles. At forward directions Model 1 tends to produce more forward peaking cross sections at high energies than Model 2. The fact that Model 2 cannot reproduce total cross section data at energies below 1900 MeV (Fig. 17) is due to the lack of resonances with MeV (see Table 6). In Model 1 the fitted mass of the first and that of the are in this region. We also note that in the case of the KAON-MAID fit on the previous data the divergent behavior of the total cross section at high energies is attributed to the large value of the cut-off (0.82 GeV). At this region a slight increment in total cross section is also observed in Model 1, but not in Model 2. Figure 18 shows that neither model can reproduce the recoil polarization data which tend to peak at degrees. From the fit point of view this can be understood since the number of data is to scarce to compete with the cross sections one and the energy bins of the data are too broad to compare with a single energy prediction. On the other side, this result shows that polarization data are still powerful to severely constrain the proliferating of the models, provided that the corresponding accuracy can be significantly improved.
9 Summary
A new measurement of the reaction
carried out with the SAPHIR detector at ELSA is reported.
The results comprise measurements of cross section and hyperon polarization as a
function of kaon production angle and photon energy in the photon energy range from the
reaction threshold up to GeV. The reaction cross section integrated over
the angular range grows up to a photon energy around GeV and
falls monotonously from there up to the highest measured energy.
The reaction cross section is below that of
and varies less with photon energy and kaon production angle. The is
polarized mainly in the angular region of . The data
can be fairly well described within the framework of isobar model calculations.
We would like to thank the technical staff of the ELSA machine
group for their invaluable contributions to the experiment. We
gratefully acknowledge the support by the Deutsche Forschungsgemeinschaft
in the framework of the Schwerpunktprogramm “Investigation of the hadronic
structure of nucleons and nuclei with electromagnetic probes”
(SPP 1034 KL 980/2-3).
References
- (1) S. Capstick and W. Roberts, Phys. Rev. D 58, 074011 (1998)
- (2) U. Löring, K. Kretzschmar, B. Ch. Metsch, H.-R. Petry, Eur. Phys. J. A 10, 309 (2001); U. Löring, B. Ch. Metsch and H.-R. Petry, Eur. Phys. J. A 10, 395 (2001) and Eur. Phys. J. A 10, 447 (2001); B. Ch. Metsch, U. Löring, D. Marten and H.R. Petry, Eur. Phys. J. A 18, 189 (2003).
-
(3)
K.-H. Glander et al.,
The SAPHIR Collaboration,
Eur. Phys. J. A 19, 251 (2004). - (4) S. Goers et al., The SAPHIR Collaboration, Phys. Lett. B 464, 331 (1999).
-
(5)
W. J. Schwille et al., The SAPHIR Collaboration,
Nucl. Instr. Meth. A 344, 470 (1994). - (6) D. Husmann, W. J. Schwille, Phys. Bl. 44, 40 (1988).
- (7) R. Burgwinkel, doctoral thesis, Bonn university (1996), Bonn-IR-9602; J. Barth, doctoral thesis, Bonn University (2002), Bonn-IR-02-6.
-
(8)
K.-H. Glander, doctoral thesis, Bonn university (2003),
Bonn-IR-2003-05,
http://saphir.physik.uni-bonn.de/saphir/thesis.html. - (9) R. Lawall: Messung der Reaktion für Photonenergien bis GeV mit dem SAPHIR-Detektor an ELSA, doctoral thesis, Bonn University, BONN-IR-2004-01, http://saphir.physik.uni-bonn.de/saphir/thesis.html.
- (10) Aachen-Berlin-Bonn-Hamburg-Heidelberg-München Collaboration, Physical Review 188, 2060 (1969).
-
(11)
T. D. Lee, J. Steinberger, G. Feinberg, P. K. Kabir,
C. N. Yang, Phys. Rev. 106, 1367 (1957);
R. Gatto, Phys. Rev. 109, 610 (1958). - (12) Review of Particle Physics (S. Eidelman et al.), Phys. Lett. B 592, 1 (2004).
-
(13)
C. Bennhold, T. Mart et al., preprint nucl-th/9901066;
C. Bennhold, H. Haberzettl, T. Mart in Proc. of the second international conference on perspectives in hadronics physics, World Scientific, Singapore (1999);
T. Mart, C. Bennhold, Phys. Rev. C 61 (12), 012201 (2000);
C. Bennhold et al., preprint nucl-th/0008024. - (14) KAON-MAID: http://www.kph.uni-mainz.de/MAID/ kaon/kaonmaid.html.
- (15) M. Q. Tran et al., The SAPHIR Collaboration, Phys. Lett. B 445, 20 (1998).
- (16) T. Mart, C. Bennhold and C. E. Hyde-Wright, Phys. Rev. C 51, 1074 (1995).
- (17) T. Mart, S. Sumowidagdo, C. Bennhold and H. Haberzettl, preprint nucl-th/0002036.
- (18) T. Mart, A. Sulaksono and C. Bennhold, in Proceedings of the International Symposium on Electrophotoproduction of Strangeness on Nucleons and Nuclei (SENDAI 03), Sendai, Japan, 16-18 Jun 2003, edited by K. Maeda, H. Tamura, S.N. Nakamura, O. Hashimoto (World Scientific, Singapore, 2004) p.65; preprint nucl-th/0411035.