Pion, Kaon, Proton and Antiproton Spectra in d+Au and p+p Collisions
at = 200GeV at the Relativistic Heavy Ion Collider
Abstract
Identified mid-rapidity particle spectra of , , and from 200 GeV p+p and d+Au collisions are reported. The d+Au collisions were divided into 3 centralities. This data were taken in 2003 run from the Solenoidal Tracker at RHIC (STAR) experiment. A time-of-flight detector based on multi-gap resistive plate chamber (MRPC) technology is used for particle identification. This is the first time that MRPC detector was installed to take data as a time-of-flight detector in the collider experiment.
The calibration method was set up in the STAR experiment for the first time, which will be described in the analysis chapter in detail and has been applied to the experimental data successfully. The intrinsic timing resolution 85 ps was achieved after the calibration. In 2003 run, the pion/kaon can be separated up to transverse momentum () 1.6 GeV/c while proton can be identified up to 3.0 GeV/c. Thus the identified particle spectra can be extended to intermediate in STAR. This proved that MRPC as a time-of-flight detector works in the heavy ion collider experiment.
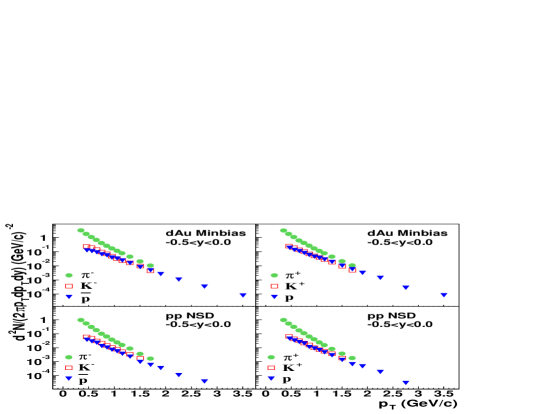
We observe that the spectra of , , and are considerably harder in d+Au than those in p+p collisions. In GeV d+Au collisions, the nuclear modification factor of protons rise faster than those of pions and kaons. The of proton is larger than 1 at intermediate while the proton production follows binary scaling at the same range in 200 GeV Au+Au collisions. These results further prove that the suppression observed in Au+Au collisions at intermediate and high is due to final state interactions in a dense and dissipative medium produced during the collision and not due to the initial state wave function of the Au nucleus. Since the initial state in d+Au collisions is similar to that in Au+Au collisions, and, it’s believed that the quark-gluon plasma doesn’t exist in d+Au collisions, these results from d+Au collisions are very important for us to judge whether the quark-gluon plasma exists in Au+Au collisions or not and to understand the property of the dense matter created in Au+Au collisions. Besides, the particle-species dependence of the Cronin effect is observed to be significantly smaller than that at lower energies. The ratio of the nuclear modification factor () between and charged hadrons () in the transverse momentum range GeV/c is measured to be (stat)(syst) in minimum-bias collisions and shows little centrality dependence. The yield ratio of in minimum-bias d+Au collisions is found to be a factor of 2 lower than that in Au+Au collisions, indicating that the relative baryon enhancement observed in heavy ion collisions at RHIC is due to the final state effects in Au+Au collisions.
The mechanism for Cronin effect is also discussed in this thesis by comparison with the recombination model [92] and with the initial multiple parton scattering model [30], which will be described in the discussion chapter in detail. Usually the Cronin effect has been explained to be the initial state effect only [30]. However, from the comparisons, we conclude that the Cronin effect in GeV d+Au collisions is not initial state effect only, and that final state effect plays an important role.
These physics results has been at e-Print Archives (nu-ex/0309012) and submitted for publication. The excellent particle identification from the prototype MRPC tray and the important physics from it have provided a solid basis for the STAR full-time-of-flight-system proposal.
Pion, Kaon, Proton and Antiproton Spectra in d+Au and p+p Collisions
at = 200GeV at the Relativistic Heavy Ion Collider
A Dissertation
Presented to the Faculty of the Graduate School
of
University of Science and Technology of China
in Candidacy for the Degree of
Doctor of Philosophy
By
Lijuan Ruan
Dissertation Director: Prof. Hongfang Chen
Off-campus Co-adviser: Dr. Zhangbu Xu
Jan. 2005
© Copyright 2024
by
Lijuan Ruan
All Rights Reserved
Acknowledgments
I would like to thank my adviser, Prof. Hongfang Chen. She has been my adviser since I was an undergraduate student. Her enormous physics knowledge and serious attitude on science give me a deep impression. Her enthusiasm on the research sets an example for me. I also thank her for giving me a chance to stay in BNL to do my research on STAR physics. I would like to thank Dr. Zhangbu Xu, the co-adviser of my PhD research. He guided me through all the detailed analysis in my research. He also gave me a lot of help on life when I stayed at BNL.
Special thanks to Xin Dong, my classmate and my friend, a great partner of the research. He gave me a lot of help and encouragement. I would like to thank Dr. Nu Xu and Prof. Huanzhong Huang for many helpful and inspiring discussion on my research. I’d like to thank Prof. Jian Wu for taking care of me and encouraging me when he stayed in BNL. I thank Dr. Haibin Zhang to give me a lot of help on life when I just arrived at BNL. He also guided me through the analysis.
I’d like to thank the high energy group in USTC for their hardwork on the MRPC detector construction. Spectra thanks to Prof. Cheng Li, and Dr. Ming Shao.
I’d like to thank my parents for their sacrifice and support. Without the sacrifice, I will be only the body without spirit. I’d like to thank my husband, Dr. Shengli Huang for his encouragement and support.
I’d like to thank all my friends for their support. Without you, the life is meaningless.
I thank every member of the STAR collaboration for their hard work to make the experiment run smoothly and successfully, to construct the detector and develop the software.
Chapter 1 Physics
1.1 Deconfinement and phase diagram
The theory which describes the interaction of the color charges of quarks and gluons is called Quantum Chromodynamics (QCD). In phenomenological quark models, mesons can be described as quark-antiquark bound states, while baryons can be considered as three quark bound states. Up to now, it’s found that all the hadron states which can be observed in isolation is colorless singlet states. Experimentally, no single quark, which is described by a color-triplet state, has ever been isolated. The absence of the observation of a single quark in isolation suggests that the interaction between quarks and gluons must be strong on large distance scale. In the other extreme, much insight into the nature of the interaction between quarks and gluons on short distance scales was provides by deep inelastic scattering experiments. In these experiments, the incident electron interacts with a quark within a hadron and is accompanied by the momentum transfer from the electron to the quark. The measurement of the electron momentum before and after the interaction allows a probe of the momentum distribution of the parton inside the nucleon. It was found that with very large momentum transfer, the quarks inside the hadron behave as if they were almost free [1]. The strong coupling between quarks and gluons at large distances and asymptotic freedom are the two remarkable features of QCD. When the energy density is high enough either due to the high temperature or high baryon density, the quark or gluon may be deconfined from a hadron. The thermalized quark gluon system is what we called quark-gluon plasma. Lattice QCD calculations, considering two light quark flavors, predict a phase transition from a confined phase, hadronic matter, to a deconfined phase, or quark-gluon plasma (QGP), at a temperature of approximately
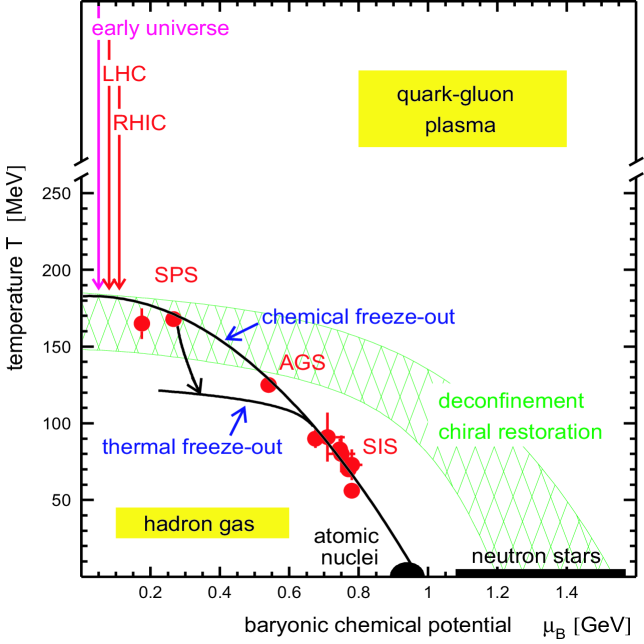
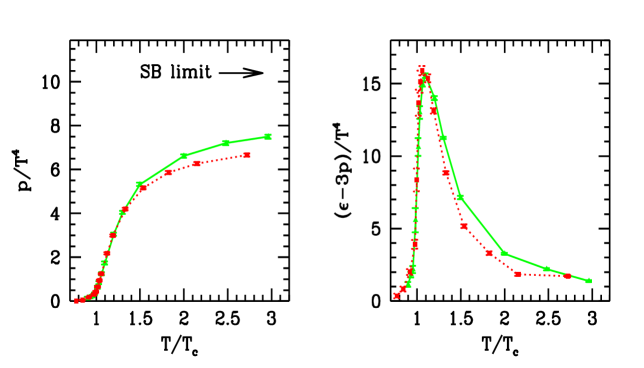
160 MeV [2]. Figure 1.1 shows the phase diagram of the hadronic and partonic matter. A phase transition from the confined hadronic matter to the deconfined QGP matter is expected to happen at either high temperature or large baryon chemical potential . Recent Lattice QCD calculations show that the QGP is far from ideal below 3 . The nonideal nature of this strongly coupled QGP is also seen from the deviation of the pressure, , and energy density from the Stefan Boltzmann limit as shown in Figure from [4].
Experiments on relativistic heavy ion collisions are designed to search for and study the deconfined QGP matter.
1.2 Relativistic Heavy Ion Collisions
The experimental programs in relativistic heavy ions started in
1986 using the Alternating Gradient Synchrotron (AGS) at
Brookhaven National Lab (BNL) and the Super Proton Synchrotron
(SPS) at European laboratory for particle physics (CERN). At BNL,
ion beams of silicon and gold, accelerated to momenta of 14 and 11
GeV/c per nucleon, respectively, have been utilized in 10
fixed-target experiments. There have been 15 heavy ion experiments
at CERN utilizing beams of oxygen at 60 and 200 GeV/c per nucleon,
sulphur at 200 GeV/c per nucleon and Pb at 160 GeV/c
per nucleon [2].
The Relativistic Heavy Ion Collider (RHIC) at BNL is designed for
head-on Au+Au collisions at = 200 GeV. The first
RHIC run was performed in 2000 with Au+Au collisions at
= 130 GeV/c in four experiments, STAR, PHENIX,
PHOBOS and BRAHMS. The second RHIC run was in 2001 and 2002 with
Au+Au and p+p collisions at = 200 GeV. The third
RHIC run was in 2002 and 2003 with
d+Au and p+p collisions at = 200 GeV.
The above mentioned relativistic heavy ion collision experiments
are designed for the search and study of the possible deconfined
high energy density matter, quark-gluon plasma. In head-on
relativistic heavy ion collisions, two nuclei can be represented
as two thin disks approaching each other at high speed because of
the Lorentz contraction effect in the moving direction. During the
initial stage of the collisions, the energy density is higher than
the critical energy density from the Lattice QCD calculation, so
the quarks and gluons will be de-confined from nucleons and form
the quarks and gluons system. The large cross section of
interaction may lead to the thermalization of the quarks and
gluons system. That’s what we called the formation of quark-gluon
plasma (QGP). In this stage, the high transverse momentum
() jets and pair will be produced due to the
large momentum transfer. After that, the QGP will expand and cool
down and enter into the mixed-phase expansion. The chemical freeze
out point will be formed after the inelastic interactions stop.
That means that the particle yields and ratios will not change.
After the chemical freeze out, the elastic interactions between
hadrons will change the distribution of particles. The
particles will freeze out finally from the system after the
elastic interactions stop. That’s what we called the kinetic
freeze out point. In the following the important results from RHIC
will be addressed.
1.3 The experimental results at RHIC
1.3.1 Flow
In non-central Au+Au collisions, the spatial space asymmetry will be transferred into the momentum space asymmetry by the azimuthal asymmetry of pressure gradients.
The azimuthal particle distributions in momentum space can be expanded in a form of Fourier series
| (1.1) |
where denotes the reaction plane angle. The Fourier
expansion coefficient stands for the th harmonic of the
event azimuthal anisotropies. is so called direct flow and
is the elliptic flow. The elliptic flow is generated mainly
during the highest density phase of the evolution before the
initial geometry asymmetry of the plasma disappears.
Hydrodynamical calculations [19] show most of
is produced before 3 fm/c at RHIC.
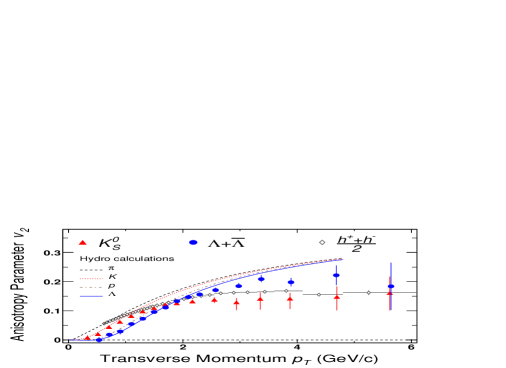
Figure 1.3 shows that The of ,
and charged hadrons () as a
function of for 0–80% of the collision cross
section [6]. Also shown are the of pions,
kaons, protons and lambdas from hydrodynamical
model [5]. The from hydrodynamical model
shows strong mass dependence, which fits the up
to GeV/c and fits the
up to GeV/c. Even though the from
hydrodynamical model shows consistency with data at low ,
however, the from experimental results show saturation at
intermediate while hydrodynamical predictions show rising
trend at the same range.
1.3.2 High suppression and di-hadron azimuthal correlation
The from hydrodynamical models show consistency with data at lower and fail to reproduce data at higher . At high , the suppression for charged hadron production was observed in Au+Au collisions at RHIC energy. The comparison of the spectra in Au+Au collisions through those in p+p collisions, scaled by the number of binary nucleon nucleon collisions is the nuclear modification factor .
| (1.2) |
where accounts for the collision geometry, averaged over the event centrality class. , the equivalent number of binary collisions, is calculated using a Glauber model. The is an experimental variable. The high hadron suppression in central Au+Au collisions can also be investigated by comparing the hadron spectra in central and peripheral Au+Au collisions. That’s what we called . is defined as
| (1.3) |
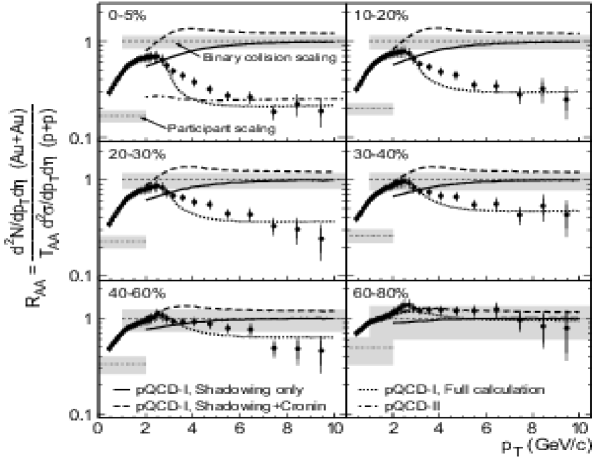
Figure 1.4 shows of inclusive charged
hadron for various centrality bins in Au+Au collisions at
=200 GeV. increases monotonically for
2 GeV/c at all centralities and saturates near unity for
2 GeV/c in the most peripheral bins. In contrast,
for the central bins reaches a maximum and then
decreases strongly above = 2 GeV/c, showing the suppression
of the charged hadron yield relative the
reference [8].
Suppression of high hadron production in central Au+Au
collisions relative to p+p collisions
[8, 17] has been interpreted as energy
loss of the energetic partons traversing the produced hot and
dense medium [9], that’s so called jet quenching. If
a dense partonic matter is formed during the initial stage of a
heavy-ion collision with a large volume and a long life time
(relative to the confinement scale ), the
produced large parton will interact with this dense medium
and will lose its energy via induced radiation. The energy loss
depends on the parton density of the medium. Therefore, the study
of parton energy loss can shed light on the properties of the
dense matter in the early stage of heavy-ion
collisions [9]. At sufficiently high beam energy,
gluon saturation is also expected to result in a relative
suppression of hadron yield at high in A+A
collisions [33]. Also shown in the Figure 1.4 are
the results from perturbative QCD (pQCD) calculations. The
Full-pQCD calculations include the partonic energy loss, the
Cronin enhancement(due to initial multiple scattering) and the
nuclear shadowing effect. The suppression is predicted to be
independent when is larger than 6 GeV/c, which is consistent
with our data. However, the discrepancy at 2-6 GeV/c was observed
between the prediction and the experimental data. This discrepancy
may be due to different mechanism for particle production at
intermediate . The particle production at intermediate
will be discussed later in this chapter.
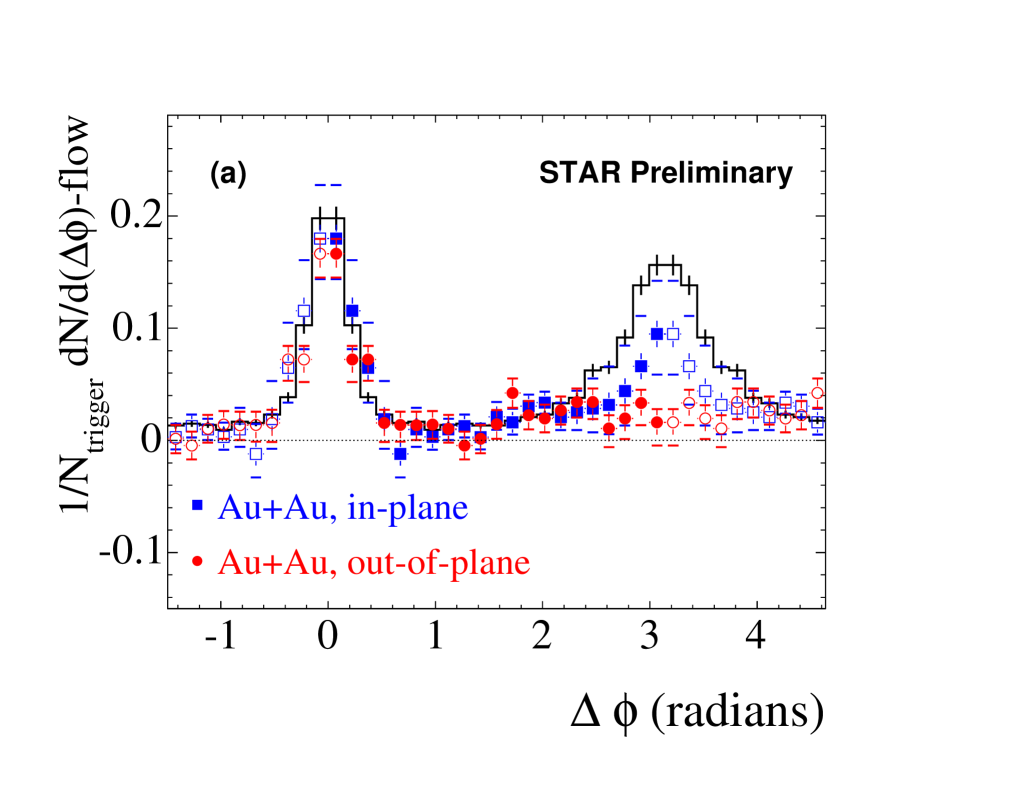
A more differential probe of parton energy loss is the measurement
of high di-hadron azimuthal correlation relative to the
reaction plane orientation. The trigger hadron is in the range
GeV/c and the associated particle is at
GeV/c. Figure 1.5 (left) shows the high di-hadron
correlation when the trigger particle is selected in the azimuthal
quadrants centered either in the reaction plane (in plane) or
orthogonal to it(out of plane). The near side di-hadron azimuthal
correlations in both cases were observed to be the same as that in
p+p collisions, while the suppression of back to back correlation
shows strong dependence on the relative angle between the
triggered high hadron and the reaction plane. This
systematic dependence is consistent with the picture of parton
energy loss: the path length for a dijet oriented out of plane is
longer than that for a dijet oriented in plane, leading to a
stronger suppression of parton energy loss in the out of plane.
The dependence of parton energy loss on the path length is
predicted to be substantially larger than
linear [9].
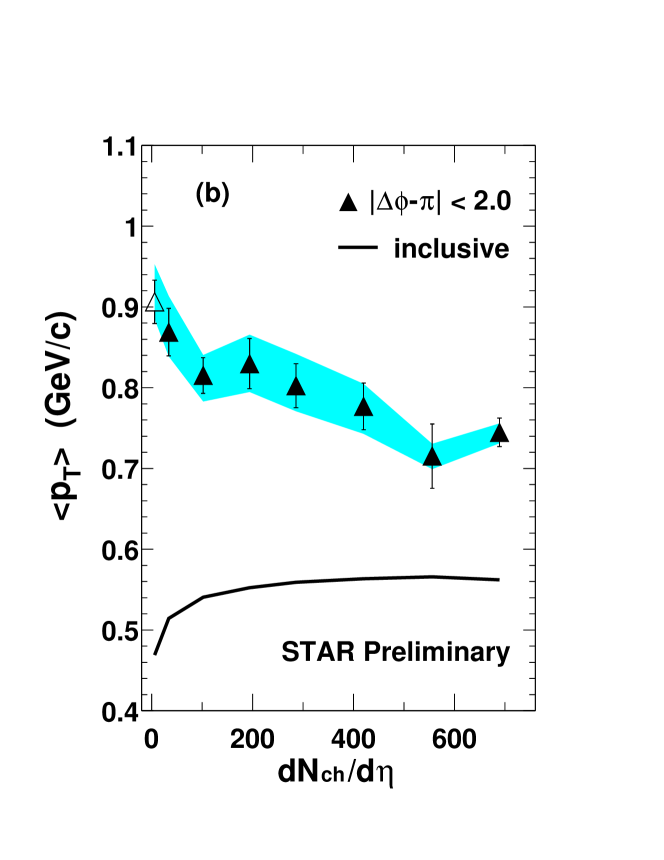
The energy lost by away side partons traversing the collision
matter must in the form of the excess of softer emerging particles
due to the transverse momentum conservation. An analysis of
azimuthal correlations between soft and hard particles has been
performed for both 200 GeV p+p and Au+Au collisions [11]
at STAR as a first of attempt to trace the degree of the
degradation on the away side. With triggered hadron still in the
range 6 GeV/c, but the associated hadrons now
sought over GeV/c, combinatorial coincidences
dominate this correlation and they must be subtracted carefully by
mixed-event technique and also the elliptic flow effect was also
subtracted by hand [11]. The results demonstrate that,
in comparison with the p+p and peripheral Au+Au collisions, the
momentum-balancing hadrons opposite to the high triggered
particle in central Au+Au are greater in number, much more widely
dispersed in azimuthal angle, and significantly softer in
momentum. Figure 1.5 (right) shows the of the momentum-balancing hadrons opposite to the high
trigger as a function of centrality. The were observed to decrease from peripheral to central
Au+Au collisions. Also shown in the Figure 1.5 (right)
is the of the inclusive hadrons as a
function of centrality. This study will be extended to higher
trigger particle. The results may suggest that the
moderately hard parton traversing a significant path length
through the collision matter makes substantial progress toward
equilibrium with the bulk. The rapid attainment of thermalization
via multitude of softer parton-parton interactions in the earliest
collision stages would then not be so
surprising [13].
1.3.3 Particle composition in Au+Au at intermediate
As we have mentioned above, for , the pQCD model including
the parton energy loss, Cronin enhancement and nuclear shadowing
can qualitatively fit the trend of data at GeV/c,
however, the quantitative discrepancy between the model and the
data is also obvious. In the intermediate , the mechanism
for particle production may be different from that at
high .
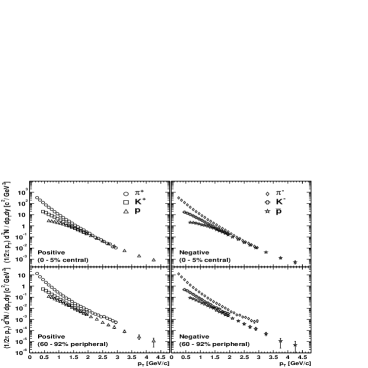
Figure 1.6 (left) shows the , K, p
spectra in 0%-5% and 60%-92% Au+Au 200 GeV collisions
from [14]. It shows that the shapes of the spectra
show clear mass dependence. And in central collisions, the ,
K, p yields are close to each other at GeV/c while it’s
not the case in peripheral collisions.
Figure 1.6 (right) shows proton/pion (top) and
anti-proton/pion (bottom) ratios for central 0–10%, mid-central
20–30% and peripheral 60–92% in Au+Au collisions at 200
GeV [14]. It shows that the ratios
increase fast from peripheral to central collisions. In the 0-10%
centrality bin, the proton yield is even larger than pion yield at
intermediate . Figure 1.7 shows the ratio
for identified mesons and baryons at mid-rapidity calculated using
centrality intervals, 0–5% vs. 40–60% of the collision cross
section from STAR measurement [12]. It seems that
for meson, the follows a common trend and for baryon, the
also follows a common trend, which is different from that
for mesons. The for baryons is observed to be larger than
that for mesons.

These experimental results suggest that the degree of suppression depends on particle species(baryon/meson) at intermediate . The spectra of baryons (protons and lambdas) are less suppressed than those of mesons (pions, kaons) [6, 18] in the range GeV/c. The baryon content in the hadrons at intermediate depends strongly on the impact parameter (centrality) of the Au+Au collisions with about 40% of the hadrons being baryons in the minimum-bias collisions and 20% in very peripheral collisions [6, 18]. Hydrodynamics [19, 20], parton coalescence at hadronization [21, 22, 23] and gluon junctions [24] have been suggested as explanations for the observed particle-species dependence.
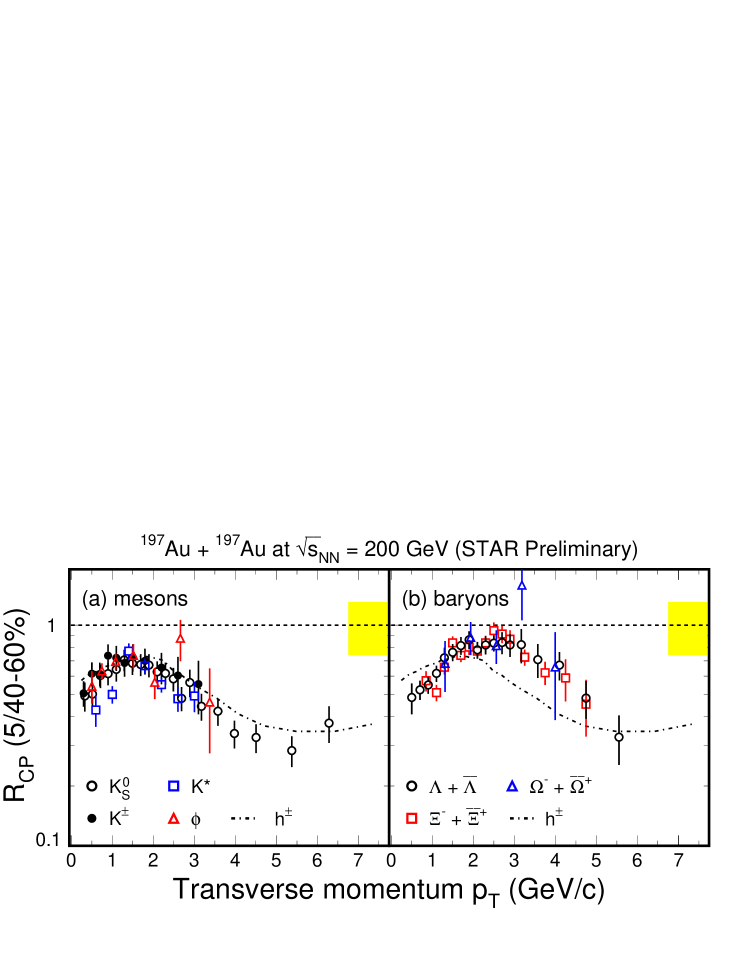
In these models, recombination/coalescence models successfully reproduce of baryons and mesons at intermediate , as well as showing consistency with the measurement in the same range.
Recombination model
The concept of quark recombination was introduced to describe
hadron production at forward rapidity in p+p
collisions [25]. At forward rapidity, this
mechanism allows a fast quark resulting from a hard parton
scattering to recombine with a slow anti-quark, which could be one
in the original sea in the incident hadron, or one incited by a
gluon [25]. If a QGP is formed in the
relativistic heavy ion collisions, then one might expect
coalescence of the abundant thermal partons to provide another
important hadron production mechanism, active over a wide range of
rapidity and transverse momentum [26]. In
particular, at moderate values(above the realm of
hydrodynamics applicability), the hadron production from
recombination of lower partons from thermal
bath [21, 22, 23] has been predicted to be competitive with
the production from fragmentation of higher scattered
partons. It has been suggested [27] that the
need for substantial recombination to explain the observed hadron
yield and flow may be taken as a signature of QGP
formation.
In order to explain the features of RHIC collisions, the
recombination models [26, 21, 22, 23] make the
central assumption that coalescence proceeds via constituent
quarks, whose number in a hadron determines its production rate.
The constituent quarks are presumed to follow a thermal
(exponential) momentum spectrum and to carry a collective
transverse velocity distributions. This picture leads to clear
predicted effects on baryon and meson production rates, with the
former depending on the spectrum of thermal constituent quarks and
antiquarks at roughly one-third the baryon , and the latter
determined by the spectrum at roughly one-half the meson .
Indeed, the recombination model was recently was re-introduced at
RHIC context, precisely to explain the abnormal abundance of
baryon vs meson observed at intermediate
[21, 22, 23]. If the observed saturated elliptic flow
values of hadrons in this momentum range result from coalescence
of collectively flowing constituent quarks, then one expect a
similarly simple baryon vs meson relationship [21, 22, 23]:
the baryon (meson) flow would be 3 (2) times the quark flow at
roughly one-third (one-half) the baryon (meson)
[13].
1.3.4 Summary
In summary, the several important results from RHIC have been introduced. The elliptic flow can be reproduced by hydrodynamics at low . At intermediate , from data show saturation and deviate from hydrodynamical model predictions. At the same time, from data show baryon or meson species dependence. High suppression can be reproduced by pQCD model and gluon saturation model. The gluon saturation model is also called color glass condensate model (CGC). The production rate dependence on baryon or meson species has been observed at intermediate , which can be reproduced by the recombination model.
1.4 Cronin effect
1.4.1 Why we need d+Au run at RHIC
In order to see the intermediate and high suppression is due to the final-state effect or initial state effect, the measurements from d+Au collisions will provide the essential proof. Since the initial state in d+Au collisions is similar to that in Au+Au collisions, and, it’s believed that the quark-gluon plasma doesn’t exist in d+Au collisions, the results from d+Au collisions will be very important for us to judge whether the quark-gluon plasma exists in Au+Au collisions or not and to understand the property of the dense matter created in Au+Au collisions. Besides, if the identified particle spectra in d+Au and p+p collisions are measured, they will not only provide the reference for those in Au+Au collisions at 200 GeV, but also provide a chance to see the mechanism of the Cronin effect itself clearly at 200 GeV. Cronin effect was observed 30 years ago experimentally and the study of this effect was only limited to lower energy fixed target experiments. Before we go to the d+Au collisions, let’s look back on the p+A collisions at lower energy fixed target experiment.
1.4.2 Lower energy
The hadron spectra have been observed to depend on the target atomic weight () and the produced particle species in lower energy p+A collisions [28]. This is known as the “Cronin Effect”, a generic term for the experimentally observed broadening of the transverse momentum distributions at intermediate in p+A collisions as compared to those in p+p collisions [28, 29, 30]. The effect can be characterized as a dependence of the yield on the target atomic weight as . At energies of 30 GeV, depends on and is greater than unity at high [28], indicating an enhancement of the production cross section. As shown in Figure 1.8, the is larger than 1 in the intermediate and shows strong particle-species dependence. The for proton and antiproton are larger than those for kaon and pion. And for kaon is larger than that for pion. This effect has been interpreted as partonic scatterings at the initial impact [29, 30].
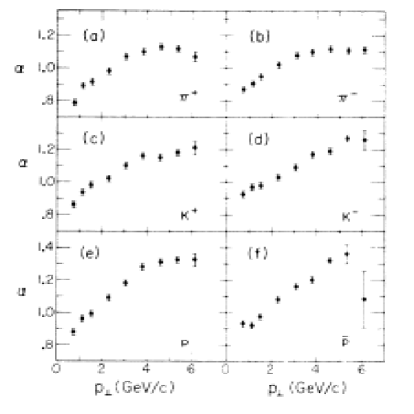
Besides, the lower energy data suggest the power decreases with energy, as shown in Figure 1.8. However, the energy dependence study of Cronin effect is limited to fixed target experiment at lower energy. What’s the extrapolation of Cronin effect at higher energy such as RHIC energy 200 GeV. At higher energies, multiple parton collisions are possible even in p+p collisions [32]. This combined with the hardening of the spectra with increasing beam energy would reduce the Cronin effect [30]. There are several models which give different predictions of Cronin effect at 200 GeV.
1.4.3 Predictions: RHIC energy
One of the models is the initial multiple parton scattering model. In this model, the transverse momentum of the parton inside the proton will be broadened when the proton traverses the Au nucleus due to the multiple scattering between the proton and the nucleons inside the Au nucleus. In these models, the Cronin ratio will increases to a maximum value between 1 and 2 at 2.54.5 GeV/c and then decreases with increasing [30]. The Cronin effect is predicted to be larger in central d+Au collisions than in d+Au peripheral collisions [31]. Another model is the gluon saturation model. At sufficiently high beam energy, gluon saturation is expected to result in a relative suppression of hadron yield at high in both p+A and A+A collisions and in a substantial decrease and finally in the disappearance of the Cronin effect [33].
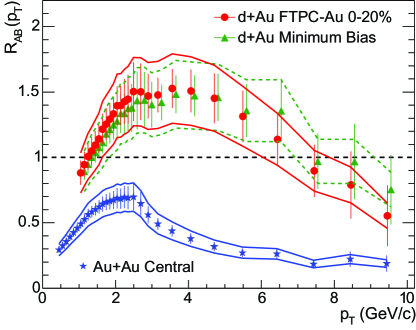
Figure 1.9 shows the of charged hadron vs
from STAR. We can see that the Cronin ratio increases to a
maximum value around 1.5 at GeV/c and then decreases
again [36]. This is consistent with the initial multiple
parton scattering model [30]. These results on inclusive
hadron production from d+Au collisions indicate that hadron
suppression at intermediate and high in Au+Au collisions
is due to final state interactions in a dense and dissipative
medium produced during the collision and not due to the
initial state wave function of the Au nucleus [36, 37].
Now we know that the hadron suppression at intermediate in
Au+Au collisions is due to final-state
effects [36, 37]. What’s the effect on particle
composition at the same range in Au+Au collisions? Another
question is whether there is any Cronin effect dependence on
particle-species in d+Au collisions or not. In order to further
understand the mechanisms responsible for the particle dependence
of spectra in heavy ion collisions, and to separate the
effects of initial and final partonic rescatterings, we measured
the distributions of , , and
from 200 GeV d+Au and p+p collisions. In this thesis, we
discuss the dependence of particle production on ,
collision energy, and target atomic weight. And we compare the
Cronin effect of , , and with
models to address the mechanism for Cronin effect in d+Au
collisions at GeV.
Chapter 2 The STAR Experiment
2.1 The RHIC Accelerator
The Relativistic Heavy Ion Collider (RHIC) at
Brookhaven National Lab (BNL) is the first hadron accelerator and
collider consisting of two independent ring. It is designed to
operate at high collision luminosity over a wide range of beam
energies and particle species ranging from polarized proton to
heavy ion [41, 42], where the top energy of the
colliding center-of-mass energy per nucleon-nucleon pair is
= 200 GeV. The RHIC facility consists of two
super-conducting magnets, each with a circumference of 3.8 km,
which focus and guide the beams.
Figure 2.1 shows the BNL accelerator complex including the
accelerators used to bring the gold ions up to RHIC injection
energy. In the first, gold ions are accelerated to 15 MeV/nucleon
in the Tandem Van de Graaff facility. Then the beam is transferred
to the Booster Synchrotron and accelerated to 95 MeV/nucleon
through the Tandem-to-Booster line. Then the gold ions are
transferred to the Alternating Gradient Synchrotron (AGS) and
accelerated to 10.8 GeV/nucleon. Finally they are injected to RHIC
and accelerated to the collision energy 100 GeV/nucleon.
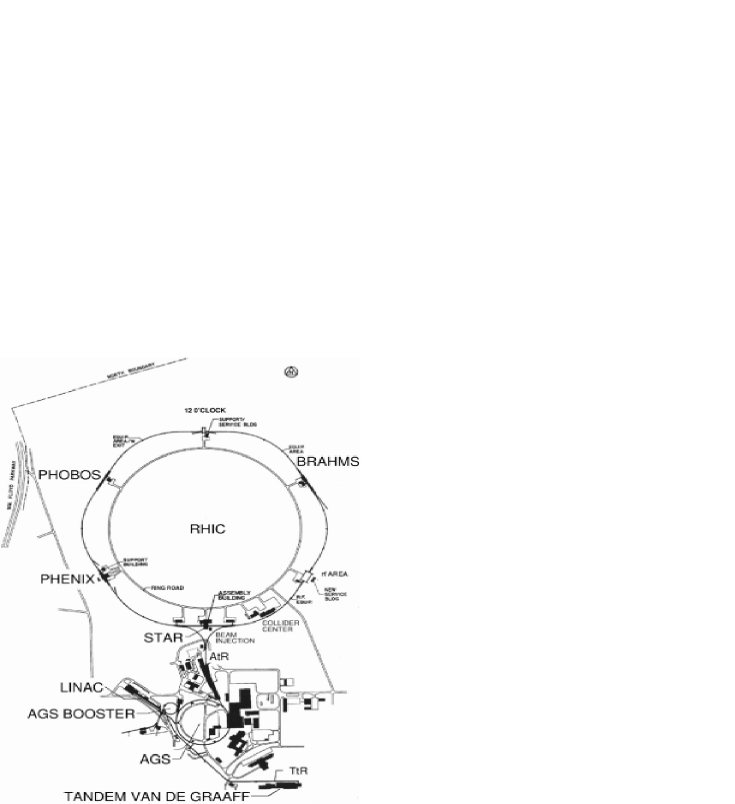
RHIC’s 3.8 km ring has six intersection points where its two rings of accelerating magnets cross, allowing the particle beams to collide. The collisions produce the fleeting signals that, when captured by one of RHIC’s experimental detectors, provide physicists with information about the most fundamental workings of nature. If RHIC’s ring is thought of as a clock face, the four current experiments are at 6 o’clock (STAR), 8 o’clock (PHENIX), 10 o’clock (PHOBOS) and 2 o’clock (BRAHMS). There are two additional intersection points at 12 and 4 o’clock where future experiments may be placed [41].
2.2 The STAR Detector
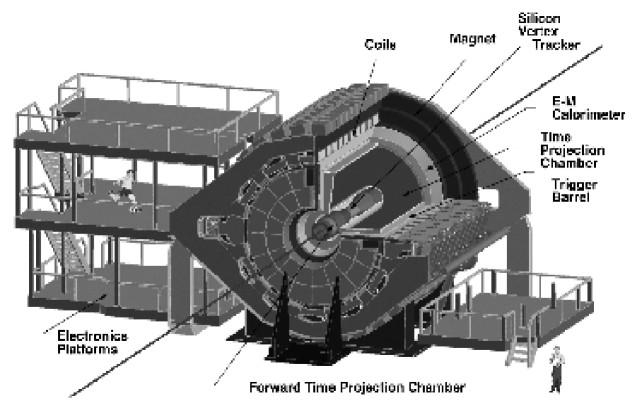
The Solenoidal
Tracker at RHIC (STAR) is one of the two large detector systems
constructed at the Relativistic Heavy Ion Collider (RHIC) at
Brookhaven National Laboratory. STAR was constructed to
investigate the behavior of strongly interacting matter at high
energy density and to search for signatures of quark-gluon plasma
(QGP) formation. Key features of the nuclear environment at
RHIC are a large number of produced particles (up to
approximately one thousand per unit pseudo-rapidity) and high
momentum particles from hard parton-parton scattering. STAR can
measure many observables simultaneously to study signatures of
a possible QGP phase transition and to understand the space-time
evolution of the collision process in
ultra-relativistic heavy ion collisions. The goal is to
obtain a fundamental understanding of the microscopic
structure of these hadronic interactions at high energy
densities. In order to accomplish this, STAR was designed
primarily for measurements of hadron production over a large solid
angle, featuring detector systems for high precision tracking,
momentum analysis, and particle identification at the center of
mass (c.m.) rapidity. The large acceptance of STAR makes it
particularly well suited for event-by-event characterizations of
heavy ion collisions and for the detection of hadron jets [43].
The layout of the STAR experiment [44] is shown in
Figure 2.2. A cutaway side view of the STAR detector
as configured for the RHIC 2001 run is displayed in
Figure 2.3. A room temperature solenoidal
magnet [45] with a maximum magnetic field of 0.5 T
provides a uniform magnetic field for charged particle momentum
analysis. Charged particle tracking close to the interaction
region is accomplished by a Silicon Vertex Tracker [46]
(SVT). The Silicon Drift Detectors [47] (SDD) installed
after 2001 is also for the inner tracking. The silicon detectors
cover a pseudo-rapidity range with
complete azimuthal symmetry (). Silicon
tracking close to the interaction allows precision localization of
the primary interaction vertex and identification of secondary
vertices from weak decays of, for example, , , and
. A large volume Time Projection
Chamber [48, 38] (TPC) for charged particle tracking and
particle identification is located at a radial distance from 50 to
200 cm from the beam axis. The TPC is 4 meters long and it covers
a pseudo-rapidity range for tracking
with complete azimuthal symmetry (). Both the
SVT and TPC contribute to particle identification using ionization
energy loss, with an anticipated combined energy loss resolution
(dE/dx) of 7 % (). The momentum resolution of the SVT
and TPC reach a value of p/p = 0.02 for a majority of the
tracks in the TPC. The p/p resolution improves as the
number of hit points along the track increases and
as the particle’s momentum decreases, as expected [43].
To extend the tracking to the forward region, a radial-drift TPC
(FTPC) [50] is installed covering , also with complete azimuthal coverage and symmetry. To extend
the particle identification in STAR to larger momenta over a small
solid angle for identified single-particle spectra at
mid-rapidity, a ring imaging Cherenkov detector
[51] covering and , and a time-of-flight patch (TOFp) [73] covering
and (as shown in
Figure 2.3) was installed at STAR in
2001 [43]. In 2003, a time-of-flight tray (TOFr)
based on multi-gap resistive plate chamber (MRPC)
technology [39] was installed in STAR detector, covering
and . For the time-of-flight
system, the Pseudo-Vertex Position Detectors (pVPD) was installed
as the start-timing detector, which was 5.4 m away from TPC center
and covers with the azimuthal coverage
19% [73] in 2003.
The fast detectors that provide input to the trigger system are a
central trigger barrel (CTB) at and two zero-degree
calorimeters (ZDC) located in the forward directions at
mrad. The CTB surrounds the outer cylinder of the TPC, and
triggers on the flux of charged particles in the mid-rapidity
region. The ZDCs are used for determining the energy in neutral
particles remaining in the forward directions [43].
A minimum bias trigger was obtained by selecting events with a
pulse height larger than that of one neutron in each of the
forward ZDCs, which corresponds to 95 percent of the geometrical
cross section [43].
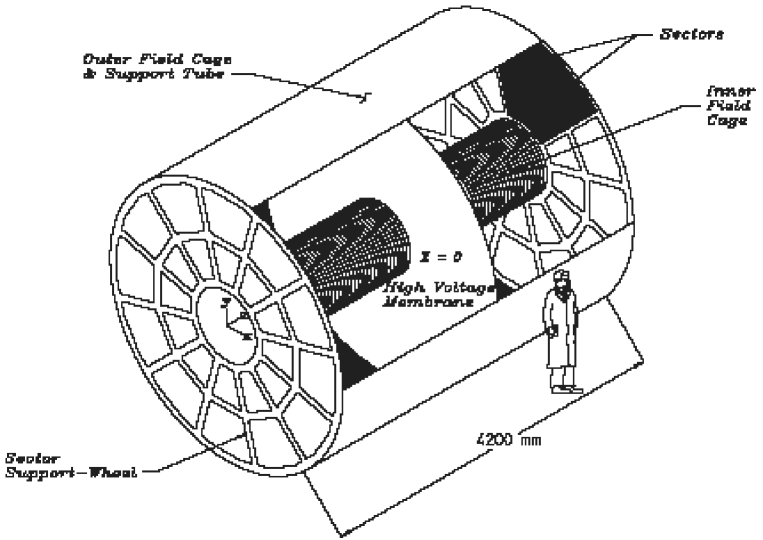
2.2.1 The Time Projection Chamber
The STAR detector [44] uses the TPC as
its primary tracking device. The TPC records the tracks of
particles, measures their momenta, and identifies the particles
by measuring their ionization energy loss (). Particles
are identified over a momentum range from 100 MeV/c to greater
than 1 GeV/c and momenta are measured over a range of 100
MeV/c to 30 GeV/c [38].
The STAR TPC is shown schematically in Figure 2.4. It is
a volume of gas in a well defined uniform electric field of
135 V/cm. The working gas of TPC is P10 gas (10%
methane, 90% argon) regulated at 2 mbar above atmospheric
pressure[54]. This gas has long been used in TPCs. Its
primary attribute is a fast drift velocity which peaks at a low
electric field. Operating on the peak of the velocity curve makes
the drift velocity stable and insensitive to small variations
in temperature and pressure [38]. The paths of primary
ionizing particles passing through the gas volume are
reconstructed with high precision from the released secondary
electrons which drift to the readout end caps at the ends of
the chamber. The drift velocity of electrons is 5.45 cm/s.
The uniform electric field which is required to drift the
electrons is defined by a thin conductive Central Membrane (CM) at
the center of the TPC, concentric field cage cylinders and the
read out end caps [38]. The readout system is based on Multi
Wire Proportional Chambers (MWPC) with readout pads. The drifting
electrons avalanche in the high fields at the 20 m anode
wires providing an amplification of 1000 to 3000. The induced
charge from an avalanche is shared over several adjacent pads,
so the original track position can be reconstructed to a small
fraction of a pad width. There are a total of 136,608 pads in the
readout system [38], which give - coordinate
information. The position
information is provided by 512 time buckets.
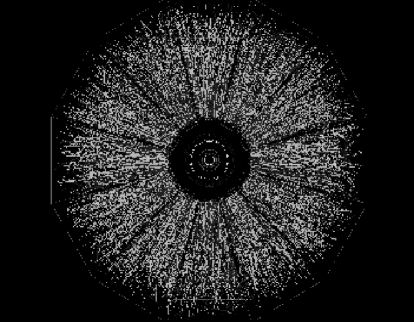
At the Data Acquisition (DAQ) stage, raw events containing millions of ADC values and TDC values were recorded. Raw data were then reconstructed into hits, tracks, vertices, and the collision vertex through the reconstruction chain of TPC [55] by Kalman method. The collision vertex are called the primary vertex. The tracks are called the global tracks. If the 3-dimensional distance of closest approach (DCA/dca) of the global track to the primary vertex is less than 3 cm, this track will be chosen for a re-fit by forcing a new track helix ending at the primary vertex. These newly reconstructed helices are called primary tracks [81]. As expected, the vertex resolution decreases as the square root of the number of tracks used in the calculation. The vertex resolution is 350 m when there are more than 1,000 tracks [38]. Figure 2.5 shows the beam’s eye view of a central Au+Au collision event in the STAR TPC.
Particle Identification (PID) of TPC by dE/dx
Energy lost in the TPC gas is a valuable tool for identifying particle species. It works especially well for low momentum particles but as the particle energy rises, the energy loss becomes less mass-dependent and it is hard to separate particles with velocities c [38]. For a particle with charge (in units of ) and speed passing through a medium with density , the mean energy loss it suffers can be described by the Bethe-Bloch formula
| (2.1) |
where is Avogadro’s number, is the electron mass, () is the classical electron radius, is the speed of light, is the atomic number of the absorber, is the atomic weight of the absorber, , is the mean excitation energy, and () is the maximum transferable energy in a single collision [83, 81]. From the above equation, we can see that different charged particles (electron, muon, pion, kaon, proton or deuteron) with the same momentum passing through the TPC gas can result in different energy loss. Figure 2.6 shows the energy loss for particles in the TPC as a function of the particle momentum, which includes both primary and secondary particles. We can see that charged pions and kaons can be identified up to about transverse momentum 0.75 GeV/c and protons and anti-protons can be identified to 1.1 GeV/c.

In order to quantitatively describe the particle identification, we define the variable (in the case of charged pion identification) as
| (2.2) |
in
which is the number of hits for a track in the TPC,
is the measured energy loss of a track and
is the mean energy loss for
charged pions. In order to identify charged kaons, protons and
anti-protons, we can have similar definition of and
. Thus we can cut on the variables ,
and to select different particle
species [81].
A specific part of the particle
identification is the topological identification of neutral
particles, such as the and . These neutral
particles can be reconstructed by identifying the secondary
vertex, commonly called V0 vertex, of their charged daughter decay
modes, and [81].
2.2.2 The time-of-flight tray based on MRPC technology

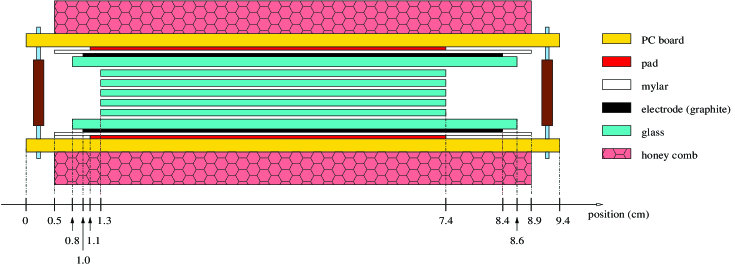
In 2003, the time-of-flight tray (TOFr) based on multi-gap resistive plate chamber (MRPC) technology [39] was installed in STAR detector. It extends particle identification up to GeV/c for and . This tray was installed on the Au beam outgoing direction. MRPC technology was first developed by the CERN ALICE group [56] to provide a cost-effective solution for large-area time-of-flight coverage. For full time-of-flight coverage at STAR, there will be 120 trays, with 60 on east side and 60 on west side. For each tray, there will be 33 MRPCs. For each MRPC, there are 6 read-out channels. Figure 2.7 shows the tray which indicates the position of each MRPC module. The MRPCs are tilted differently so that each MRPC is most projective to the average primary vertex location at Z=0. In 2003 d+Au and p+p run, only 28 MRPCs were installed in the tray and 12 out of 28 were instrumented with the electronics, representing 0.3% of TPC coverage. If we number the 33 MRPCs in the tray from 1 to 33, with 1 close to TPC center and 33 far from TPC center, the numbers of 12 modules instrumented with the electronics in 2003 are 3,4,5,7,9,10,11,12,13,14,26 and 32.
The introduction of MRPC


Resistive Plate Chambers (RPCs) were developed in
1980s [57], and were originally operated in streamer
mode. This operation mode allows us to get high detection
efficiency (95%) and time resolution ( 1 ns), with low fluxes
of incident particles. At higher fluxes (200 ), RPCs
begin to lose their efficiency. A way to overcome this problem is
to operate RPCs in avalanche mode. The Multi-gap Resistive Plate
Chamber (MRPC) was developed less than 10 years
ago [58]. It consists of a stack of resistive plates,
spaced one from the other with equal sized spacers creating a
series of gas gaps. Electrodes are connected to the outer surfaces
of the stack of resistive plates while all the internal plates are
left electrically floating. Initially the voltage on these
internal plates is given by electrostatics, but they are kept at
the correct voltage due to the flow of electrons and ions created
in the avalanches. Figure 2.8 shows the structure of
MRPC detector. For each MRPC, there are 6 read-out strips.
Figure 2.9 shows the shape of the read-out strip.
The detailed production process can be found at Appendix B.
MRPC, as a new kind of detector for time of fight system, operated
in avalanche mode with a non flammable gas mixture of 90% F134A,
5% isobutane, 5% SF6, can fulfill all these requirements: high
efficiency (95%), excellent intrinsic time resolution (100
ps) [69, 39, 70, 71, 72], high
rate capability ( 500 ), high modularity and simplicity
for construction, good uniformity of response, high
granularity/low occupancy, and large acceptance.
Simulation: the work principle of this chamber
A detailed description of the model used in the simulation was
reported in these
papers [59, 60, 61, 62], here just
the main items will be repeated. The program starts from
considering an ionizing particle which crosses the gas gaps and
generates a certain number of clusters of ion-electron pairs. The
electrons contained in the clusters drift towards the anode and,
if the electric field is sufficiently high, give rise to the
avalanche processes.
The primary cluster numbers and the avalanche growth are assumed
to follow, respectively, simple Poisson statistics and the usual
exponential law. Avalanche gain fluctuations have been taken into
account using a Polya distribution [63]. After the
simulation of the drifting avalanches, the program computes, by
means of Ramo [64] theorem, the charge
induced on the external pick-up electrodes (strips or pads) by the
avalanche motion. Under certain approximations, this is given by
the formula
| (2.3) |
where is the electron charge, 1st effective Townsend coefficient , is the Townsend coefficient, is the attachment coefficient, the cluster initial distances from the anode, the gap width, the number of initial electrons in the considered cluster, the avalanche gain fluctuations factor, and is the normalized weighting field. In addition to , the current induced on the same electrodes by the drifting charge may be computed as
| (2.4) |
, where is the electron drift velocity. The computation of
allows us to reproduce the whole information coming out
from MRPC, such as time
distribution.
Charge Spectrum Simulation: The almost Gaussian charge
distribution obtained with the MRPC is a key ingredient to its
performance. If the avalanches grew following Townsend’s formula
the charge distribution would be exponential in shape. Thus the
space charge effects must be considered in the simulation.
The input parameters for the simulation program are: the Townsend
coefficient , the attachment coefficient , the
average distance between clusters and the probability
distribution of the number of electrons per cluster. These pieces
of information can be obtained, for a given gas mixture and given
conditions (pressure and temperature) and electric field, by the
programs HEED [65] and
MAGBOLTZ [66, 67]. In addition, a maximum number
of electrons in an avalanche (cutoff value) is specified.
In a given gap, we generate a number of clusters with distances
exponentially distributed with average distance . For
each cluster, we then generate a certain number of electrons,
according to the distribution obtained by the program HEED. Each
electron from the primary cluster will give rise to a number of
electrons, generated according to an exponential probability
law.

For each cluster, the avalanche growth is stopped when the total
charge reaches a certain cutoff value, as originally suggested in
ref. [68] to take into account space charge effects in
the avalanche development. This cutoff value has been set to be
electrons.
In Figure 2.10 we show the results of
simulations, Figure 2.10(a) is the simulated
curve of the 1st effective Townsend coefficient versus the
electric field, which is generated by Magboltz. The curve shows
that the correlation between and the electric field is
almost linear when MRPC is operated at high electric field for the
gas mixture. Figure 2.10(b) is the charge
spectrum for a 6 gap chamber and (c) (d) for a 10 gap chamber
compared to experimental data [69, 39], and the
number under each plot shows the electric field in the gas gap
for MRPC. In both cases the gap size is 220 . The gas
mixture was 90% F134A, 5% isobutane and 5% SF6 in normal
conditions of pressure and temperature. The value of
used was 0.1 , derived from HEED program.
The charge distribution has an almost Gaussian form, especially
for the 10 gap MRPC. The left side of the distribution (very few
events at values near zero) is due to the fact that the MRPC
operates at high gain . This means that
avalanches starting in the middle of the gap width, which only
avalanche over half the distance, give a detectable signal. The
charge distribution is the superposition of several probability
distributions which, according to the central limit theorem, will
tend to a Gaussian form. The right side of the charge distribution
(the fact that the tails are not very long) indicates that indeed
the space charge effects stop the development of the avalanche.

Time Distribution Simulation: We then proceed to simulate
the time distribution of these same chambers. The electron drift
velocity can be obtained from HEED. When the total induced charge
signal is over threshold, the time is recorded. In this paper, the
threshold is 13 fc for the 6 gap MRPC and 26 fc for the 10 gap
MRPC. Fig.2 is the simulated results for a 6 gap chamber.
Figure 2.11 (a) is the simulated curve of the
electron drift velocity versus the electric field, which is
generated by Magboltz. Figure 2.11 (b) is the
time distribution of a 6 gap MRPC. The intrinsic time resolution
is only 19 ps or so. If we consider other contributions, such as
front-end electronics 30 ps, TDC resolution 25 ps, fanout start
signal 10 ps, beam size (1cm) 15 ps, we can get the MRPC
resolution is ps. This value
is similar to the experimental result [69, 39].
For a 10 gap MRPC, the intrinsic time resolution is about 15
ps.
From the simulation, we can get the bottom line of MRPC time
resolution ps. And we need to keep control of all these
contributions to ensure best time resolution.
MRPC for this tray installed in 2003
In 2003, for the MRPCs in the TOFr, the inner glass thickness is 0.54 mm, the outer glass is 1.1 mm. The gas gap is 0.22 mm. Both the volume resistivity () of the glass plates and the surface resistivity(2M ohm per square) of carbon layer at room temperature are presented in [75]. It is found the volume resistivity of the plate decreases with the temperature increasing. And the radiation will decrease the volume resistivity of the plate [75]. In order not to pollute the working gas of TPC, SF6 is not used as part of the working gas of TOFr. The working gas of MRPC-TOFr at STAR is 95% freon and 5% iso-butane at normal atmospheric pressure. The high voltage applied to the electrodes is 14.0 kV.
Chapter 3 Analysis Methods
3.1 Trigger
The detector used for these studies was the Solenoidal Tracker at RHIC (STAR). The main tracking device is the Time Projection Chamber (TPC) which provides momentum information and particle identification for charged particles up to GeV/c by measuring their ionization energy loss (dE/dx) [38]. Detailed descriptions of the TPC and d+Au run conditions have been presented in Ref. [36, 38]. A prototype time-of-flight detector (TOFr) based on multi-gap resistive plate chambers (MRPC) [39] was installed in STAR for the d+Au and p+p runs. It extends particle identification up to GeV/c for and .
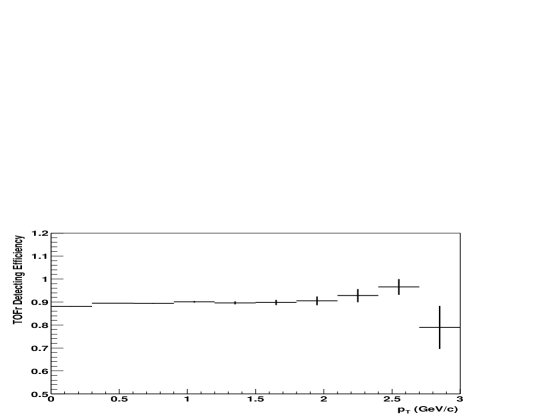
TOFr covers in azimuth and in pseudorapidity at a radius of cm. It contains 28 MRPC modules which were partially instrumented during the 2003 run. Since the acceptance of TOFr is small, a special trigger selected events with a valid pVPD coincidence and at least one TOFr hit. A total of 1.89 million and 1.08 million events were used for the analysis from TOFr triggered d+Au and non-singly diffractive (NSD) p+p collisions, representing an integrated luminosity of about 40 and 30 , respectively. Minimum-bias d+Au and p+p collisions that did not require pVPD and TOFr hits were also used to study the trigger bias and enhancement, and the TOFr efficiency and acceptance. The d+Au minimum-bias trigger required an equivalent energy deposition of about 15 GeV in the Zero Degree Calorimeter in the Au beam direction [36]. The trigger efficiency was determined to be . Minimum-bias p+p events were triggered by the coincidence of two beam-beam counters (BBC) covering [8]. The NSD cross section was measured to be mb by a van der Meer scan and PYTHIA [76] simulation of the BBC acceptance [8].
3.1.1 Centrality tagging
Centrality tagging of d+Au collisions was based on the charged particle multiplicity in , measured by the Forward Time Projection Chamber in the Au beam direction [36, 78]. The TOFr triggered d+Au events were divided into three centralities: most central , and of the hadronic cross section. The average number of binary collisions for each centrality class and for the combined minimum-bias event sample is derived from Glauber model calculations and listed in Table 3.1.
Table 3.1 also lists the uncorrected FTPC east reference multiplicity ranges for centrality definitions.
| Centrality Bin | Uncorr. FTPCRefMult Range | Uncorr. | |
|---|---|---|---|
| M.B. | 10.2 | ||
| 0%-20% | FTPCRefMult 17 | 17.58 | |
| 20%-40% | 10 FTPCRefMult 17 | 12.55 | |
| 40%-100% | 0 FTPCRefMult 10 | 6.17 |
3.1.2 Trigger bias study
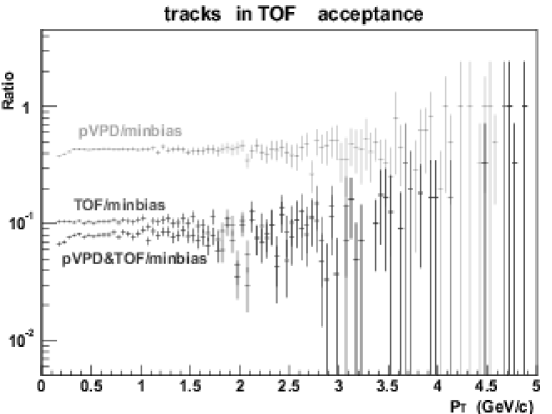
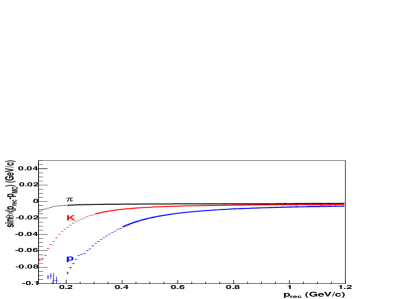
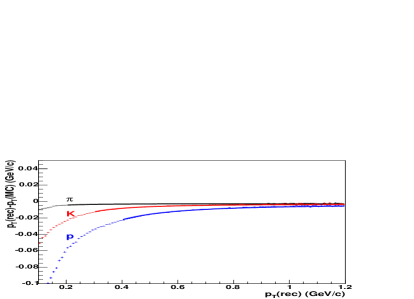
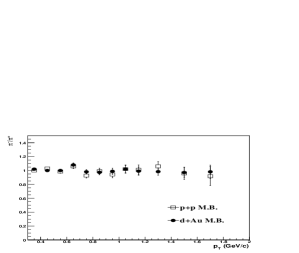
Since we set up a special trigger which selected events with a valid pVPD coincidence and at least one TOFr hit, the study of dependence of trigger bias is necessary. Figure 3.1 shows there is negligible trigger bias on dependence at 0.3 GeV/c from simulation. In this figure, pVPD means that pVPD is required to fire in minimum-bias collisions. TOF means that TOFr is required to fire in minimum-bias collisions, and pVPD TOF means that pVPD and TOFr are required to fire in minimum-bias collisions. From this figure, if we required pVPD and TOFr to fire, we can see the ratio is flat with when is larger than 0.3 GeV/c by comparison through the distribution in minimum-bias collisions. That means the trigger bias for distribution is negligible at 0.3 GeV/c.
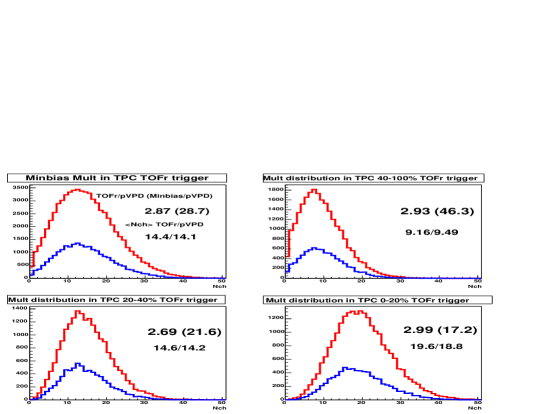
Minimum-bias d+Au and p+p collisions are used to study the trigger bias and enhancement. Figure 3.2 shows the trigger bias and enhancement in d+Au minimum-bias collisions and three centrality bins. In this figure, TOFr means that TOFr is required to fire in minimum-bias events. pVPD means that TOFr and pVPD are required to fire in minimum-bias events. Minbias means the minimum-bias triggered events. For enhancement study, TOFr/pVPD is the ratio of the number of events in which TOFr is required to fire over the number of events in which TOFr and pVPD are required to fire, and Minbias/pVPD is the ratio of the number of minimum-bias triggered events over the number of events in which TOFr and pVPD are required to fire. The enhancement factor for TOFr is (Minbias/pVPD)/(TOFr/pVPD). For example, in minimum-bias collision, Minbias/pVPD is equal to 28.7, while TOFr/pVPD is 2.87, so in minimum-bias collisions, the enhancement of TOFr trigger is 10. For bias study, TOFr/pVPD is the ratio of in the events where TOFr is required to fire over the in the events where TOFr and pVPD are required to fire. Since in our triggered events, TOFr and pVPD are required to fire, TOFr/pVPD is our bias factor. The curves in this figure show the charged particle multiplicity at mid-rapidity in TOFr events and in TOFr and pVPD events individually. Table 3.2 lists the enhancement factor and trigger bias in minimum-bias, centrality selected d+Au collisions and minimum-bias p+p collisions.
| Centrality Bin | TOFr triggered events | enhancement factor | bias |
|---|---|---|---|
| 0%-100% | 1.80 M | 10.0 | 1.02 |
| 0%-20% | 0.523 M | 5.75 | 1.04 |
| 20%-40% | 0.500 M | 8.03 | 1.03 |
| 40%-100% | 0.479 M | 15.8 | 0.965 |
| p+p | 0.995 M | 37.4 | 1.19 |
3.2 Track selection and calibration
The TPC and TOFr are two independent systems. In the analysis, hits from particles traversing the TPC were reconstructed as tracks with well defined geometry, momentum, and dE/dx [38]. The particle trajectory was then extended outward to the TOFr detector plane. The pad with the largest signal within one pad distance to the projected point was associated with the track for further time-of-flight and velocity () calculations.
3.2.1 Calibration
pVPD calibration
For TOFr, we use pVPD as our start-timing detector. In d+Au and p+p collisions, at least one east pVPD and one west pVPD were required to fire. In d+Au collisions, to calibrate east pVPD, we required 3 east pVPD to fire; to calibrate west pVPD, we required 3 west pVPD to fire. In p+p collisions, to calibrate east pVPD, we required 2 east pVPD to fire; to calibrate west pVPD, we required 2 west pVPD to fire. Let’s take the east pVPD calibration in d+Au collisions as an example. The label for 3 pVPD are pVPD1, pVPD2, pVPD3, the adc and tdc value for pVPD1 are , , and the slewing correction function is ; the adc and tdc value for pVPD2 are , , and the slewing correction function is ; the adc and tdc value for pVPD3 are , , and the slewing correction function is . We use vs to get the slewing correction for pVPD1; use vs to get the slewing correction for pVPD2; use vs to get the slewing correction for pVPD3. At the beginning, , we got 3 curves of vs , vs and vs . The 3 curves corresponded to the 3 slewing functions ; For the second step, , also plot vs , vs and vs . And we got the new three slewing curves . For the third step, , also plot vs , vs and vs . And we got another new three slewing curves . And so on and so forth till the resolution of and converged. The looping method is to subtract the correlation of different pVPD tubes in the same direction. The function for the slewing correction we use is . In Figure 3.3, the left plot shows the pVPD2 slewing plot and the right plot shows that the timing is independent on the ADC value after the slewing correction.
After the slewing correction, we got the corrected timing of east pVPD and west pVPD. For each side, the timing difference should be shifted to zero. That’s to say the mean value in the distribution of and were shifted to zero. Also we need to correct for the effect caused by the different numbers of fired pVPD in different events. What we did was shifting the mean value of the distribution of ( to zero, where the , means the sum of the corrected timing of east fired pVPD and west fired pVPD respectively, means the number of east fired pVPD and west fired pVPD, is the value of primary vertex of the event, and is the light velocity.
TOFr calibration
After the slewing correction for pVPD, we use this variable as our start timing:
| (3.1) |
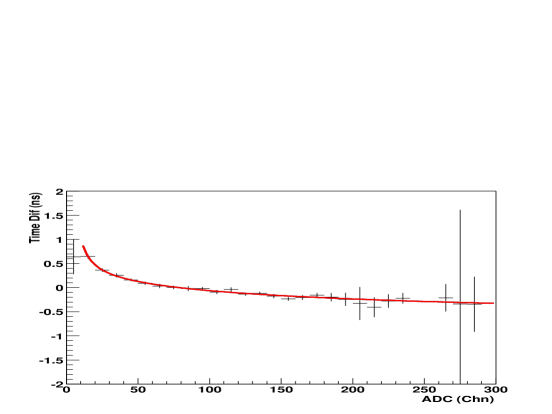

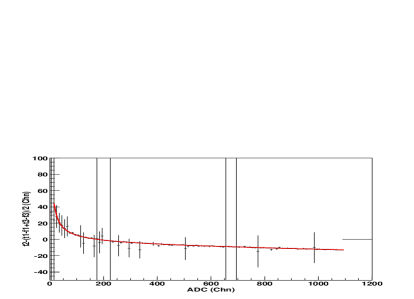
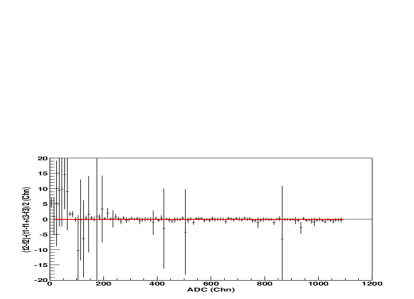
The difference between TOFr timing and start timing is our time of flight . To calibrate the , the pure pion sample was chosen by selecting the particle energy loss in TPC at GeV/cm in the momentum range GeV/c. Figure 3.4 shows dE/dx vs plot from d+Au collisions. Firstly the so called correction was done due to the different cable lengths for different read-out channels, which was done by shifting the mean value of the distribution of to zero channel by channel, where is the calculation timing assuming the particle was pion particle. Secondly, the slewing correction due to correlation between timing and signal amplitude of the electronics was done by getting the curve of vs for each channel, where the was the time of flight after the correction and was the ADC value of TOFr. The slewing curve is like the plot shown in Figure 3.5. The function of the slewing correction is .
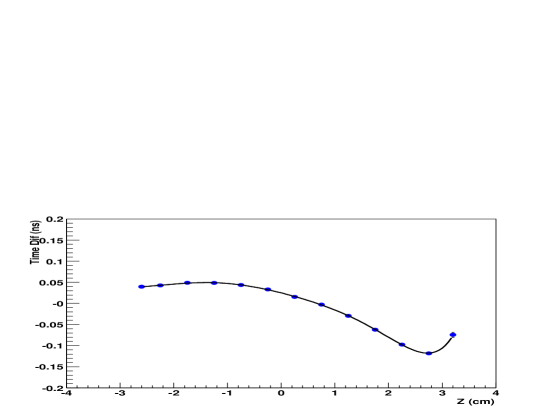
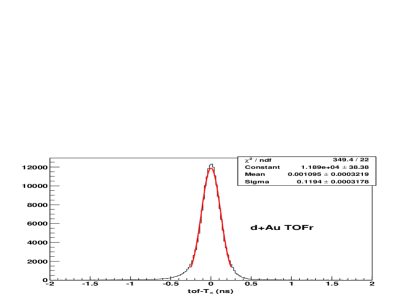
The z position correction was also done since the different hit positions on the read-out strip will generate different transmission timing. This was done by getting the function of versus , where the is the time of flight after the and slewing correction, and is the the hit local z position of the TOFr. The function for the z position correction is . The z position correction for all the channels is shown in Figure 3.6. After the z position was done, the calibration for TOFr was finished. The overall resolution of TOFr was 120 ps and 160 ps in d+Au and p+p collisions respectively, where the effective timing resolution of the pVPDs was 85 ps and 140 ps, respectively. Figure 3.7 shows the overall resolution of TOFr in d+Au and p+p collisions.
3.3 Raw yield
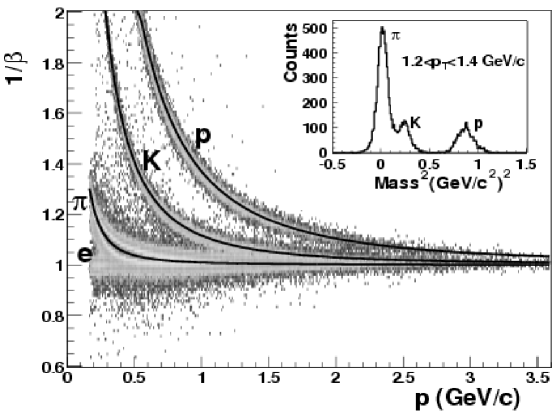
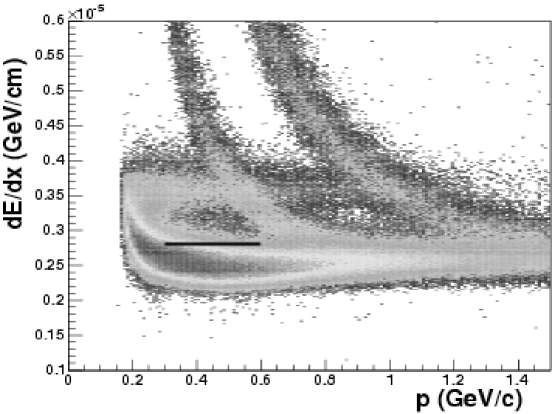
From the timing information from TOFr after the calibration and the pathlength from TPC, the velocity of the particle can be easily got by . Figure 3.8 shows from TOFr measurement as a function of momentum () calculated from TPC tracking in TOFr triggered d+Au collisions. The raw yields of , , and are obtained from Gaussian fits to the distributions in in each bin.
3.3.1 raw yield extraction
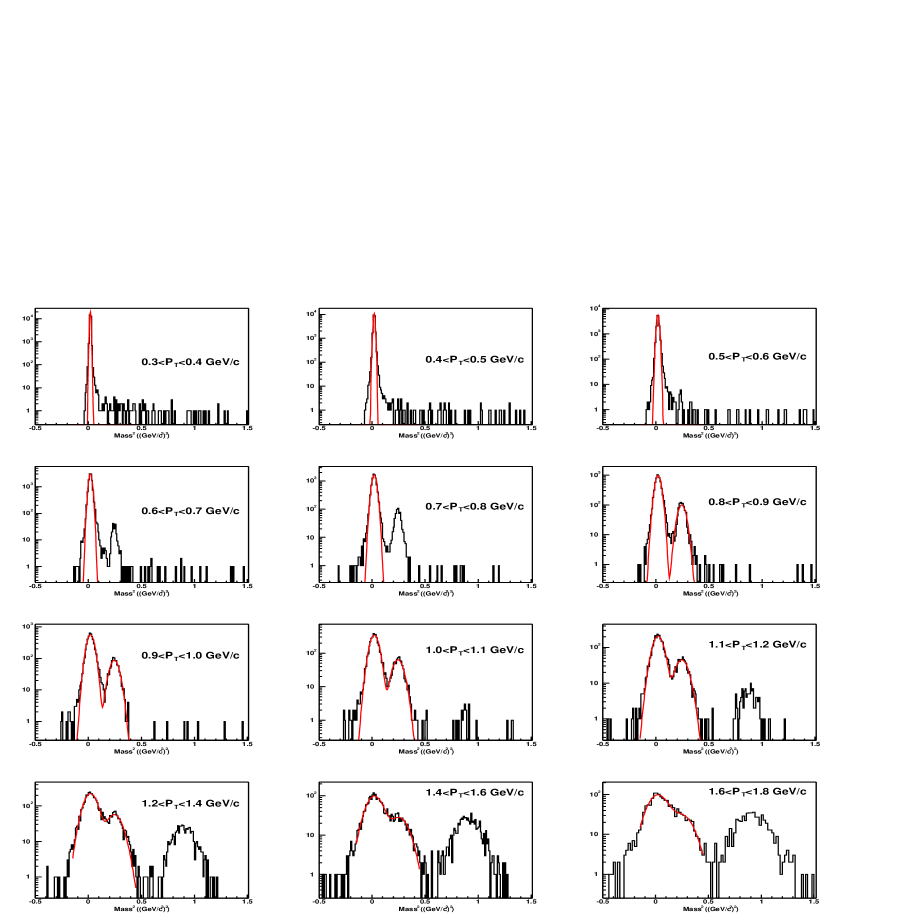
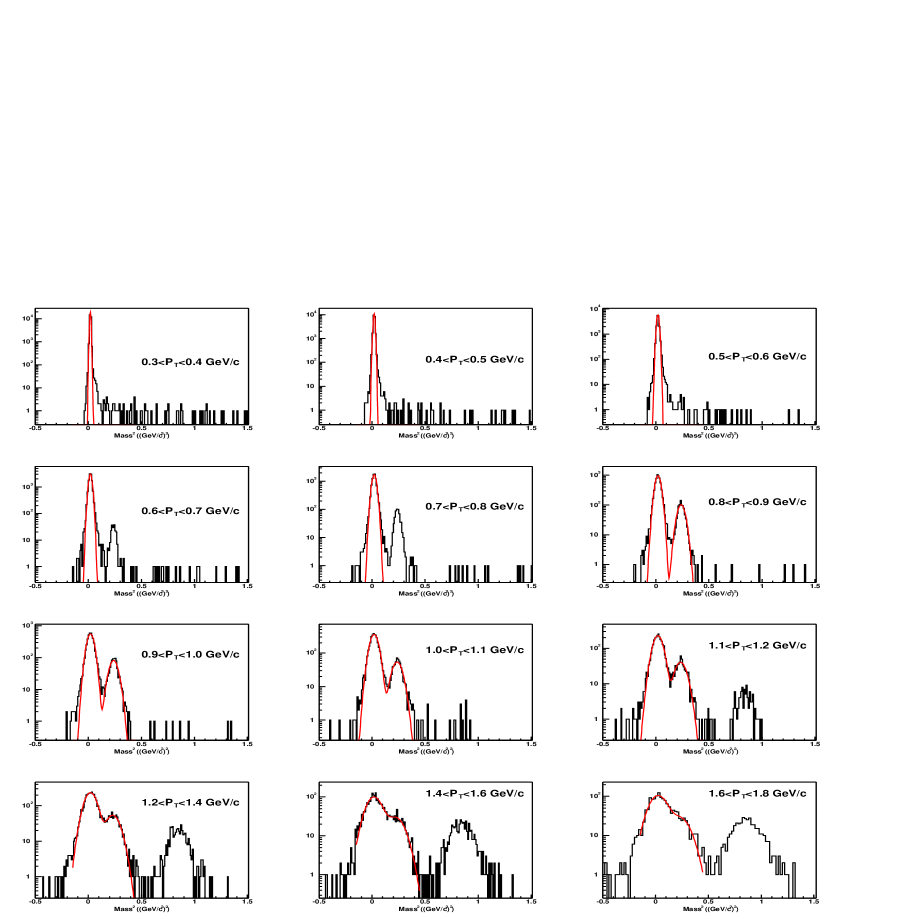
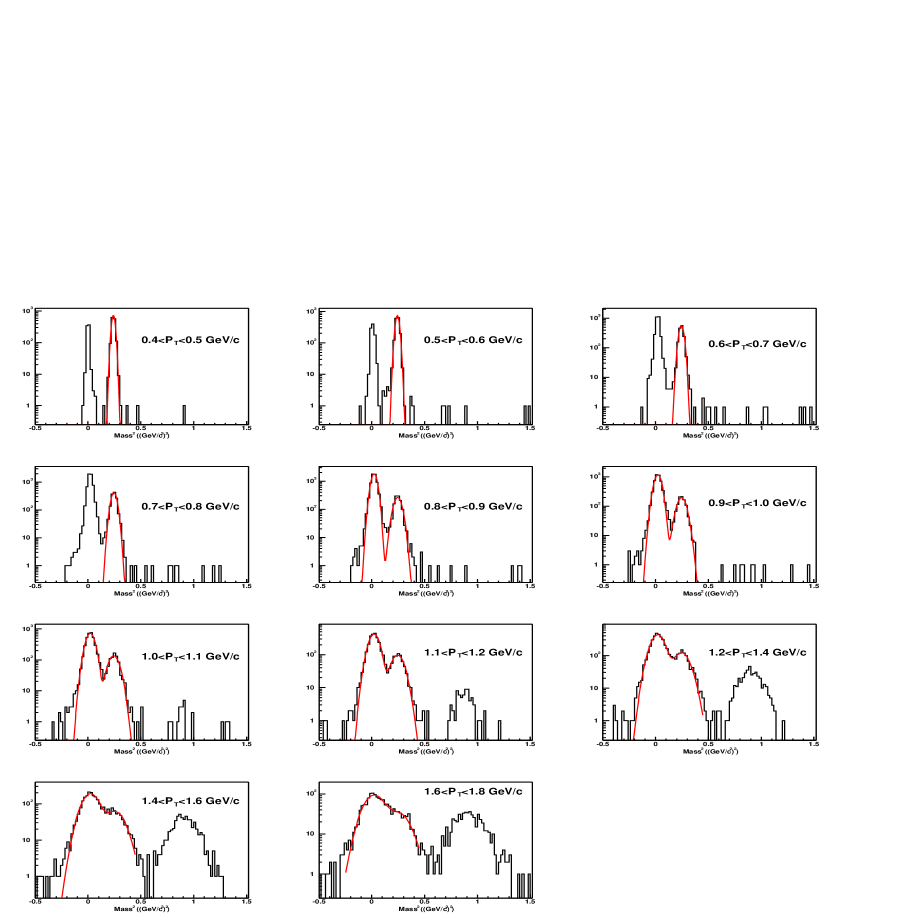
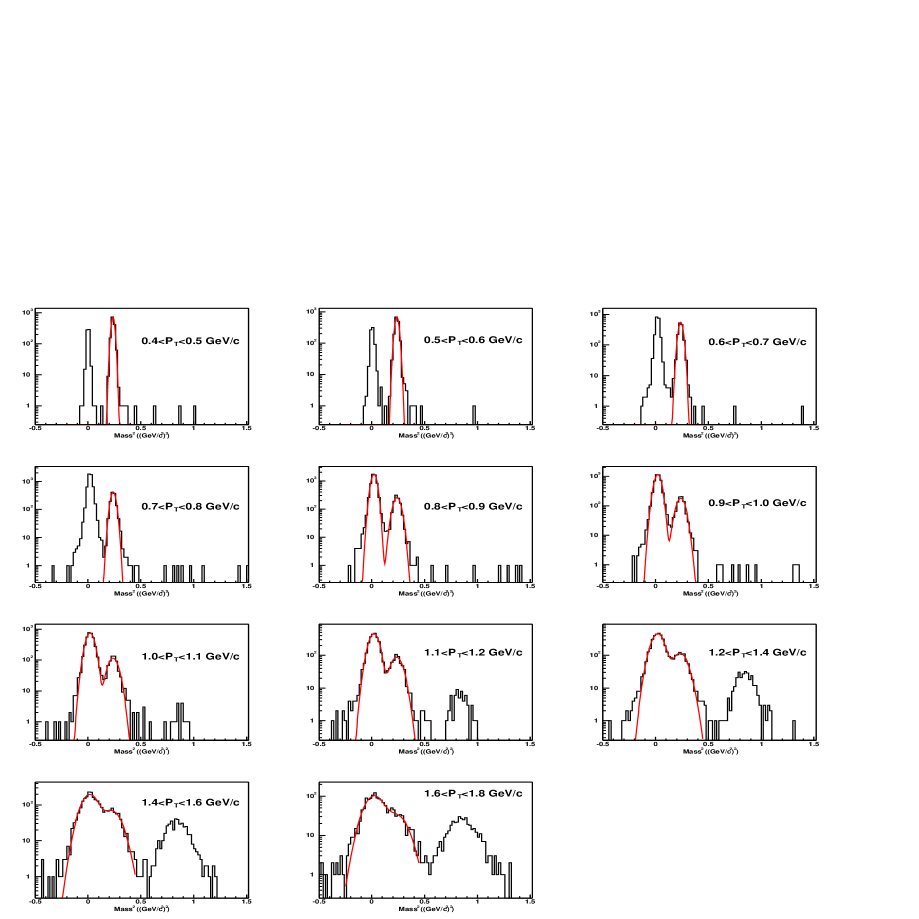
For , the rapidity range is . After was required, the mass squared distributions in different bin in d+Au minimum-bias collisions are shown is Figure 3.16 and Figure 3.17. At GeV/c, the single Gaussian function was used to fit the distribution of to get the raw yield. At the same time, the counting result by counting the track number at the range was also used to compare with the raw yield from the fitting method. The difference between them was found in one sigma range. The raw yield we quote is from the fitting method. At GeV/c, the double Gaussian function was used to extract the raw yield. The raw signals in each bin are shown in Table 3.3 and Table 3.4. Also shown in the tables are those in centrality selected d+Au collisions and minimum-bias p+p collisions.
3.3.2 raw yield extraction
For , the rapidity range is . After was required, the mass squared distributions in different bin in d+Au minimum-bias collisions are shown is Figure 3.18 and Figure 3.19. At GeV/c, the single Gaussian function was used to fit the distribution of to get the raw yield. At the same time, the counting result by counting the track number at the range was also used to compare with the raw yield from the fitting method. The difference between them was found in one sigma range. The raw yield we quote is from the fitting method. At GeV/c, the double Gaussian function was used to extract the raw yield. The raw signals in each bin are shown in Table 3.5 and Table 3.6. Also shown in the tables are those in centrality selected d+Au collisions and minimum-bias p+p collisions.
3.3.3 and raw yield extraction
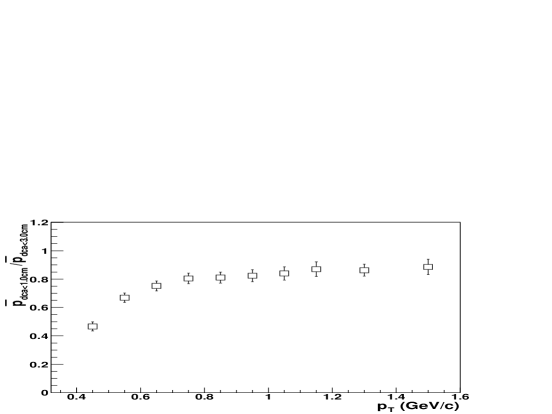
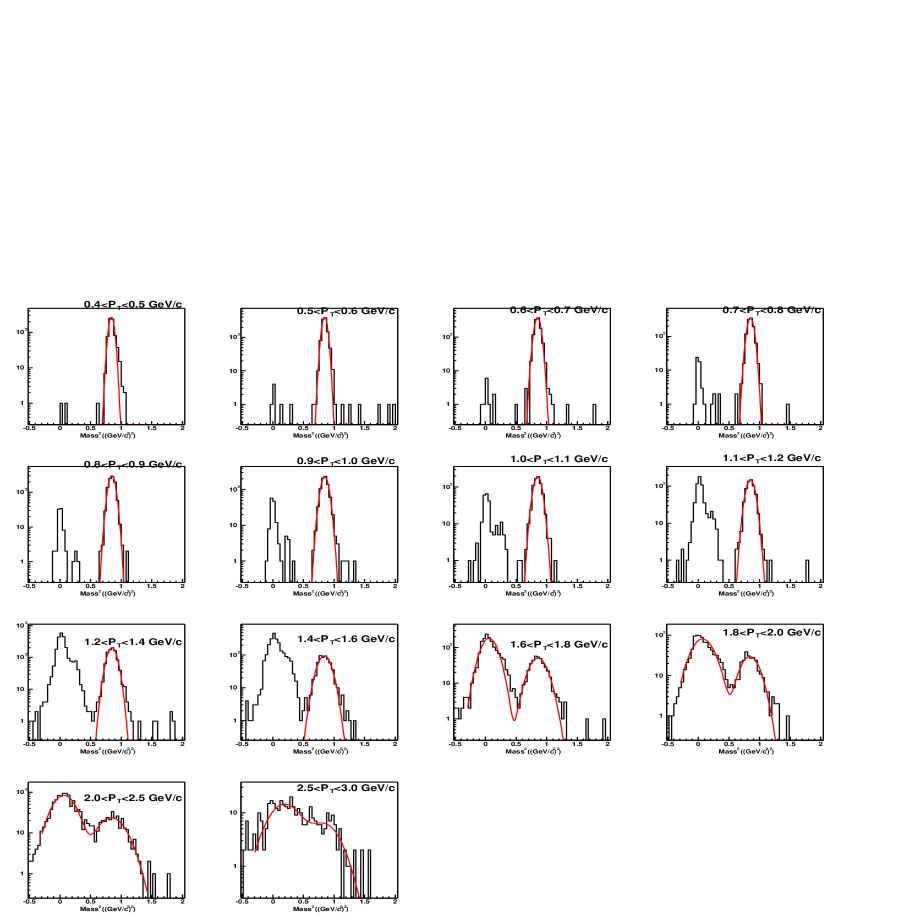
For , the rapidity range is . After was required, the mass squared distributions in different bin in d+Au minimum-bias collisions are shown is Figure 3.21. At GeV/c, the single Gaussian function was used to fit the distribution of to get the raw yield. At the same time, the counting result by counting the track number at the range was also used to compare with the raw yield from the fitting method. The difference between them was found in one sigma range. The raw yield we quote is from the fitting method. At GeV/c, the double Gaussian function was used to extract the raw yield. The raw signals in each bin are shown in Table 3.8. For the , the raw yield extraction method is the same as except that at GeV/c, we use the method to reject the background, where and are the number of the and tracks individually, and is the ratio of tracks at cm over those at cm. In Figure 3.20, the first 10 bins are for cm, the last 4 bins are for cm. Figure 3.9 shows the ratio of tracks at cm over those at cm. After this correction of , the raw signals in each bin are shown in Table 3.7.
3.4 Efficiency and acceptance correction
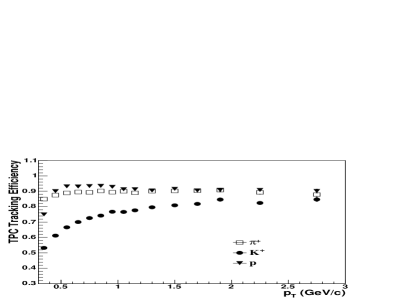


Acceptance and efficiency were studied by Monte Carlo simulations and by matching TPC track and TOFr hits in real data. TPC tracking efficiency was studied by Monte Carlo simulations. The simulated , , and are generated using a flat and a flat distribution and pass through GSTAR [82] (the framework software package to run the STAR detector simulation using GEANT [84, 85]) and TRS (the TPC Response Simulator [82]). The simulated , , and are then combined with a real raw event and we call this combined event a simulated event. This simulated event is then passed through the standard STAR reconstruction chain and we call this event after reconstruction a reconstructed event. The reconstructed information of those particles in the reconstructed event is then associated with the Monte-Carlo information in the simulated event. And then we get the total number of simulated , , and from simulated events in a certain transverse momentum bin. Also we can get the total number of associated tracks in the reconstructed events in this transverse momentum bin [81]. In the end, take the ratio of the number of associated , , and over the number of simulated , , and and this ratio is the TPC reconstruction efficiency for a certain transverse momentum bin in the mid-rapidity range. Figure 3.10 shows the TPC reconstruction efficiency of , , and as a function of .
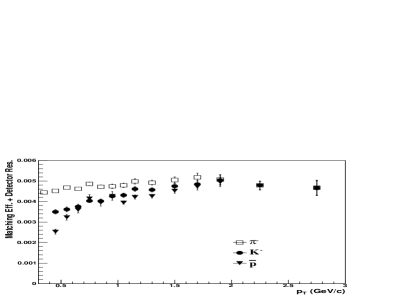
The Matching Efficiency from TPC to TOFr were studied in real data, and the formula are
| (3.2) |
where the is the number of TOFr matched tracks per dAuTOFr trigger event, is the number of minimum-bias tracks per minimum-bias event by requiring the pVPD to fire, is the enhancement factor of dAuTOFr trigger, and is the other factors such as the TOFr trip factor. The includes the detector response efficiency. Figure 3.11 shows the matching efficiency of different particle species including the detector response versus . The detector response efficiency, including the material absorption and scattering effect between TPC and TOFr, as a function of is shown in Figure 3.12, which is around 90% at 0.3 GeV/c. After the material absorption and scattering effect correction, the detector response efficiency is around 95%.
3.5 Background correction
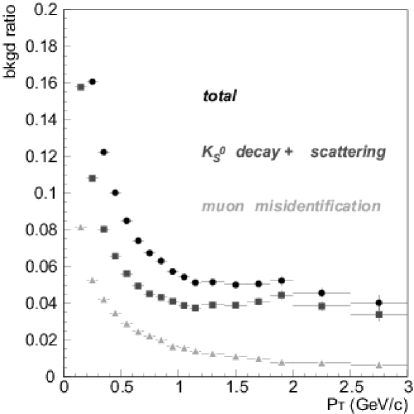
Weak-decay feeddown (e.g. ) to pions is at low and at high , and was corrected for using PYTHIA [76] and HIJING [77] simulations, as shown in Figure 3.13. For spectra, the misidentification was also corrected for, which is also shown in Figure 3.13.
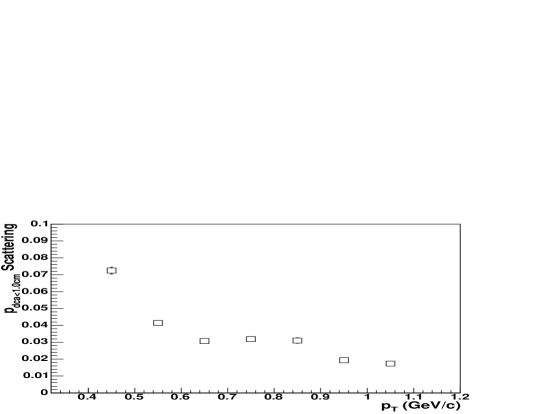
Inclusive and production is presented without hyperon feeddown correction. and from hyperon decays have the same detection efficiency as primary and [79] and contribute about 20% to the inclusive and yield, as estimated from the simulation. However, for , there is still some scattering contribution which comes from the beam pipe interaction after the cut of cm. Figure 3.14 shows the contribution of scattering effect for proton when we cut cm. The correction is done at 1.1 GeV/c and negligible at higher .
3.6 Energy loss correction
The energy loss effect due to the interaction with the detector material was also corrected for. This was studied by simulation. Figure 3.15 shows the momentum and transverse momentum correction for energy loss effect. At 0.35 GeV/c, for , the energy loss effect is negligible while for kaon and proton, the energy loss correction is non-negligible at lower and negligible at higher . The correction was done by shifting the position of in the spectra.
3.7 Normalization
The efficiency including vertex efficiency and trigger efficiency is 91% in d+Au minimum-bias collisions and 85% in p+p and 40-100% d+Au collisions. In 0%-20% and 20%-40% d+Au collisions, the efficiency is 100%. Since the statistic of p+p minimum-bias events in run 3 is not good enough for us to get very precise enhancement factor and bias factor. We compare the spectra in the first 5 bin with those from the paper [35] and get the additional normalization factor for p+p collisions.

| (GeV/c) | d+Au Trigger | 0%-20% | 20%-40% | 40%-100% | p+p |
|---|---|---|---|---|---|
| 0.3-0.4 | |||||
| 0.4-0.5 | |||||
| 0.5-0.6 | |||||
| 0.6-0.7 | |||||
| 0.7-0.8 | |||||
| 0.8-0.9 | |||||
| 0.9-1 | |||||
| 1-1.1 | |||||
| 1.1-1.2 | |||||
| 1.2-1.4 | |||||
| 1.4-1.6 | |||||
| 1.6-1.8 |
| (GeV/c) | d+Au Trigger | 0%-20% | 20%-40% | 40%-100% | p+p |
|---|---|---|---|---|---|
| 0.3-0.4 | |||||
| 0.4-0.5 | |||||
| 0.5-0.6 | |||||
| 0.6-0.7 | |||||
| 0.7-0.8 | |||||
| 0.8-0.9 | |||||
| 0.9-1 | |||||
| 1-1.1 | |||||
| 1.1-1.2 | |||||
| 1.2-1.4 | |||||
| 1.4-1.6 | |||||
| 1.6-1.8 |
| (GeV/c) | d+Au Trigger | 0%-20% | 20%-40% | 40%-100% | p+p |
|---|---|---|---|---|---|
| 0.4-0.5 | |||||
| 0.5-0.6 | |||||
| 0.6-0.7 | |||||
| 0.7-0.8 | |||||
| 0.8-0.9 | |||||
| 0.9-1 | |||||
| 1-1.1 | |||||
| 1.1-1.2 | |||||
| 1.2-1.4 | |||||
| 1.4-1.6 | |||||
| 1.6-1.8 |
| (GeV/c) | d+Au Trigger | 0%-20% | 20%-40% | 40%-100% | p+p |
|---|---|---|---|---|---|
| 0.4-0.5 | |||||
| 0.5-0.6 | |||||
| 0.6-0.7 | |||||
| 0.7-0.8 | |||||
| 0.8-0.9 | |||||
| 0.9-1 | |||||
| 1-1.1 | |||||
| 1.1-1.2 | |||||
| 1.2-1.4 | |||||
| 1.4-1.6 | |||||
| 1.6-1.8 |
| (GeV/c) | d+Au Trigger | 0%-20% | 20%-40% | 40%-100% | p+p |
|---|---|---|---|---|---|
| 0.4-0.5 | |||||
| 0.5-0.6 | |||||
| 0.6-0.7 | |||||
| 0.7-0.8 | |||||
| 0.8-0.9 | |||||
| 0.9-1 | |||||
| 1-1.1 | |||||
| 1.1-1.2 | |||||
| 1.2-1.4 | |||||
| 1.4-1.6 | |||||
| 1.6-1.8 | |||||
| 1.8-2 | |||||
| 2-2.5 | |||||
| 2.5-3 | |||||
| 3-4 |
Chapter 4 Results
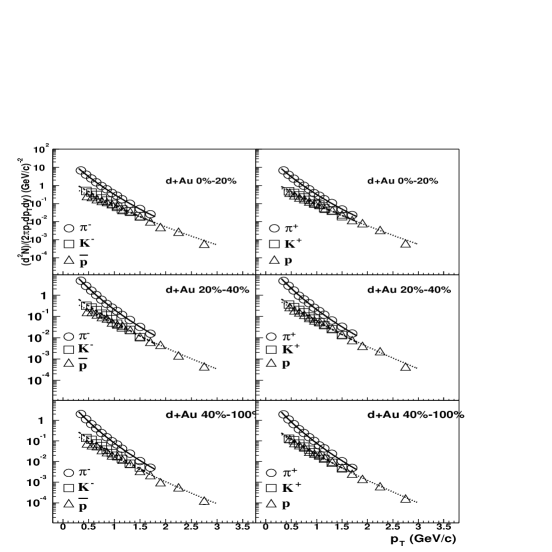
4.1 and spectra in d+Au and p+p collisions at mid-rapidity
The invariant yields of , , and from both NSD p+p and minimum-bias d+Au events at mid-rapidity are shown in Figure4.1, where is the corrected signal number per minimum-bias event in each bin. , where is the raw signal number in each bin, is the total TOFr triggered events, is the enhancement factor of TOFr trigger, is the TPC efficiency times TOFr matching efficiency, is the background correction factor, is the bias factor, and is the vertex efficiency times trigger efficiency and normalization factor.
4.1.1 Systematic uncertainty
For the invariant yield of , , and , the average bin-to-bin systematic uncertainty was estimated to be of the order of 8%. The systematic uncertainty is dominated by the uncertainty in the detector response in Monte Carlo simulations (). Additional factors contributing to the total systematic uncertainty include the background correction (), the small acceptance of the TOFr (), TOFr response (), the correction for energy loss in the detector ( at GeV/c for the and , much smaller for other species and negligible at higher ), absorption of in the material (), and the momentum resolution correction (). The normalization uncertainties in d+Au minimum-bias and p+p NSD collisions are and , respectively [8, 36]. The charged pion yields are consistent with yields measured by the PHENIX collaboration in the overlapping range [17, 37]. The invariant yields of , , and in minimum-bias, centrality selected d+Au and minimum-bias p+p collisions, are listed in the tables in Appendix A with statistical errors and systematic uncertainties.
4.2 Cronin effect
Nuclear effects on hadron production in d+Au collisions are measured through comparison to the p+p spectrum, scaled by the number of underlying nucleon-nucleon inelastic collisions using the ratio
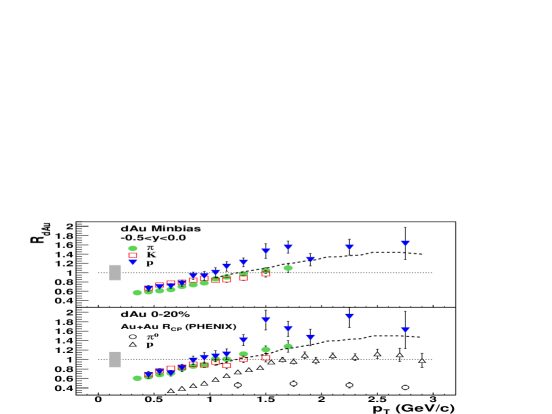
where describes the nuclear geometry, and for p+p inelastic collisions is derived from the measured p+p NSD cross section. The difference between NSD and inelastic differential cross sections at mid-rapidity, as estimated from PYTHIA [76], is at low and negligible at GeV/c. Figure. 4.2 shows of , and for minimum-bias and central d+Au collisions. The systematic uncertainties on are of the order of 16%, dominated by the uncertainty in normalization. The of the same particle species are similar between minimum-bias and top 20% d+Au collisions. In both cases, the of protons rise faster than of pions and kaons. We observe that the spectra of , , and are considerably harder in d+Au than those in p+p collisions. The of the identified particles has characteristics of the Cronin effect [28, 30] in particle production with less than unity at low and above unity at GeV/c.
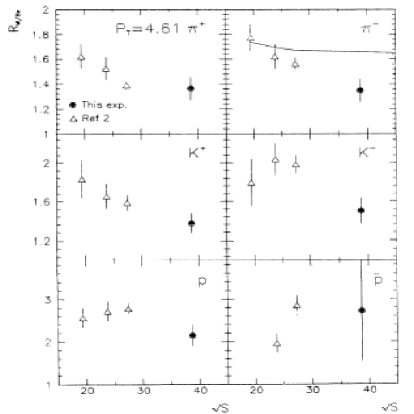
4.3 ratio in d+Au and p+p collisions at middle pseudo-rapidity
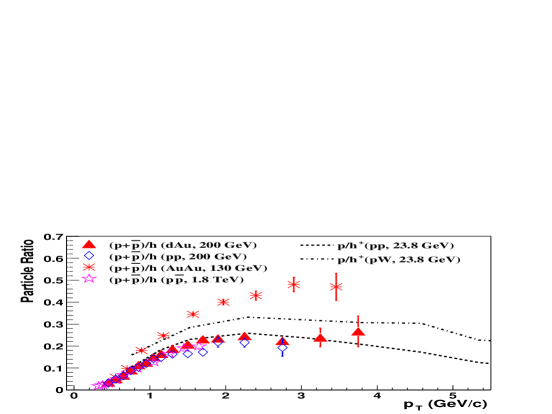
Figure 4.3 depicts , the ratio of
over inclusive charged hadrons as a function of
in d+Au and p+p minimum-bias collisions at
GeV, and ratios in p+p and p+W
minimum-bias collisions at
GeV [28]. Although the relative yields of particles and
anti-particles are very different at GeV due to the
valence quark effects from target and projectile, the Cronin
effects are similar. The systematic uncertainties on these ratios
were estimated to be of the order of 10% for
GeV/c, decreasing to 3% at higher
. At RHIC energies, the anti-particle to particle ratios
approach unity ( in d+Au
minimum-bias collisions) and their nuclear modification factors
are similar. The difference between at GeV for and can be obtained from the
ratios in d+Au and p+p collisions.
Table 4.1 shows
determined by averaging over the bins within
GeV/c. At lower energy, the parameter in the power law
dependence on target atomic weight of identified
particle production falls with [28]. From the
ratios of between and , we may further
derive the for GeV/c
to be (stat)(syst) under the assumptions
that and that
and are between 0.1 and 0.4 in p+p collisions. This
result is significantly smaller than the value in
the same range found at lower energies [28].
| centrality | ||||
|---|---|---|---|---|
| min. bias | ||||
| 0–20% | ||||
| 20–40% | ||||
| 40–100% | ||||
| p+p | — | |||
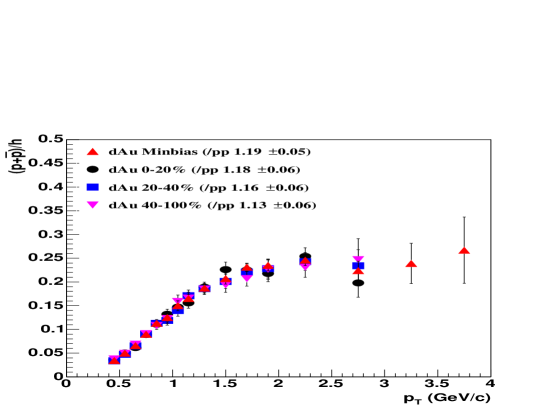
Also shown is ratio from the Au+Au minimum-bias collisions at GeV [18]. The ratio from minimum-bias Au+Au collisions [18] at a similar energy is about a factor of 2 higher than that in d+Au and p+p collisions for GeV/c. This enhancement is most likely due to final-state effects in Au+Au collisions [9, 24, 19, 20, 22, 23]. The ratios show little centrality dependence in d+Au collisions, as shown in Table 4.1 and Figure 4.4. For GeV/c, the ratio in collisions at TeV [80] is very similar to those in d+Au and p+p collisions at GeV.
4.4 , and anti-particle to particle ratios

| Centrality Bin | / | / | ||||
|---|---|---|---|---|---|---|
| d+Au M.B. | ||||||
| 0%-20% | ||||||
| 20%-40% | ||||||
| 40%-100% | ||||||
| p+p |
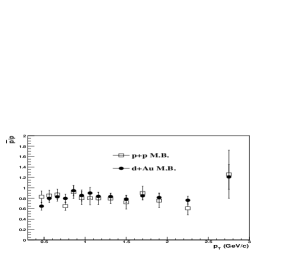
Figure 4.5 shows the , and ratios as a function of in d+Au and p+p minimum-bias collisions. It shows the anti-particle to particle ratios are flat with . The zero order polynominal function was used to fit the data and get the anti-particle to particle ratios. The results are list in Table 4.2. In centrality selected d+Au collisions, the anti-particle to particle ratios are also flat with and show little centrality dependence. The results are also shown in the Table 4.2.

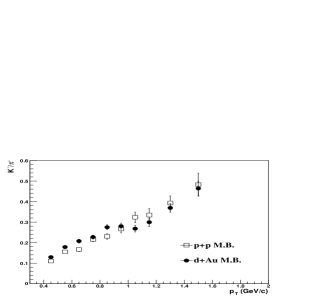
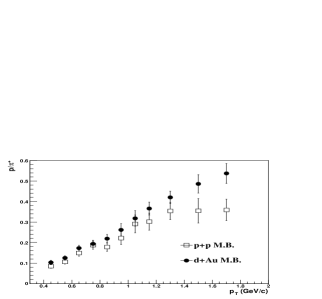

The and ratios are shown in Figure 4.6 and Figure 4.7 individually. From the plots, the ratios increase with in both d+Au and p+p collisions and the increasing trend is the same within our errors. The ratios increase with in both d+Au and p+p collisions and the increasing in d+Au collisions is faster than that in p+p collisions. The trends of the and as a function of show little centrality dependence in d+Au collisions.
4.5 , , and model fits
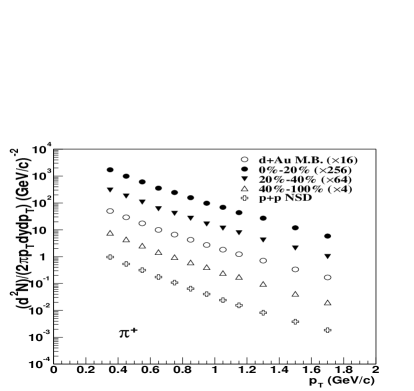


The spectra in minimum-bias and centrality selected d+Au collisions and also in p+p collisions are shown in Figure 4.8, Figure 4.9 and Figure 4.10. The spectra show little centrality dependence for each particle in d+Au collisions but harder than those in p+p collisions. The power law function was used to fit the spectra and get the and . The power law fit function is:
| (4.1) |
Where the parameter is a constant value proportional to the mid-rapidity yield , the parameter is the order of the power law and is the mean value of the transverse momentum which is extracted from the fit. Figure 4.11 shows power law fit to the spectra of minimum-bias d+Au and p+p collisions. Figure 4.12 shows power law fit to the spectra of 3 centrality selected d+Au collisions. The power law fit results are listed in Table 4.4 and Table 4.3 individually. The thermal model [34] was also used to fit the spectra. The final and are shown in Table 4.6 and Table 4.5 respectively, which were obtained by averaging the results from the power law fit and thermal fit. Half of the differences in them are taken as the systematic errors due to the extrapolation to low region. The errors in this table include the systematic uncertainties and statistical errors.
| Centrality Bin | ||||||
|---|---|---|---|---|---|---|
| d+Au M.B. | ||||||
| 0%-20% | ||||||
| 20%-40% | ||||||
| 40%-100% | ||||||
| p+p |
| Centrality Bin | ||||||
|---|---|---|---|---|---|---|
| d+Au M.B. | ||||||
| 0%-20% | ||||||
| 20%-40% | ||||||
| 40%-100% | ||||||
| p+p |
| Centrality Bin | ||||||
|---|---|---|---|---|---|---|
| d+Au M.B. | ||||||
| 0%-20% | ||||||
| 20%-40% | ||||||
| 40%-100% | ||||||
| p+p |
| Centrality Bin | ||||||
|---|---|---|---|---|---|---|
| d+Au M.B. | ||||||
| 0%-20% | ||||||
| 20%-40% | ||||||
| 40%-100% | ||||||
| p+p |


4.6 System comparison
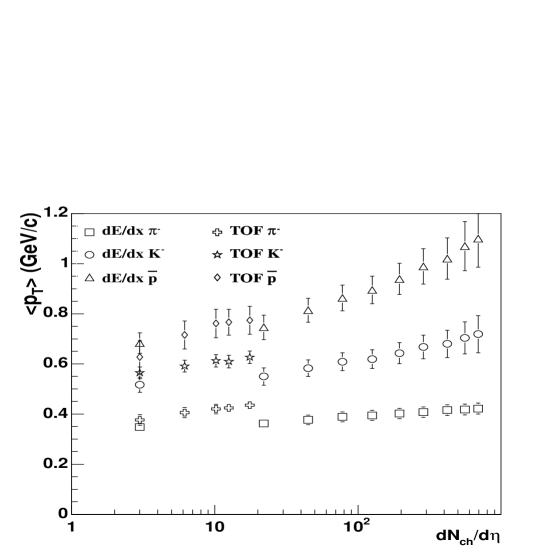
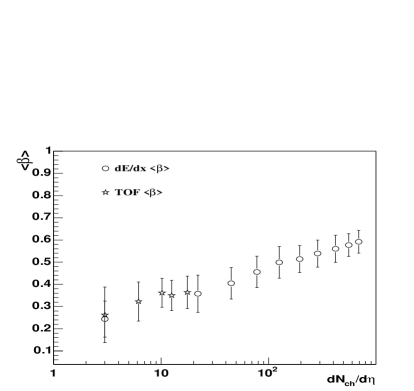
Figure 4.13 shows the of , and as a function of charged particle multiplicity at mid-rapidity. From p+p to d+Au collisions, the increase with charged particle multiplicity smoothly. We observed the in 0%-20% d+Au collisions are larger than those in peripheral Au+Au collisions.
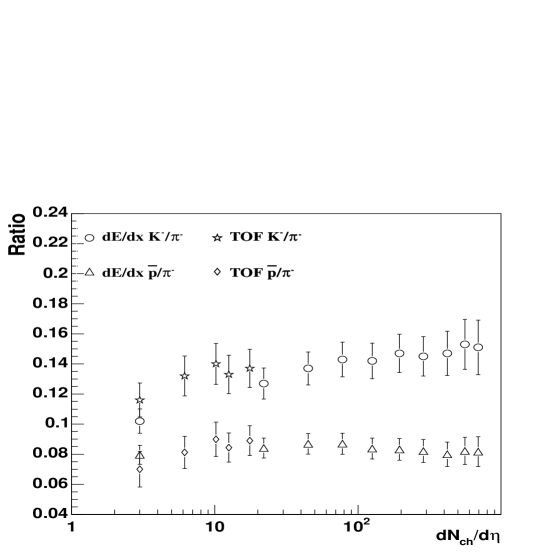
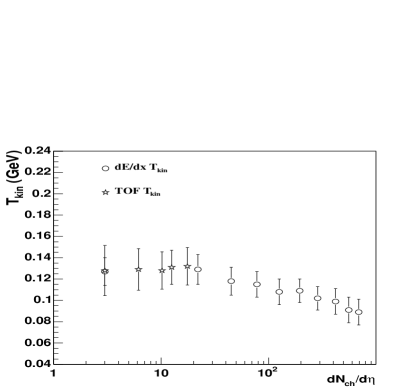
The and as a function of charged particle multiplicity at mid-rapidity are shown in Figure 4.14. The and ratios were derived by taking the ratios of the dN/dy of or over the dN/dy of in table 4.6. These ratios increase with charged particle multiplicity from p+p, d+Au to Au+Au collisions smoothly. The kinetic freeze out temperature and flow velocity from thermal fit as a function of charged particle multiplicity are shown in Figure 4.15. We can see the is flat from p+p to d+Au and then decreases from d+Au to Au+Au collisions and the increases from p+p, d+Au to Au+Au collisions.
Chapter 5 Discussion
5.1 Cronin effect
The identified particle spectra in d+Au and p+p collisions not only provide the reference for those in Au+Au collisions at 200 GeV, but also provide a chance to see the mechanism of the Cronin effect itself clearly. Cronin effect was observed 30 years ago [28]. It is the enhancement of particle production at high . The enhancement was explained by initial multiple parton scattering. Also the recent experimental results of Cronin effect on inclusive charged hadron are consistent with the predictions based on initial multiple parton scattering [30]. It suggests the suppression at intermediate in Au+Au collisions is due to final state effects. However, the initial multiple parton scattering with the independent fragmentation function will result in the same Cronin effect for and for pions, while experimentally the Cronin effect for is larger than that for . That’s to say the initial multiple scattering with the independent fragmentation function can’t account for the Cronin effect observed. Maybe in the initial multiple parton scattering, the broadening for gluon and for quark/antiquark are not the same [88]. Or maybe the fragmentation processes in p+A collisions are not the same as those in p+p collisions [89]. Whether the Cronin effect is initial state effect or final state effect will be discussed below.
5.1.1 Model comparison: initial state effect?
The initial multiple parton scattering model predicts that the Cronin effect on deuteron beam outgoing side is larger than that on Au beam outgoing side since the deuteron traverses a much larger nucleus [87]. Figure 5.1 (left) shows the predictions for the Cronin effect at different rapidity range. The different curves correspond to the prediction results from different shadowings. The is on the deuteron beam outgoing side. The is on the Au beam outgoing side. The is at mid-rapidity. We can see that the on deuteron beam side () increases faster than that on Au beam side (). If we take the ratio of on Au beam side over on deuteron beam side, it will result in a minimum value at GeV/c, as shown in the curves on the right plot of Figure 5.1. The solid symbol on the right plot of Figure 5.1 represents the data points [90], which is the ratio of on Au beam side at over on deuteron beam side at . We observe the asymmetry from experiment reaches a maximum value firstly and then decreases. This is different from the predictions. That means, the model based on initial multiple parton scattering only, can’t reproduce the experimental results. Recently, Qiu and Vitev have come up with the idea of coherent multiple scattering and applied it to the RHIC experiments [91]. In this picture, the hard probe may interact coherently with many low x parton inside different nucleons inside the nucleus. As a result, this process will lead to the suppression of the total cross section. This coherent effect will play an important role in p+A collisions at forward rapidity. In the deuteron outgoing beam direction, the coherent effect is non-negligible since the Au nucleus is big while on the Au side, the coherent effect is not big since the deuteron is of a small size. This will result in bigger suppression on the deuteron side than on the Au side. It may qualitatively reproduce the data. This coherent multiple scattering is a final-state effect.
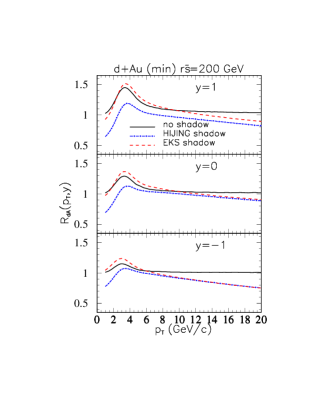
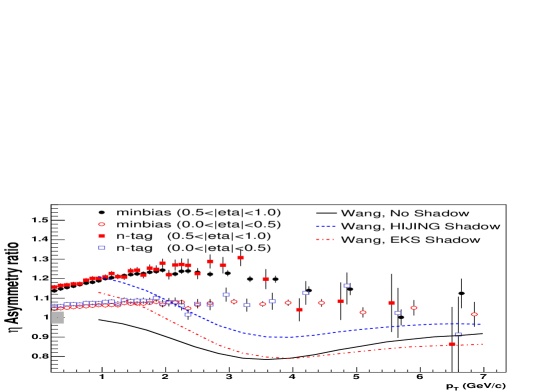
As we all known, in Au+Au collisions, the suppression at intermediate can be reproduced by the initial multiple scattering and jet quenching qualitatively [8, 9]. However, the model based on the initial multiple scattering, jet quenching and independent fragmentation will result in the same suppression for baryons and mesons at intermediate in Au+Au collisions. Experimentally for baryons are larger than for mesons at intermediate . This difference can be reproduced by coalescence or recombination models [21, 22, 23]. Recently the recombination model [92] has been applied to d+Au system to see whether it can reproduce the Cronin effect or not.
5.1.2 Model comparison: recombination
The inclusive distribution for the production of pions can be written in the recombination model [92], when mass effects are negligible, in the invariant form
| (5.1) |
where is the joint distribution of a and at and , and is the recombination function for forming a pion at : . depends on the colliding hadron/nuclei. In general, has four contributing components represented schematically by
| (5.2) |
where denotes thermal distribution and shower distribution. signifies two shower partons in the same hard-parton jet, while stands for two shower partons from two nearby jets [92].
For collisions it may not be appropriate to refer to any partons as thermal in the sense of a hot plasma as in heavy-ion collisions. Here in d+Au collisions, the symbol represents the soft parton distribution at low . At low the observed pion distribution is exponential; we identify it with the contribution of the term [92].
| (5.3) |
where is the inverse slope. We shall determine and by fitting the d+Au data at low . The pion spectra for different centralities can be calculated from thermal-thermal (), thermal-shower () and shower-shower () contributions by using parameters and : , where C is determined by fitting the d+Au data at GeV/c, and is the number of binary collisions. The data points of and are from Prof. C.B. Yang [93]. The values for minimum-bias, 0-20%, 20-40% and 40-100% d+Au collisions are 8.85, 13.08, 10.96 and 6.84 individually. The value of 0.21 GeV is used in the low fit. Figure 5.2 shows the spectra in d+Au collisions as well as those from recombination model. This figure shows that the recombination model can reproduce the spectra of pion in minimum-bias and centrality selected d+Au collisions.
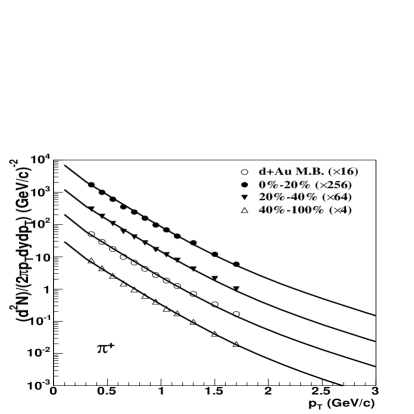
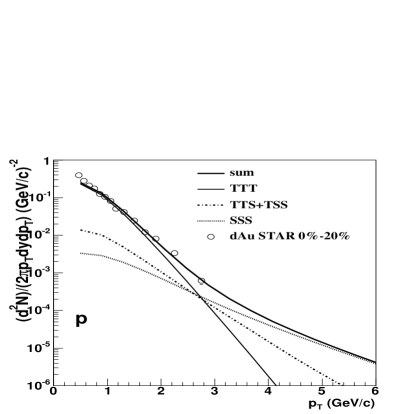
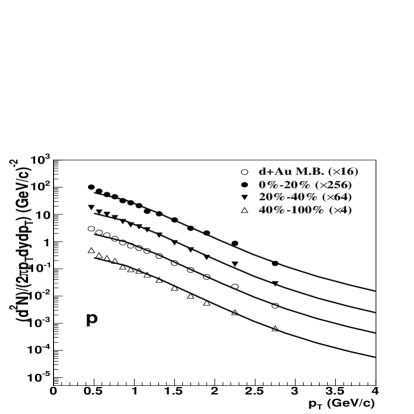
The invariant inclusive distribution for proton formation at midrapidity in the recombination model [92]
| (5.4) |
where all momentum variables and are transverse momenta, and denotes the energy of the proton. is the joint distribution of and quarks at and , respectively. is the recombination function for a proton with momentum . We write schematically
| (5.5) |
where all the shower partons are from one hard parton jet. Shower partons from different jets are ignored here for RHIC energies. In d+Au collisions, denotes the soft partons that are not associated with the shower components of a hard parton. The term is regarded as the fragmentation of a hard parton into a proton. The term comes entirely from the soft partons, while and accounts for the interplay between the soft and shower partons. The soft contribution to the proton spectrum arising from recombination is
| (5.6) |
. Where and are determined by fitting the proton spectra at low , the is equal to 1.75, is equal to 1.05, is the beta function [92]. For the invariant yield of proton, there are 4 different contributions: soft-soft-soft (), soft-soft-shower (), soft-shower-shower (), and shower-shower-shower (). The total contributions are , where is determined by fitting the d+Au data at GeV/c, and is the number of binary collisions. The data points of and are from Prof. C.B. Yang [93]. The values for minimum-bias, 0-20%, 20-40% and 40-100% d+Au collisions are 9.67, 12.34, 10.92 and 7.91 individually. The value of 0.21 GeV is used in the low fit. Figure 5.3 shows the proton spectra in d+Au collisions as well as those from recombination model. This figure shows that the recombination model can reproduce the spectra of proton in minimum-bias and centrality selected d+Au collisions. From the comparison between our data and the calculation results from the recombination model, we know that the recombination model actually can reproduce both the proton and pion spectra in d+Au collisions, while as we have mentioned above, the initial multiple parton scattering model [30] with independent fragmentation can’t reproduce the difference of Cronin effect between proton and pion. Besides, the initial multiple parton scattering model with independent fragmentation can’t reproduce the asymmetry of the Cronin effect. In the recombination model [92], the number of such soft partons on the Au outgoing side is larger than that on the deuteron outgoing side. This will result in the Cronin effect on the Au side larger than that on the deuteron side [92]. Qualitatively the recombination model can reproduce the asymmetry of the Cronin effect. As we know, the recombination model is a final-state effect model. These all seem to indicate that the Cronin effect is not initial-state effect only. The final-state effect plays an important role too. To directly confirm the Cronin effect is initial or final state effect, it’s necessary for us to compare the Cronin effect of Drell-Yan process with those of pion, kaon and proton. I will come to this later.
5.1.3 Integral yield : shadowing effect?
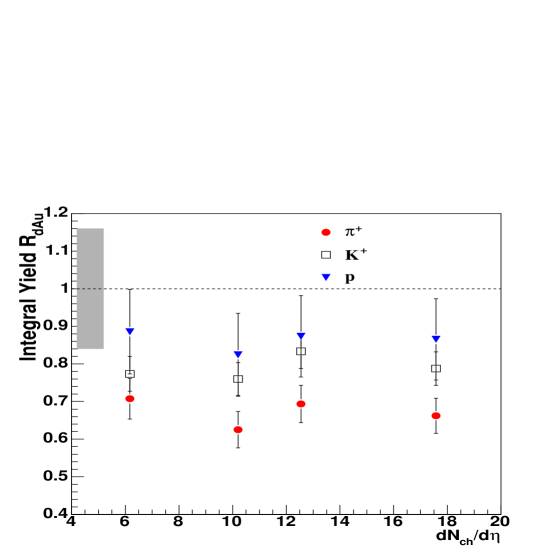
The initial multiple elastic scattering only changes the distribution while the total cross section should not change. Thus we can look at the integral yield , which are measured through comparison to the integral yield in p+p collisions, scaled by the number of binary collisions . Figure 5.4 shows that integral yield of pion, kaon and proton as a function of in minimum-bias and centrality selected d+Au collisions at mid-rapidity. The integral yield of pion and kaon are less than 1 while that of proton is close to 1. This may be the indication of shadowing effect at 200 GeV. The integral yield for proton is larger than that for kaon and a little bit more larger than that for pion. This may be the indication that the shadowing effect is mass dependent at 200 GeV.
5.1.4 Initial or final state effect: Drell-Yan process
In order to see the Cronin effect is initial or final state effect, we may look into the Drell-Yan process since there is little final state effect in Drell-Yan process. If there is no enhancement at high for Drell-Yan process, the enhancement for is due to final-state effect. Figure 5.5 shows the integral yield Cronin ratio as a function of atomic weight at p-A fixed target experiment [95]. The proton incident energy is 800 GeV. We can see there is no enhancement for Drell-Yan process. However, this is the total cross section while what we want to compare is Cronin ratio as a function of . It will be better if we have the dependence of Cronin ratio of Drell-Yan process. However, at the same range with the same proton incident energy, the Cronin ratio of Drell-Yan is not available in p+A collisions. It’s hard to compare the Cronin ratio of Drell-Yan process with those of .
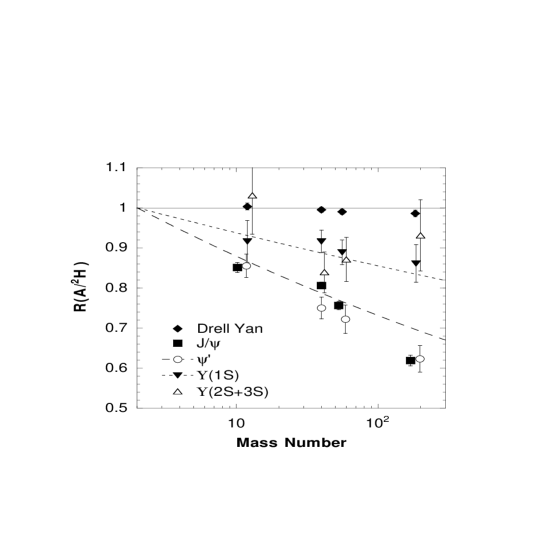
5.2 Baryon excess in Au+Au collisions
Now let’s come to another important physics from d+Au collisions. We know that the ratio from minimum-bias Au+Au collisions [18] at a similar energy is about a factor of 2 higher than that in d+Au and p+p collisions for GeV/c. This enhancement is most likely due to final-state effects in Au+Au collisions. There are many models trying to explain this baryon excess in Au+Au collisions [9, 24, 19, 20, 22, 23]. In the following baryon production mechanism will be discussed.
5.2.1 ratio vs

In 200 GeV Au+Au collisions, ratio was observed to be flat with till intermediate range [14], as shown in Figure 5.6. The baryon junction model [24] tried to explain it by using junction anti-junction production with jet quenching, on the basis of pQCD calculation [24] where the ratio decreases with in p+p collisions. The curve from pQCD calculation [24] is also shown in Figure 5.6. However, ratios in d+Au and p+p collisions in our data show to be flat with within errors. Anyway, the precise measurement with more statistics in p+p and d+Au collisions is needed to address this issue.
5.2.2 Baryon production at RHIC: multi-gluon dynamics?
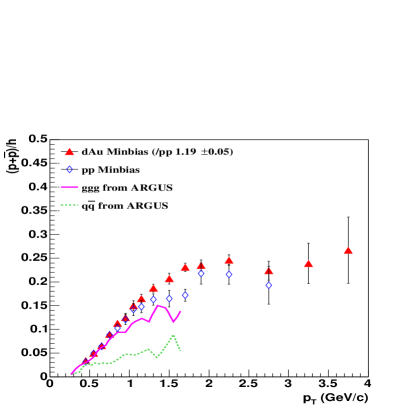
Let’s compare the ratio in p+p, d+Au and Au+Au collisions at RHIC energy 200 GeV with the ratio in collisions at ARGUS [96]. Using the ARGUS detector at the storage ring DORIS II, the inclusive production of pion, kaon and proton in multihadron events at 9.98 GeV and in direct decays of the meson were investigated [96]. Multihadron final states in annihilation are produced via quark and antiquark fragmentation, and those from direct decays originate from the hadronization of three gluons [96]. Figure 5.7 shows the ratio in 200 GeV p+p collisions together with the ratio in collisions at ARGUS [96]. The plot shows that the ratio from three gluon hadronization is a factor of 3 higher than that from quark and antiquark fragmentation at ARGUS. Our data from 200 GeV p+p collisions is close to ratio from 3 gluon hadronization. This may be the indication that in the heavy ion collisions at RHIC energy, multi-gluon hadronization plays an important role for the particle production.
Chapter 6 Conclusion and Outlook
6.1 Conclusion
In summary, we have reported the identified particle spectra of pions, kaons, protons and anti-protons at mid-rapidity from 200 GeV minimum-bias, centrality selected d+Au collisions and NSD p+p collisions. The time-of-flight detector, based on novel multi-gap resistive plate chamber technology, was used for particle identification. This is the first time that MRPC detector was installed to take data as a time-of-flight detector in the collider experiment. The calibration method was set up in the STAR experiment for the first time and has been applied to the data taken later successfully. The intrinsic timing resolution of the MRPC was 85 ps after the calibration. In 2003 run, the pion/kaon can be separated up to transverse momentum 1.6 GeV/c while proton can be identified up to 3.0 GeV/c.
The spectra of , , and in d+Au and p+p collisions provide an important reference for those in Au+Au collisions. The initial state in d+Au collisions is similar to that in Au+Au collisions, and, it’s believed that the quark-gluon plasma doesn’t exist in d+Au collisions. These results from d+Au collisions are very important for us to judge whether the quark-gluon plasma exists in Au+Au collisions or not and to understand the property of the dense matter created in Au+Au collisions. We observe that the spectra of , , and are considerably harder in d+Au than those in p+p collisions. In GeV d+Au collisions, the of protons rise faster than of pions and kaons. The of proton is larger than 1 at intermediate while the proton production follows binary scaling at the same range in 200 GeV Au+Au collisions. These results further prove that the suppression observed in Au+Au collisions at intermediate and high is due to final state interactions in a dense and dissipative medium produced during the collision and not due to the initial state wave function of the Au nucleus. Additionally, the particle-species dependence of the Cronin effect is found to be significantly smaller than that from lower energy p+A collisions. In GeV d+Au collisions, the ratio of the nuclear modification factor between and charged hadrons () in the range GeV/c was measured to be (stat)(syst) in minimum-bias collisions. Both the values and ratios show little centrality dependence, in contrast to previous measurements in Au+Au collisions at = 130 and 200 GeV. The ratios of protons over charged hadrons in d+Au and p+p collisions are found to be about a factor of 2 lower than that from Au+Au collisions, indicating that the relative baryon enhancement observed in heavy ion collisions at RHIC is due to the final state effects in Au+Au collisions.
The identified particle spectra in d+Au and p+p collisions not only provide the reference for those in Au+Au collisions, but also provide a chance to see the mechanism of the Cronin effect itself clearly. Usually the Cronin effect has been explained to be the initial state effect only since 1970s [30]. However, we compare our pion and proton spectra in minimum-bias and centrality-selected d+Au collisions with the recombination model [92]. The recombination model can reproduce both the pion spectra and proton spectra. This recombination model is built on the hadronization process, which is a final-state effect, while the initial multiple parton scattering model [30] can’t reproduce the difference of the Cronin effect between pions and protons. From these comparisons, we conclude that the Cronin effect in GeV d+Au collisions is not the initial state effect only, and that final state effect plays an important role.
The integral yield and in p+p and d+Au collisions were estimated from the power law fit and thermal model fit. The integral yield of , , and are observed to be smaller than 1 while those of and are close to 1. The , and ratios as a function of are observed to be flat with within the errors in d+Au and p+p minimum-bias collisions and show little centrality dependence in d+Au collisions. The integral yield ratios of and as a function of were also presented in p+p and d+Au collisions.
6.2 Outlook
For the outlook, I will discuss whether the Cronin effect is mass dependent or baryon/meson dependent at 200 GeV. What other physics topic have we done from MRPC-TOFr in d+Au and p+p collisions in 2003 run? If we have the full time-of-flight (Full-TOF) coverage, what can we do? Also I will discuss a little bit about the low energy 63 GeV Au+Au run.
6.2.1 Cronin effect at 200 GeV: Mass dependent or baryon/meson dependent?
We know that recombination model can reproduce the spectra of pions and protons in d+Au collisions. Also the of identified particles in Au+Au collisions suggest that the degree of suppression depends on particle species(baryon/meson) at intermediate . Does the Cronin effect in 200 GeV d+Au collisions depend on the particle species (baryon/meson) or depend on the particle mass? From our data, it shows the Cronin effect for proton is bigger than those for pion and kaon. And the Cronin effect of pion shows little difference from that of kaon at GeV/c. In order to see the Cronin effect is baryon/meson dependent or mass dependent, we can compare the Cronin effect of proton with those of and since the mass of and are close to that of proton while and are mesons and proton is a baryon. The preliminary results show that the Cronin effect of and [97] are similar to that of pion and different from that of proton. However, the final results from and are needed to confirm this issue.
6.2.2 Electron PID from MRPC-TOFr
The production and spectra of hadrons with heavy flavor are sensitive to initial conditions and the later stage dynamical evolution in high energy nuclear collisions, and may be less affected by the non-perturbative complication in theoretical calculations [100]. Charm production has been proposed as a sensitive measurement of parton distribution function in nucleon and the nuclear shadowing effect by systematically studying p+p, and p+A collisions [101]. The relatively reduced energy loss of heavy quark traversing a quark-gluon plasma will help us distinguish the medium in which the jet loses its energy [102]. A possible enhancement of charmonia () production can be present at RHIC energies [103] due to the coalescence of the copiously produced charm quarks [99].
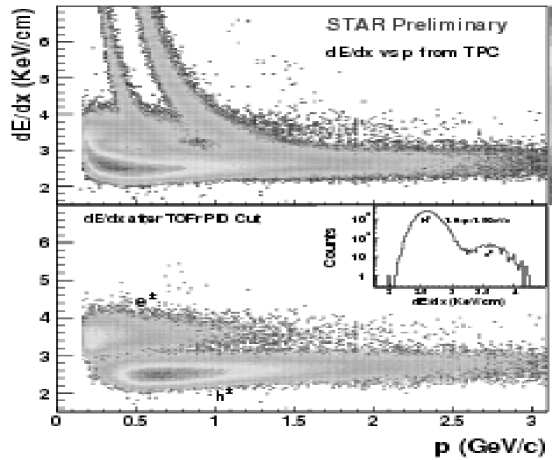
The recent STAR results on the absolute open charm cross section measurements from direct charmed hadron reconstruction [81] in d+Au collisions and electrons from charm semileptonic decay in both p+p and d+Au collisions at 200 GeV were presented [99]. Based on the capability of hadron identification [98] from the MRPC-TOFr tray in 2003, electrons could be identified at low momentum ( GeV/c) by the combination of velocity () from TOFr [39] and the particle ionization energy loss () from TPC [38]. Figure 6.1 shows that the electrons are clearly identified as a separate band in the versus momentum () with a selection on at in d+Au collisions. At higher (2–4 GeV/c), negative electrons were also identified directly by TPC since hadrons have lower due to the relativisitic rise of electron . Based on the clear electron identification, the open-charm-decayed electron spectra was derived [99]. Combined with measurement from TPC, the total charm cross section was obtained [99] in d+Au collisions.
6.2.3 Full-TOF Physics
Based on the hadron PID and electron PID of MRPC-TOFr in 2003, we can imagine how many physics we can do if we have full time-of-flight coverage based on MRPC technology. The proposal [74] for large area time-of-flight system for STAR has been proposed. Since the pion/kaon can be separated up to transverse momentum 1.6 GeV/c and proton can be identified up to 3.0 GeV/c from time-of-flight system. The resonance spectra measured from hadronic decay will be extended to much higher . The direct open charm spectra from its hadronic decay channel will reach higher with much more precise measurement. Since the electron can be clearly identified up to transverse momentum 34 GeV/c by the combination of velocity () from TOFr [39] and the particle ionization energy loss () from TPC [38], the electron spectra from charm-semi-leptonic decay will be measured precisely. As we know that the measurement of the di-leptonic decays of vector mesons are very difficult since the branch ratios are too small and it’s really hard to subtract the background. But with TOF upgrading together with the SVT and micro-vertex detector upgrading, the di-leptonic decays of vector mesons will be measured much more easily, which will bring the direct information of QGP since the electron is a lepton and the cross section of interaction between electrons and hadrons is little. Thus we can see directly the property of quark-gluon plasma such as the temperature and the chiral symmetry restoration. This will be the most interesting and meaningful thing for the QGP search [94]. Besides, there are many other physics topics [74] such as identified particle correlation and fluctuation, particle composition of jet fragmentation, and anti-nuclei etc.
6.2.4 63 GeV Au+Au collisions at RHIC
The bulk properties such as elliptic flow and particle production show smooth trend from AGS, SPS to RHIC energy. One energy point GeV, which is between SPS and full RHIC energy, was selected since high quality charged-particle and inclusive spectra have been measured in p+p collisions at 63 GeV at Intersecting Storage Rings (ISR) and will serve as the reference spectra for computing the nuclear modification factor for Au+Au collisions measured at the same energy. The and particle production at 63 GeV will be studied at RHIC. Besides, the nuclear modification factor as a function of will also be studied in this collision system in which the hard scattering component has been significantly reduced. The results from 63 GeV Au+Au collisions will be helpful for us to understand the property of dense medium created in 200 GeV Au+Au collisions.
Appendix A Tables of the Invariant Yields
| width | M.B. | 0%-20% | |
|---|---|---|---|
| 3.50e-01 | 1.00e-01 | ||
| 4.50e-01 | 1.00e-01 | ||
| 5.50e-01 | 1.00e-01 | ||
| 6.50e-01 | 1.00e-01 | ||
| 7.50e-01 | 1.00e-01 | ||
| 8.50e-01 | 1.00e-01 | ||
| 9.50e-01 | 1.00e-01 | ||
| 1.05e+00 | 1.00e-01 | ||
| 1.15e+00 | 1.00e-01 | ||
| 1.30e+00 | 2.00e-01 | ||
| 1.50e+00 | 2.00e-01 | ||
| 1.70e+00 | 2.00e-01 |
| width | 20%-40% | 40%-100% | |
|---|---|---|---|
| 3.50e-01 | 1.00e-01 | ||
| 4.50e-01 | 1.00e-01 | ||
| 5.50e-01 | 1.00e-01 | ||
| 6.50e-01 | 1.00e-01 | ||
| 7.50e-01 | 1.00e-01 | ||
| 8.50e-01 | 1.00e-01 | ||
| 9.50e-01 | 1.00e-01 | ||
| 1.05e+00 | 1.00e-01 | ||
| 1.15e+00 | 1.00e-01 | ||
| 1.30e+00 | 2.00e-01 | ||
| 1.50e+00 | 2.00e-01 | ||
| 1.70e+00 | 2.00e-01 |
| width | p+p | |
|---|---|---|
| 3.50e-01 | 1.00e-01 | |
| 4.50e-01 | 1.00e-01 | |
| 5.50e-01 | 1.00e-01 | |
| 6.50e-01 | 1.00e-01 | |
| 7.50e-01 | 1.00e-01 | |
| 8.50e-01 | 1.00e-01 | |
| 9.50e-01 | 1.00e-01 | |
| 1.05e+00 | 1.00e-01 | |
| 1.15e+00 | 1.00e-01 | |
| 1.30e+00 | 2.00e-01 | |
| 1.50e+00 | 2.00e-01 | |
| 1.70e+00 | 2.00e-01 |
| width | M.B. | 0%-20% | |
|---|---|---|---|
| 4.57e-01 | 1.00e-01 | ||
| 5.56e-01 | 1.00e-01 | ||
| 6.55e-01 | 1.00e-01 | ||
| 7.54e-01 | 1.00e-01 | ||
| 8.54e-01 | 1.00e-01 | ||
| 9.54e-01 | 1.00e-01 | ||
| 1.05e+00 | 1.00e-01 | ||
| 1.15e+00 | 1.00e-01 | ||
| 1.30e+00 | 2.00e-01 | ||
| 1.50e+00 | 2.00e-01 | ||
| 1.70e+00 | 2.00e-01 |
| width | 20%-40% | 40%-100% | |
|---|---|---|---|
| 4.57e-01 | 1.00e-01 | ||
| 5.56e-01 | 1.00e-01 | ||
| 6.55e-01 | 1.00e-01 | ||
| 7.54e-01 | 1.00e-01 | ||
| 8.54e-01 | 1.00e-01 | ||
| 9.54e-01 | 1.00e-01 | ||
| 1.05e+00 | 1.00e-01 | ||
| 1.15e+00 | 1.00e-01 | ||
| 1.30e+00 | 2.00e-01 | ||
| 1.50e+00 | 2.00e-01 |
| width | p+p | |
|---|---|---|
| 4.57e-01 | 1.00e-01 | |
| 5.56e-01 | 1.00e-01 | |
| 6.55e-01 | 1.00e-01 | |
| 7.54e-01 | 1.00e-01 | |
| 8.54e-01 | 1.00e-01 | |
| 9.54e-01 | 1.00e-01 | |
| 1.05e+00 | 1.00e-01 | |
| 1.15e+00 | 1.00e-01 | |
| 1.30e+00 | 2.00e-01 | |
| 1.50e+00 | 2.00e-01 |
| width | M.B. | 0%-20% | |
|---|---|---|---|
| 4.68e-01 | 1.00e-01 | ||
| 5.63e-01 | 1.00e-01 | ||
| 6.61e-01 | 1.00e-01 | ||
| 7.59e-01 | 1.00e-01 | ||
| 8.58e-01 | 1.00e-01 | ||
| 9.57e-01 | 1.00e-01 | ||
| 1.06e+00 | 1.00e-01 | ||
| 1.16e+00 | 1.00e-01 | ||
| 1.31e+00 | 2.00e-01 | ||
| 1.50e+00 | 2.00e-01 | ||
| 1.70e+00 | 2.00e-01 | ||
| 1.90e+00 | 2.00e-01 | ||
| 2.25e+00 | 5.00e-01 | ||
| 2.75e+00 | 5.00e-01 | ||
| 3.50e+00 | 1.00e+00 |
| width | 20%-40% | 40%-100% | |
|---|---|---|---|
| 4.68e-01 | 1.00e-01 | ||
| 5.63e-01 | 1.00e-01 | ||
| 6.61e-01 | 1.00e-01 | ||
| 7.59e-01 | 1.00e-01 | ||
| 8.58e-01 | 1.00e-01 | ||
| 9.57e-01 | 1.00e-01 | ||
| 1.06e+00 | 1.00e-01 | ||
| 1.16e+00 | 1.00e-01 | ||
| 1.31e+00 | 2.00e-01 | ||
| 1.50e+00 | 2.00e-01 | ||
| 1.70e+00 | 2.00e-01 | ||
| 1.90e+00 | 2.00e-01 | ||
| 2.25e+00 | 5.00e-01 | ||
| 2.75e+00 | 5.00e-01 |
| width | p+p | |
|---|---|---|
| 4.68e-01 | 1.00e-01 | |
| 5.63e-01 | 1.00e-01 | |
| 6.61e-01 | 1.00e-01 | |
| 7.59e-01 | 1.00e-01 | |
| 8.58e-01 | 1.00e-01 | |
| 9.57e-01 | 1.00e-01 | |
| 1.06e+00 | 1.00e-01 | |
| 1.16e+00 | 1.00e-01 | |
| 1.31e+00 | 2.00e-01 | |
| 1.50e+00 | 2.00e-01 | |
| 1.70e+00 | 2.00e-01 | |
| 1.90e+00 | 2.00e-01 | |
| 2.25e+00 | 5.00e-01 | |
| 2.75e+00 | 5.00e-01 |
Appendix B How to make MRPC
This appendix is based on the procedure of the MRPC production in USTC. I will introduce the material preparations and then the chamber installation.
B.1 Preparations
B.1.1 Glass
(1) Check the glass very carefully by eye. The glass with scrapes is not accepted. (2) Measure the size of the glass with the digital vernier caliper. The errors of the length and width are required to be within 0.1 mm. Measure the thickness in several different places. The precision of the thickness is required to be 0.01 mm for each glass. (3) Use the micrometer to measure the flatness, which is required to be less than 0.01 mm. Use the mirror and observe the stripes of interference. (4) Grind the edge and the corner of the glass, and clean it. The size of outer glass is and the size of inner glass is .
B.1.2 Graphite Layer
(1) Stick the layer in the middle of the outer glass. Squeeze the air out. (2) Stick a small copper tape, which is for high voltage (HV) applying, on to the graphite layer, which is in the middle of the long side, and 00.5 mm away from the edge of the glass. The size of the graphite layer is . The size of the copper tape (the rectangle with the round angle) is .
B.1.3 Mylar layer
Cut the mylar layer, and see if there is any tiny holes or scrapes. If yes, don’t use it. The size of mylar is .
B.1.4 Honeycomb board
Measure the size and flatness. The error of the length and width is required to be within 0.2 mm, the error of the thickness is required to be within 0.05 mm. The flatness is required to be within 0.1 mm. The size of honeycomb board is .
B.1.5 The printed circuit board (PCB)
(1) Check the surface of the metal which is used as read-out strips carefully, and see the position of the HV-holes is right or not. Check the size of the metal holes, whose diameters are required to be larger than 0.9 mm. (2) Use double side tape to stick the PCB board with the Mylar. The size of the double side tape is the same as the PCB board. The length of the mylar is 1 mm longer than that of the PCB board. (3) Use sealing ion to open a 3 mm hole, the center of the hole is in the middle of the HV holes. The size of PCB is . The size of metal holes are 1 mm.
B.1.6 Lucite cylinder
Use digital vernier caliper to measure the length of the Lucite cylinder. Clean it and stick a double side tape on one side. The size is 3 mm and mm.
B.1.7 Other stuff
Besides, we also need pins, fish line and little plastic cannula. The size of the pin is 2-2.1 cm long. The fish line is 0.22 mm. The plastic cannula is 1 mm. One kind of the cannula is 7 mm long, and the other is 5.6 mm long. Table B.1 lists the main materials for 1 MRPC.
B.2 Installation
B.2.1 The outer glass and mylar and PCB
(1) stick the outer glass on to the center of the mylar. (2) Use the sealing ion to connect the HV conductive line with the copper tape. Apply the HV to measure the noise rate and dark current. (3) Between the mylar and outer glass edge, on each side, use silica gel to seal. Attention: keep the surface clean and smooth. Attention: If one side is done, wait till the silica gel becomes solid. (4) Stick pins. Seal the pins which are used for the fish line coiling, into the metal holes of the PCB board. (5) Use the inner glass to fix on the position of Lucite cylinders, and keep them away from the pins for fish line. Then stick the 810 Lucite cylinders onto the outer glass.
B.2.2 Inner glass and fish-line coiling
(1) Pre-install. Don’t use fish-line. Pay attention to adjust the position of the pins. (2) This is now the real installation and fish line coiling. Clean the outer glass and inner glass carefully, coil a loop of fish line, add a piece of glass, then coil another loop of fish line, add another piece of glass, and so on and so forth. Attention: clean the fish line before it coils, and blow the surface of glass to protect it from the dirt with nitrogen jet. (3) Another time for pre-installation. Pay attention to the position of the upper and lower electrodes and adjust the position of pins. (4) Paste 3140 RTV coating onto the surface of Lucite cylinders. (5) Connect the two electrodes. Make sure all the pins connect right into the metal holes. Then lay the whole flat, and put on a block which is 4 kilogram weight. (6) After 2 hours, stick the honeycomb. (7) Measure the thickness of the whole. Make sure the precision is within 0.05 mm. (8) Connect the conductive-line for the read-out strips, and then put the whole into a bag. Attention: the conductive-line should not be broken.
| material | type | character | number | source |
| outer glass | window glass | 1.1 mm thick, VR: ohm.cm | 2 | Shanghai |
| inner glass | window glass | 0.54 mm thick, VR: ohm.cm | 5 | USA |
| graphite layer | T9149 | 0.13 mm thick, SR : 2M ohm/square | 2 | Japan |
| Mylar | M0 | 0.35 mm thick | 2 | Dupont Corp. |
| honeycomb | 4 mm thick | 2 | Shanghai | |
| PCB | gold | 1.58 mm thick | 2 | Shenzhen |
| copper tape | 0.08 mm thick | 2 | 3M Comp. | |
| LC | Lucite | 3 mm,3.9 mm long | 8-10 | processing |
| pins (single) | metal pin | 21.5 mm long | 14 | |
| pins (pair) | metal pin | 21.5 mm long | 12 | |
| cannula | F-plastic | 1.4 mm | 38 | |
| fish line | top line | 0.22 mm | Switzerland | |
| DST | 9690 | 0.13 mm thick | 3M Comp. | |
| silica gel | CAF4 | high-voltage insulation | Switzerland |
Appendix C List of Publications
1. Pion, kaon, proton and anti-proton transverse momentum distributions from p+p and d+Au collisions at = 200 GeV, STAR Collaboration, e-Print Archives (nu-ex/0309012), submitted.
2. Open Charm Yields in 200 GeV p+p and d+Au Collisions at RHIC, Lijuan Ruan (for the STAR Collaboration), Journal of Physics G, 30 (2004) S1197-S1200, contributed to 17th International Conference on Ultra Relativistic Nucleus-Nucleus Collisions (Quark Matter 2004).
3. A Monte Carlo Simulation of Multi-gap Resistive Plate Chamber and comparision with Experimental Results, RUAN Li-Juan, SHAO Ming, CHEN Hong-Fang, et al., HEP and NP, Vol. 27, No. 8 (2003) 712-715.
4. Monte Carlo Study of the Property of Multi-gap Resistive Plate Chambers, Shao Ming, Ruan Lijuan, Chen Hongfang, et al., HEP and NP, Vol. 27, No. 1 (2003) 67-71, (in Chinese).
5. Study on Light Collection and its Uniformity of Long Lead Tungstate crystal by Monte Carlo Method, Ruan Lijuan, Shao Ming, Xu Tong, et al., Chinese Journal of Computational Physics, Vol. 19, No. 5 (2002) 453-458, (in Chinese).
6. Beam test results of two kinds of multi-gap resistive plate chambers, M. Shao, L. J. Ruan, H. F. Chen, J. Wu, , C. Li, Z. Z. Xu, X. L. Wang, S.L. Huang, Z. M. Wang and Z. P. Zhang, Nucl. Instri. and Meth. A 492 (2002) 344-350.
7. The Study of the Resistive Property of the Electrode Material of MRPC, Ruan Lijuan, Wang Xiaolian, Li Cheng , et al., to be published in Journal of University of Science and Technology of China (in Chinese).
8. The Calibration Method of TOFr in the STAR Experiment, RUAN Lijuan, WU Jian, DONG Xin , et al., to be published in HEP and NP (in Chinese).
9. Spectra of K p from Au+Au Collisions at 62.4 GeV, Lijuan Ruan (for the STAR Collaboration), to be published in Journal of Physics G, Contributed to 8th International Conference on Strangeness in Quark Matter (SQM 2004).
10. Pseudorapidity Asymmetry and Centrality Dependence of Charged Hadron Spectra in d+Au Collisions at = 200 GeV, STAR Collaboration: e-Print Archives (nu-ex/0408016), submitted.
11. Transverse momentum correlations and minijet dissipation in Au-Au collisions at = 130 GeV, STAR Collaboration, e-Print Archives (nu-ex/0408012), submitted.
12. Azimuthal anisotropy and correlations at large transverse momenta in p+p and Au+Au collisions at = 200 GeV, STAR Collaboration, e-Print Archives (nu-ex/0407007), submitted.
13. Open charm yields in d+Au collisions at = 200 GeV, STAR Collaboration, e-Print Archives (nu-ex/0407006), submitted.
14. Measurements of transverse energy distributions in Au+Au collisions at = 200 GeV, STAR Collaboration, e-Print Archives (nu-ex/0407003), submitted.
15. Transverse-momentum dependent modification of dynamic texture in central Au+Au collisions at = 200 GeV, STAR Collaboration, e-Print Archives (nu-ex/0407001), submitted.
16. Hadronization geometry and charge-dependent number autocorrelations on axial momentum space in Au-Au collisions at = 130 GeV, STAR Collaboration, e-Print Archives(nu-ex/0406035), submitted.
17. Phi meson production in Au+Au and p+p collisions at sqrt(s)=200 GeV, STAR Collaboration, e-Print Archives (nu-ex/0406003), submitted.
18. Centrality and pseudorapidity dependence of charged hadron production at intermediate pT in Au+Au collisions at = 130 GeV, STAR Collaboration, e-Print Archives (nu-ex/0404020), to be published in Physical Review C.
19. Production of ee Pairs Accompanied by Nuclear Dissociation in Ultra-Peripheral Heavy Ion Collision, STAR Collaboration, e-Print Archives (nu-ex/0404012), to be published in Physical Review C.
20. Photon and neutral pion production in Au+Au collisions at = 130 GeV, STAR Collaboration, e-Print Archives (nu-ex/0401008), to be published in Physical Review C.
21. Azimuthally sensitive HBT in Au+Au collisions at = 200 GeV, STAR Collaboration, Phys. Rev. Lett. 93, 012301 (2004).
22. Production of Charged Pions and Hadrons in Au+Au Collisions at =130 GeV, STAR Collaboration, e-Print Archives (nu-ex/0311017), submitted.
23. Azimuthal anisotropy at RHIC: the first and fourth harmonics, STAR Collaboration, Phys. Rev. Lett. 92, 062301 (2004).
24. Cross Sections and Transverse Single-Spin Asymmetries in Forward Neutral Pion Production from Proton Collisions at sqrt(s) = 200 GeV, STAR Collaboration, Phys. Rev. Lett. 92, 171801 (2004).
25. Identified particle distributions in pp and Au+Au collisions at sqrtsnn=200 GeV, STAR Collaboration, Phys. Rev. Lett. 92, 112301 (2004).
26. Event-by-Event (pt) fluctuations in Au-Au collisions at = 130 GeV, STAR Collaboration, e-Print Archives (nu-ex/0308033), submitted.
27. Multi-strange baryon production in Au-Au collisions at = 130 GeV, STAR Collaboration, Phys. Rev. Lett. 92, 182301 (2004).
28. Pion-Kaon Correlations in Central Au+Au Collisions at = 130 GeV, STAR Collaboration, Phys. Rev. Lett. 91, 262302 (2003).
29. rho-0 Production and Possible Modification in Au+Au and p+p Collisions at = 200 GeV, STAR Collaboration, Phys. Rev. Lett. 92, 092301 (2004).
30. Net charge fluctuations in Au+Au collisions at = 130 GeV, STAR Collaboration, Phys. Rev. C 68, 044905 (2003).
31. Rapidity and Centrality Dependence of Proton and Anti-proton Production from Au+Au Collisions at = 130 GeV, STAR Collaboration, e-Print Archives (nu-ex/0306029), submitted.
32. Three-Pion Hanbury Brown-Twiss Correlations in Relativistic Heavy-Ion Collisions from the STAR Experiment, STAR Collaboration, Phys. Rev. Lett. 91, 262301 (2003).
33. Evidence from d+Au measurements for final-state suppression of high pT hadrons in Au+Au collisions at RHIC, STAR Collaboration, Phys. Rev. Lett. 91, 072304 (2003).
34. Particle-type dependence of azimuthal anisotropy and nuclear modification of particle production in Au+Au collisions at = 200 GeV, STAR Collaboration, Phys. Rev. Lett. 92, 052302 (2004).
35. Transverse momentum and collision energy dependence of high pT hadron suppression in Au+Au collisions at ultrarelativistic energies, STAR Collaboration, Phys. Rev. Lett. 91, 172302 (2003).
Appendix D STAR Collaboration
![[Uncaptioned image]](/html/nucl-ex/0503018/assets/x85.png)
![[Uncaptioned image]](/html/nucl-ex/0503018/assets/x86.png)
Bibliography
- [1] Cheuk-Yin Wong, Introduction to the High-Energy Heavy-Ion Collisions.
- [2] J. Harris, three lectures given at the Lake Louise Winter Institute on Quantum Chromodynamics, 15-21 February, 1998, Lake Louise, Alberta, Canada, pulished in World Scientific, 1998.
- [3] P. Braun-Munzinger, Nucl. Phys. A 681 119-123 (2001).
- [4] Z. Fodor and S. D. Katz, JHEP 0404 (2004) 050, hep-lat/0402006; G. I. Egri, Z. Fodor, S. D. Katz, K. K. Szabo and A. I. Toth, Prog. Theor. Phys. Suppl. 153 (2004) 93-105, hep-lat/0401022; M. Gyulassy, Journal of Physics G, 30 (2004) S911-S918, contributed to 17th International Conference on Ultra Relativistic Nucleus-Nucleus Collisions (Quark Matter 2004), nucl-th/0403032.
- [5] P. Huovinen, P.F. Kolb, U. Heinz, P. V. Ruuskanen, and S. A. Voloshin, Phys. Lett. B 503, 58(2001).
- [6] STAR Collaboration, J. Adams et al., Phys. Rev. Lett. 92, 052302 (2004).
- [7] STAR Collaboration, J. Adams et al., Phys. Rev. Lett. 92, 062301 (2004).
- [8] STAR Collaboration, J. Adams et al., Phys. Rev. Lett. 91, 172302 (2003).
- [9] M. Gyulassy et al., Review for: Quark Gluon Plasma 3, Editors: R.C. Hwa and X.N. Wang, World Scientific, Singapore, nucl-th/0302077; X.N. Wang, Phys. Rev. C 61, 064910 (2000).
- [10] A.H. Tang (for the STAR Collaboration), Journal of Physics G, 30 (2004) S1235-S1238, contributed to 17th International Conference on Ultra Relativistic Nucleus-Nucleus Collisions (Quark Matter 2004).
- [11] F. Wang (for the STAR Collaboration), Journal of Physics G, 30 (2004) S1299-S1304, contributed to 17th International Conference on Ultra Relativistic Nucleus-Nucleus Collisions (Quark Matter 2004).
- [12] K. Schweda (for the STAR Collaboration), Journal of Physics G, 30 (2004) S693-S700, contributed to 17th International Conference on Ultra Relativistic Nucleus-Nucleus Collisions (Quark Matter 2004).
- [13] STAR White Paper, nucl-ex/0501009, submitted to Nucl. Phys. A.
- [14] PHENIX Collaboration, S.S. Adler et al., Phys. Rev. C 69, 034909 (2004);
- [15] B. Alper et al., Nucl. Phys. B 100, 237 (1975).
- [16] DELPHI Collaboration, P. Abreu et al. Eur. Phys. J. C17, 207 (2000).
- [17] PHENIX Collaboration, S.S. Adler et al., Phys. Rev. Lett. 91, 072301 (2003); PHENIX collaboration, S.S. Adler et al., Phys. Rev. Lett. 91, 241803 (2003).
- [18] PHENIX Collaboration, K. Adcox et al., Phys. Lett. B 561, 82 (2003); PHENIX Collaboration, S.S. Adler et al., Phys. Rev. Lett. 91, 172301 (2003).
- [19] D. Teaney et al., nucl-th/0110037; D. Teaney et al., Phys. Rev. Lett. 86, 4783 (2001).
- [20] P. Huovinen, Nucl. Phys. A 715, 299c (2003).
- [21] R.C. Hwa et al., Phys. Rev. C 67, 034902 (2003).
- [22] R.J. Fries et al., Phys. Rev. C 68, 044902 (2003).
- [23] V. Greco et al., Phys. Rev. Lett. 90, 202302 (2003).
- [24] I. Vitev and M. Gyulassy, Phys. Rev. C 65, 041902 (2002).
- [25] K.P. Das and R.C. Hwa, Phys. Lett. B 68, 459 (1977); Erratum ibid. 73, 504 (1978); R.G. Roberts, R.C. Hwa and S. Matsuda, J. Phys. G 5, 1043 (1979).
- [26] C. Gupt et al., Nuovo Cimento 75, 408 (1983); T. Tchiai, Prog. Theor. Phys 75, 1184 (1986); T.S. Biro et al., Phys. Lett. B 347, 6 (1995); T.S. Biro et al., J. Phys. G 28, 1561 (2002).
- [27] B. Müller, nucl-th/0404015.
- [28] J.W. Cronin et al., Phys. Rev. Lett. 31, 1426 (1973); J.W. Cronin et al., Phys. Rev. D 11, 3105 (1975); D. Antreasyan et al., Phys. Rev. D 19, 764 (1979); P.B. Straub et al., Phys. Rev. Lett. 68, 452 (1992).
- [29] M. Lev and B. Petersson, Z. Phys. C 21, 155(1983).
- [30] A. Accardi, Contribution to the CERN Yellow report on Hard Probes in Heavy Ion Collisions at the LHC, hep-ph/0212148, (2002); X.N. Wang, Phys. Rev. C 61, 064910 (2000).
- [31] I. Vitev, Phys. Lett. B 562, 36 (2003).
- [32] T. Alexopoulos et al., Phys. Lett. B 435, 453 (1998).
- [33] D. Kharzeev et al., Phys. Lett. B 561, 93 (2003); J. Jalilian-Marian et al., Phys. Lett. B 577, 54 (2003); J.L. Albacete et al., Phys. Rev. Lett. 92, 082001 (2004); D. Kharzeev et al., Phys. Rev. D 68, 094013 (2003); R. Baier et al., Phys. Rev. D 68, 054009 (2003).
- [34] E. Schnedermann, J. Sollfrank, and U. Heinz, Phys. Rev. C 48, 2462 (1993).
- [35] STAR Collaboration, J. Adams et al., Phys. Rev. Lett. 92, 112301 (2004).
- [36] STAR Collaboration, J. Adams et al., Phys. Rev. Lett. 91, 072304 (2003).
- [37] PHENIX Collaboration, S.S. Adler et al., Phys. Rev. Lett. 91, 072303 (2003); PHOBOS Collaboration, B.B. Back et al., Phys. Rev. Lett. 91, 072302 (2003); BRAHMS Collaboration, I. Arsene et al., Phys. Rev. Lett. 91, 072305 (2003).
- [38] M. Anderson et al., Nucl. Instr. Meth. A 499, 659 (2003).
- [39] B. Bonner et al., Nucl. Instr. Meth. A 508, 181 (2003); M. Shao et al., Nucl. Instr. Meth. A 492, 344 (2002).
- [40] P. Sorenson, Ph.D. thesis, UCLA, 2003.
- [41] http://www.rhic.bnl.gov/.
- [42] T. Roser, Nuclear Physics A 688, 23c-28c, 2002.
- [43] J. Harris et al., Nucl. Instrum. Meth. A 499, 624 (2003).
- [44] ‘Conceptual Design Report for the Solenoidal Tracker At RHIC’, The STAR Collaboration, PUB-5347 (1992); J.W. Harris et al, Nucl. Phys. A 566, 277c (1994).
-
[45]
R.L. Brown et al., Proc. 1997 IEEE Particle Accelerator Conf., 3230 (1998)
and F. Bergsma et al., ‘The STAR Detector Magenet Subsystem’, Nucl. Instrum. Meth. A499, 629 (2003). -
[46]
D. Lynn et al., Nucl. Instrum. Meth. A447, 264 (2000)
and R. Bellwied et al., ‘The STAR Silicon Vertex Tracker’, Nucl. Instrum. Meth. A499, 636 (2003). - [47] L. Arnold et al., ‘The STAR Silicon Strip Detector’, Nucl. Instrum. Meth. A499, 648 (2003).
- [48] H. Wieman et al., IEEE Trans. Nucl. Sci. 44, 671 (1997).
-
[49]
S. Klein et al., IEEE Trans. Nucl. Sci. 43, 1768 (1996)
and M. Anderson et al., ‘A Readout System for the STAR Time Projection Chamber’, Nucl. Instrum. Meth. A499, 675 (2003). -
[50]
A. Schuttauf et al., Nuc. Phys. A661, 677c (1999)
and K.H. Ackerman et al., ‘The Forward Time Projection Chamber in STAR’, Nucl. Instrum. Meth. A499, 709 (2003). - [51] ‘A Ring Imaging Cherenkov Detector for STAR’, STARnote 349, STAR/ALICE RICH Collaboration (1998); ALICE Collaboration, Technical Design and Report, Detector for High Momentum PID, CERN/LHCC 98-19.
- [52] M. Beddo et al., ‘The STAR Barrell Electromagnetic Calorimeter’, Nucl. Instrum. Meth. A499, 721 (2003).
- [53] C.E. Allgower et al., ‘The STAR Endcap Electromagnetic Calorimeter’, Nucl. Instrum. Meth. A499, 736 (2003).
- [54] L. Kotchenda et al., “The STAR TPC Gas System”, Nucl. Instrum. Meth. A499 (2003).
- [55] STAR software for the event reconstruction.
- [56] E. Cerron Zeballos et al., Nucl. Instr. Meth. A 374, 132 (1996); M.C.S. Williams et al., Nucl. Instr. Meth. A 478, 183 (2002).
- [57] R. Santonico, R.Cardarelli, Nucl. Instr. And Meth. 187 (1981) 377-380.
- [58] E. Cerron Zeballos, I. Cotty, D. Hatzifotiadou, J.Lamas Valverde, S. Neupane, M.C.S. Williams and A. Zichichi, Nucl. Instr. Meth. A374(1996) 132.
- [59] M. Abbrescia et al., Nucl. Instr. and Meth. A 398 (1997) 173-179.
- [60] M. Abbrescia et al., Nucl. Instr. and Meth. A 409 (1998) 1-5.
- [61] M. Abbrescia et al., Nucl. Instr. and Meth. A 431 (1999) 413-427.
- [62] SHAO Ming, RUAN Lijuan, CHEN Hongfang, et al., HEP and NP, Vol. 27, No. 1 (2003) 67-71, (in Chinese); RUAN Li-Juan, SHAO Ming, CHEN Hong-Fang, et al., HEP and NP, Vol. 27, No. 8 (2003) 712-715.
- [63] H. Genz, Nucl. Instr. and Meth. 112 (1973) 83-90.
- [64] E. Gatti et al., Nucl. Instri. and Meth. 193 (1982) 651.
- [65] I. Smimov, HEED, Program to Compute Energy Loss of Fast Particles in Gases, Version 1.01 CERN W5060.
- [66] S. Biagi, Nucl. Instri. and Meth. A283 (1989) 716.
- [67] S. Biagi, Nucl. Instri. and Meth. A421 (1999) 234-240.
- [68] P. Camarri, R. Cardarelli, A. Di Ciaccio, R.Santonico, Nucl. Instri. and Meth. A414 (1998) 317-324.
- [69] LI Cheng, CHEN Hongfang, SHAO Ming, et al., HEP and NP, 2002, 26 (5):455-461 (in Chinese).
- [70] LI Cheng, WU Jian, CHEN Hong-Fang, et al., HEP and NP, 2001,25(9): 933-936) (in English).
- [71] CHEN Hongfang, LI Cheng, WANG Xiaolian, et al., HEP and NP, 2002, 26(3):201-206(in Chinese).
- [72] LI Cheng, WU Jian, Wang Xiaolian, et al., Nuclear Science and Techniques, 2002, Vol.13, No.1: 6-10(in English).
- [73] W.J. Llope et al., Nucl. Instr. Meth. A 522, 252 (2004).
- [74] STAR Collaboration, “proposal for a large area time of flight system for STAR”.
- [75] Ruan Lijuan et al., “The Study of the Resistive Property of the Electrode Material of MRPC”, to be published in Journal of University of Science and Technology of China (in Chinese).
- [76] T. Sjöstrand, P. Eden, C. Friberg et al., Comput. Phys. Commun. 135, 238 (2001).
- [77] X.N. Wang and M. Gyulassy, Phys. Rev. D 44, 3501 (1991).
- [78] K.H. Ackermann et al., Nucl. Instr. Meth. A 499, 713 (2003).
- [79] STAR Collaboration, C. Adler et al., Phys. Rev. Lett. 87, 262302 (2001).
- [80] T. Alexopoulos et al., Phys. Rev. D 48, 984 (1993).
- [81] H. Zhang, Ph.D. thesis, Yale University, 2003.
- [82] H. Long, Ph.D. thesis, UCLA, 2002.
- [83] A. Tang, Ph.D. thesis, Kent University, 2001.
- [84] CERN RD44 Project at http://wwwinfo.cern.ch/asd/geant/geant4public/ G4UsersDocuments/Welcome/IntroductionToGeant4/html/introductionToGeant4.html.
- [85] P. Nevski, http://www.star.bnl.gov/STARAFS/comp/simu/gstar/gstar.html.
- [86] Particle Data Group, Phys. Rev. D 45 (1992).
- [87] X.N. Wang, Phys. Lett. B 565, 116 (2003).
- [88] X.N. Wang, Private Conversation (2004).
- [89] J.W. Qiu, Private Conversation (2004).
- [90] STAR Collaboration, J. Adams et al., Phys. Rev. C 70, 064907 (2004).
- [91] J. W. Qiu and I. Vitev, Phys. Rev. Lett. 93, 262301 (2004); J. W. Qiu and I. Vitev, hep-ph/0405068.
- [92] R.C. Hwa and C.B. Yang, Phys. Rev. Lett. 93, 082302 (2004); R.C. Hwa and C.B. Yang, Phys. Rev. C 70, 037901 (2004).
- [93] C.B. Yang, Private Communication (2004).
- [94] Z. Xu, Presentation inside STAR (2004).
- [95] P.L. McGaughey, J.M. Moss, and J.C. Peng, help-ph/9905409; D.M. Alde, et al., Phys. Rev. Lett. 64, 2479 (1990).
- [96] ARGUS Collaboration, H. Albrecht et al., Z. Phys. C - Particles and Fields 44, 547-555 (1989).
- [97] L.J. Ruan, Presentation inside STAR (2004); X.Z. Cai (for the STAR Collaboration), in Proceedings of SQM2004.
- [98] STAR Collaboration, J. Adams et al., nucl-ex/0309012.
- [99] STAR Collaboration, J. Adams et al., Phys. Rev. Lett. 94, 062301 (2005), nucl-ex/0407006; L. Ruan (for the STAR Collaboration), Journal of Physics G, 30 (2004) S1197-S1200, contributed to 17th International Conference on Ultra Relativistic Nucleus-Nucleus Collisions (Quark Matter 2004), nucl-ex/0403054.
- [100] P.L. McGaughey, et al., Int. J. Mod. Phys., A 10, 2999 (1995).
- [101] Z. Lin and M. Gyulassy, Phys. Rev. Lett. 77, 1222 (1996).
- [102] Y.L. Dokshitzer and D.E. Kharzeev, Phys. Lett. B 519, 199 (2001).
- [103] A. Andronic, P. Braun-Munzinger, et al., Phys. Lett. B 571, 36 (2003); R.L. Thews, M. Schroedter, J. Rafelski, Phys. Rev. C 63, 054905 (2001); L. Grandchamp, R. Rapp, Nucl. Phys. A 709, 415 (2002), and references therein.