BRAHMS Collaboration
Centrality Dependent Particle Production
at and in Au+Au Collisions
at = 200 GeV
Abstract
Particle production of identified charged hadrons, , , , and in Au+Au collisions at 200 GeV has been studied as a function of transverse momentum and collision centrality at and by the BRAHMS experiment at RHIC. Significant collective transverse flow at kinetic freeze-out has been observed in the collisions. The magnitude of the flow rises with the collision centrality. Proton and kaon yields relative to the pion production increase strongly as the transverse momentum increases and also increase with centrality. Particle yields per participant nucleon show a weak dependence on the centrality for all particle species. Hadron production remains relatively constant within one unit around midrapidity in Au+Au collisions at 200 GeV.
pacs:
25.75.DwI INTRODUCTION
The primary goal of the relativistic heavy-ion collider (RHIC) is to create and study matter at extremely high energy density. It is hypothesized that at the energy densities reached in central Au+Au reactions at RHIC, the matter created is composed of de-confined colored objects review1 ; review2 ; review3 . A summary of the results and opinions of the four experimental collaborations on the status of achieving this goal can be found in their “White Papers” BrahmsWhite ; PhobosWhite ; PhenixWhite ; StarWhite . We expect that the signals of any de-confined phase should become stronger as the overlapped region increases in Au+Au collisions. Testing this hypothesis requires studying particle production as a function of centrality. The particle distributions in transverse momentum and rapidity may provide a key to understanding any non-hadronic effects that might appear in central nucleus-nucleus collisions. Pions, kaons, protons and antiprotons are the most abundantly produced particles in the high-energy heavy-ion collisions, and they carry information about the bulk properties of the nuclear matter created from the collisions.
Pions, being the lightest of the produced hadrons are thus the most copiously produced, and their numbers can be related to the entropy density of the emitting source. Kaons carry a significant fraction of the total strangeness produced kaon . Protons and antiprotons provide an experimental tool for measuring baryon production and allow us to explore baryon transport from beam rapidity toward midrapidity brahms_stopping ; bass . The global thermodynamic properties and collective motion of the system at the kinetic freeze-out point can be deduced, albeit, in a model dependent way, from transverse momentum spectra as a function of rapidity and centrality ref:blast-wave .
In this paper, we present transverse momentum spectra, yields, and ratios for identified charged hadrons (, , , ) obtained with the BRAHMS Mid-Rapidity Spectrometer. We have measured these spectra for and as a function of collision centrality. At midrapidity, our observations are in agreement with the result of the PHENIX experiment phenix_mid within systematic uncertainties. The data presented here are available at brdata .
II EXPERIMENTAL DETAILS
The BRAHMS experiment consists of two movable magnetic spectrometer arms, the Mid-Rapidity Spectrometer (MRS) and the Forward Spectrometer, and global detectors for event characterization.
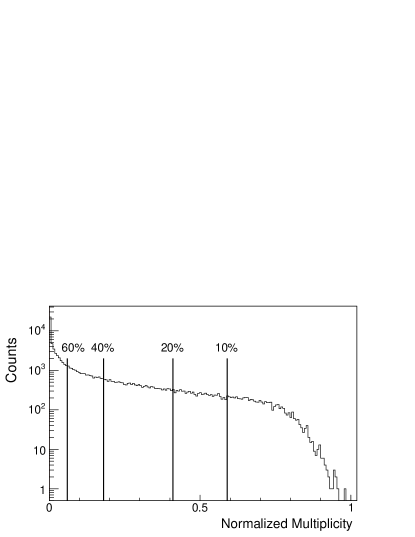
In order to characterize the centrality of collisions, a multiplicity array (MA) consisting of a coaxial arrangement of Si strip detectors and scintillator tiles surrounding the intersection region is employed. The Si strip detectors and scintillator tiles give independent measurement of charged-particle multiplicities allowing the two measurements to be averaged in the final determination. The pseudo-rapidity coverage of the MA is approximately 200gevmult ; tilenim . The centrality selection is obtained by developing minimum-bias trigger events, which are defined using two Zero Degree Calorimeters (ZDC), requiring energy deposit equivalent to at least one neutron in each of the two detectors and also requiring a signal in the MA to reject Coulomb dissociation events 200gevmult ; nim . Figure 1 shows the charged-particle multiplicity distribution for minimum-bias events in the range of . The lines on the plot indicate four centrality windows in the analysis, 010%, 1020%, 2040%, and 4060%, where 0% corresponds to the most central events.
The number of participating nucleons () in Table 1 are estimated using the Glauber Monte-Carlo HIJING calculation hijing . More peripheral collision events were not included in this paper because of limited statistics.
| Centrality | |||
|---|---|---|---|
| 328 6 | |||
| 239 10 | |||
| 140 11 | |||
| 62 10 |
The uncertainty in determining centrality from the multiplicity distribution was estimated to be for the most central bin and for the most peripheral bin. The fraction of the inclusive yield lost by the minimum-bias trigger is estimated to be about 4% and is corrected for. The location of the collision vertex was determined to an accuracy of 0.7 cm using Beam-Beam Counters (BBC) nim . The BBCs are located 2.2 m on either side of the nominal interaction point (IP) and also provide a start time (T0) for time-of-flight measurement.
The MRS is a single-dipole-magnet spectrometer which, by rotating about the nominal collision point, provides the angular coverage of , where is the polar angle with respect to the beam axis. The MRS contains two time projection chambers (TPCs), TPM1 and TPM2, which determine the three dimensional trajectories of the charged particles through the spectrometer. Between the two TPCs there is a dipole magnet (D5) for momentum determination. This assembly is followed by a highly segmented scintillator time-of-flight wall (TOFW).
The BRAHMS TPCs are located at a distance 0.95 m (TPM1) and 2.85 m (TPM2) from the interaction point. Each TPC is a rectangular box filled with 90% Ar and 10% CO2. The ionization produced by charged particles is collected on an anode grid. This grid is divided along the particle path into 12 rows (TPM1) and 20 rows (TPM2). Each row has 96 pads (TPM1) and 144 pads (TPM2) transverse to the direction of a normal-incident particle. The mapping of row, pad, and drift time leads to three-dimensional space points. The averaged resolutions measured from track residuals are 310387 m for X (pad) and 427490 m for Y (time). Details can be found in Ref. nim ; peter ; bhs ; jij .
Track reconstruction starts by finding straight-line track segments in the TPCs. The reconstructed straight tracks are joined inside the analyzing magnet by taking an effective edge approximation, and the momentum associated with the tracks are calculated from the vertical magnet field, the length in the magnetic field region, the polar angle of the tracks with respect to the matching plane, and the averaged vertical slope of the tracks. The matching plane is defined as the vertical plane that contains the perpendicular bisector of the line joining the effective edge entry and exit points of the tracks. Once the momentum is known the reconstructed tracks are projected toward the beam axis and checked for consistency with the collision vertex determined using the BBCs. For this analysis we only use tracks that project to within 12.5 cm of the nominal vertex in the horizontal plane.
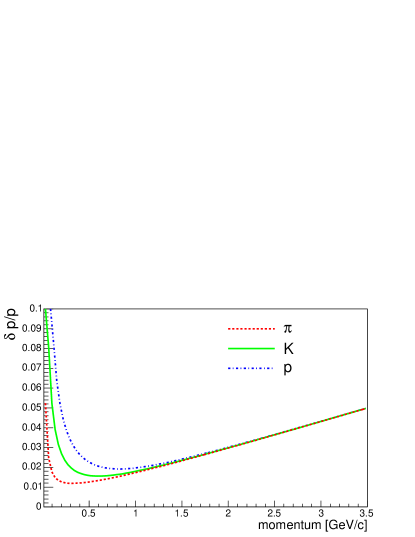
The momentum resolution of the spectrometer can be inferred from the width of our mass-squared distributions since , where is the velocity of light, the track path length, and is the time-of-flight whose resolution is measured independently. The extracted resolutions were fit to the form , where is the contribution from the intrinsic angular resolution of the tracking detectors and is the resolution from multiple scattering. The best fit is given by /GeV and with D5 at 6 kG. Figure 2 shows resolution curves based on this fit for pions, kaons and protons when the D5 magnet is set to 6 kG. For the data presented in this paper the momentum resolution lies between 2 and 8% depending on the momentum of the particle and the magnetic field in D5.
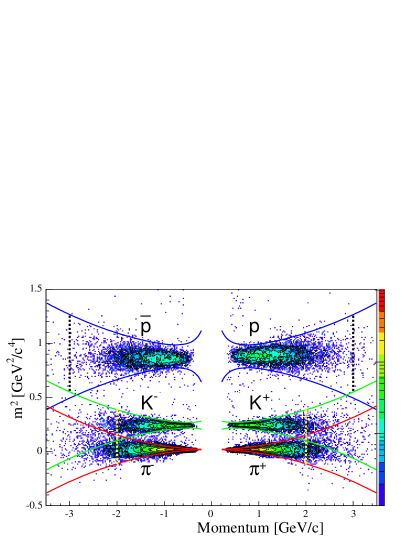
Particle Identification (PID) is based on time of flight data from the TOFW ( ps) with the start time taken from the BBC ( ps). The TOFW is located at a distance of 4.3 m from the nominal interaction point. Final mass identification PID is based on cuts in the vs. space, as shown in Fig. 3. The cut boundaries are set at from the mean values. TOFW provides separation to the momenta of 1.85 GeV/ and separation to the momenta of 2.85 GeV/. For particle identification above these momenta, the yields that are within the overlapped regions are corrected for misidentified particles up to the momentum of 2 GeV/ for , and the momentum of 3 GeV/ for . The kaon contaminations within the pion sample at 2 GeV/ and within the proton sample at 3 GeV/ are less than 1%. The dotted lines in Fig. 3 show the upper momentum limit used in the analysis on each particle type.
The data presented here were collected with the MRS at , for and at for in RHIC Run II (20012002).
From the number of identified particles, invariant differential yields are obtained from several spectrometer settings for different collision centralities. The invariant yields are corrected for geometrical acceptance and the efficiencies for detecting particles in the spectrometer. The inefficiencies arise from two effects, inefficiencies due to single track loses and those due to multiplicity dependent effects.
Geometrical acceptance factors are obtained from the GEANT geant simulation package BRAG (BRAHMS Analysis Geant), which is based upon the geometry and tracking capabilities of the the BRAHMS experimental setup. The acceptance correction is calculated for each MRS setting and five different vertex windows covering the MRS track vertex range used in the analysis.
The single track efficiency as a function of momentum in the spectrometer is determined by a Monte Carlo simulation. Events with one particle are first processed through BRAG with multiple scattering, decays, and hadronic interactions processes included. In order to evaluate these effects, the simulated events are processed through the same digitization, reconstruction and particle selection algorithm that is applied to the real data.
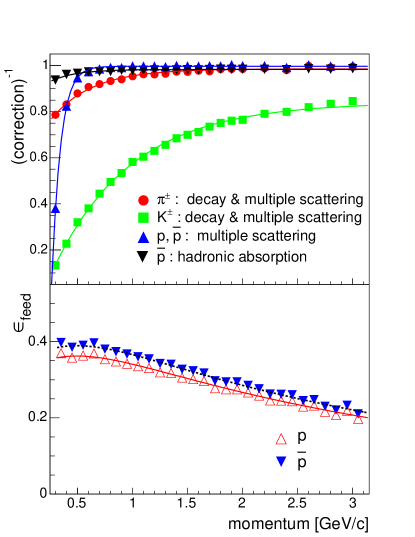
The upper panel of Fig. 4 shows correction factors applied to the pion, kaon and proton spectra at y=0 to account for multiple scattering and ( and K) decay in flight. The low momentum spectra are also corrected for hadronic absorption in the beam pipe and detector materials. This effect amounts to % of the total yield. No corrections are applied for secondary protons, arising mainly from the interaction of pions with the beam tube, since the contributions is found to be negligible in MC simulations using HIJING as input, when the tracks were required to point back to the IP. The difference of correction factors at different spectrometer settings is below 1%.
The multiplicity dependent track reconstruction efficiency has been studied by embedding simulated tracks into real events at the raw data level truls . The combined events are reanalyzed to determine if the embedded tracks are still reconstructed by the tracking program. Each track is associated with a number of pads in TPM1 and TPM2. The resulting tracking efficiency is parameterized as a function of the number of track-related pads found in the two TPCs with signals above threshold for pions, kaons, and protons in various spectrometer angle settings. The mean number of track-related pad hits in the data sample varies from 350 to 60 as the centrality varies from 0% to 60%. For the most central events, track reconstruction efficiency is 8595% depending on spectrometer angle setting.
The efficiency for individual TOFW slats is investigated by projecting TPC tracks to the slat and comparing this to the distribution of TOFW hits. The possibility of having multiple hits on a single slat is also corrected for. The overall efficiency for particle identification using TOFW is estimated to be 90%2% without significant dependences on spectrometer settings or collision centralities. The inefficiency includes uncertainties in matching tracks with hits in TOFW as well as the intrinsic detector inefficiencies.
Protons and antiprotons from weak decays lead to a contamination of the primary hadron spectra. The proton and antiproton spectra are corrected to remove the feed down contributions from and weak decays. At midrapidity the ratio , has been reported in Au+Au collisions at = 130 GeV star:lambda ; phenix:lambda . We have studied the magnitude of the corrections using various model assumptions as input to the BRAG simulations. Assuming primary / ratios at = 200 GeV similar to those measured at the lower energy star:olga and a constant behavior with rapidity, we take these ratios and measured spectra shapes as input to the BRAG code for feed down correction from decays. The simulated tracks are generated for the full phase space, digitized, and go through the real data analysis algorithm, as is done to determine the other correction factors. The lower panel of Fig. 4 shows the ratio () of secondary and to all measured and as a function of momentum. The fractional factors range from 2540%, and the largest value is 40% around a momentum GeV/. We multiply the proton and antiproton spectra by 1 for all centrality windows and rapidities as a function of momentum. The data are corrected on a track-by-track basis for efficiency and feed down contributions.
III EXPERIMENTAL RESULTS
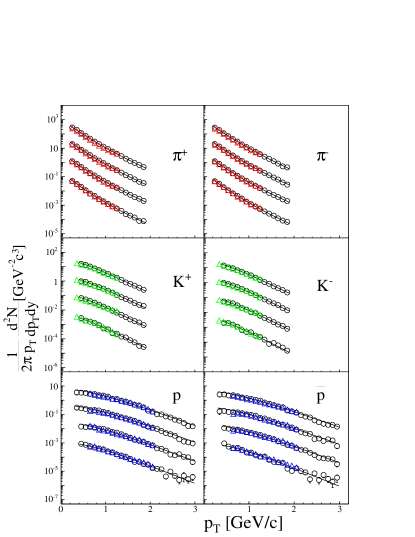
Figure 5 shows the invariant spectra for charged hadrons, , , , and at different collision centralities. The overlaid lines indicate fits to the data from in the range shown. The pion spectra are fitted with a power-law function, . For kaons the spectra are best fit by an an exponential in , A[], where where is the mass of the particle. The proton and antiproton -spectra tend to deviate from a single exponential shape, so a sum of two exponential functions is used to in the fit. The point-to-point systematic uncertainties on the spectra and quality of fit are estimated by using other fit functions and varying the fit ranges. The errors shown on the data points are statistical only. The overall systematic errors are estimated to be 1015%. The main sources for the overall systematic errors are from the uncertainties in the normalizations used to calculate the invariant yields. Others are from uncertainties in estimating background contribution, track reconstruction efficiencies, acceptance of spectrometer and particle identification losses. The yields and mean transverse momentum values are extracted from the fit functions. Tables 2 gives the fit ranges and the estimated percentage of the total yield included in the fit ranges.
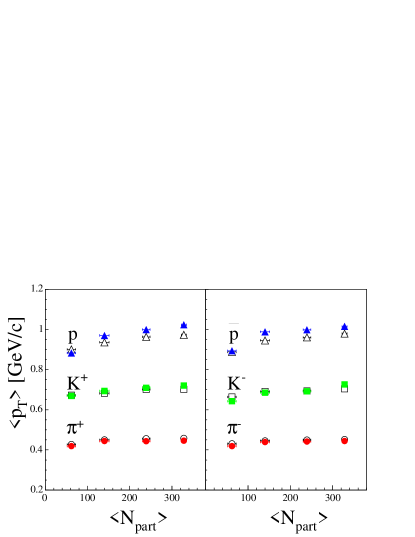
Figure 6 shows the mean transverse momenta, , as a function of . We find that increases with particle mass and centrality. This is suggestive of a hydrodynamic system where the initial pressure increases with the number of participants.

We also tried a hydrodynamic model fit to the experimental data with two free parameters: collective transverse flow velocity and the global thermal freeze-out temperature . We have utilized a version of a hydro-dynamically inspired “blast-wave” model initially developed to describe lower energy data ref:blast-wave . Assuming kinetic freeze-out of matter at constant with a collective transverse flow characterized by a velocity , the invariant distribution can be described as follows:
| (1) |
where is the freeze-out temperature, , are modified Bessel functions and is the transverse rapidity. The transverse velocity profile is parameterized by the surface velocity : . Results of a simultaneous fit for 010% centrality of Eq. 1 to the spectra for is shown in Fig. 7. The parameters , , and were allowed to vary, as well as the normalization constants for each particle type. The coverage of spectra at is not sufficient for a reliable hydrodynamic model fit. The source parameter used was fm ref:13fm . The integral in Eq. 1 is relatively insensitive to changes in , changing by less than 5% when is changed from 5 to 20 fm.
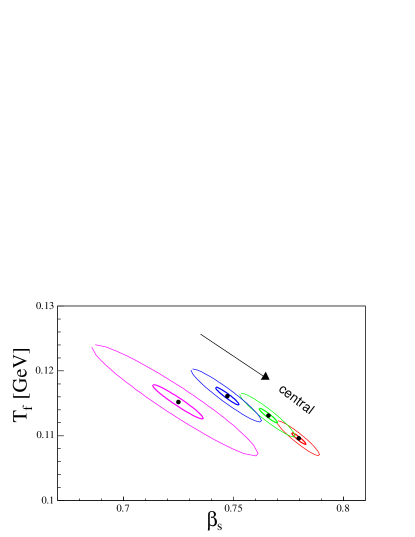
For the most central events (010%), the fit yields values of 109.60.9 MeV, 0.780.003, and 0.400.05. The average flow velocity is then estimated to be 0.65 by taking an average over the transverse geometry ref:beta . When fitting spectra from the other centrality windows we fixed the value of to be 0.4. The fits in the four centrality bins give a /DOF between 1.341.49. The systematic uncertainties in the fit parameters are estimated to be less than 5%. Figure 8 shows the centrality dependence of the temperature and surface velocity. decreases with centrality while increases. Since the surface velocity keeps increasing until the system decouples these results suggest that central collisions decouple later. The increased energy associated with the surface velocity requires a lower final temperature by energy conservation ref:flow_heinz .
| 283.3 2.4 | 196.2 1.9 | 119.7 1.4 | 47.5 0.96 | |
| 277.9 2.4 | 195.3 2.0 | 118.8 1.4 | 46.3 0.89 | |
| 45.0 0.67 | 29.8 0.54 | 17.9 0.38 | 6.3 0.26 | |
| 40.9 0.63 | 28.1 0.52 | 16.3 0.4 | 5.9 0.25 | |
| 18.6 0.21 | 13.4 0.18 | 7.6 0.13 | 2.81 0.08 | |
| 13.7 0.18 | 9.7 0.2 | 5.6 0.1 | 2.22 0.08 | |
| 266.8 2.4 | 193.1 2.2 | 117.6 1.3 | 50.8 1.01 | |
| 276.2 2.7 | 198.1 2.5 | 120.6 1.5 | 49.8 1.0 | |
| 40.6 0.32 | 29.3 0.27 | 17.2 0.17 | 6.7 0.12 | |
| 38.5 0.33 | 26.6 0.29 | 16.1 0.19 | 6.1 0.13 | |
| 18.0 0.17 | 12.7 0.15 | 7.4 0.1 | 2.97 0.08 | |
| 12.1 0.14 | 8.9 0.13 | 5.5 0.09 | 2.29 0.08 |
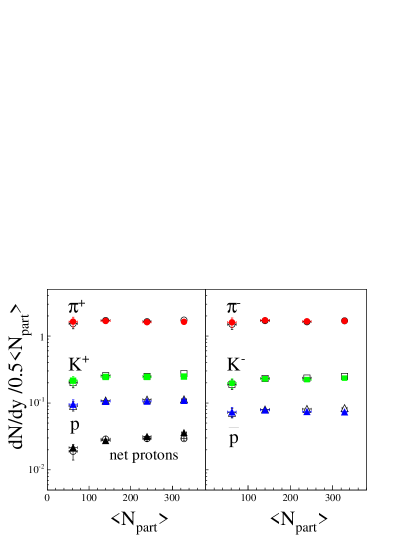
The rapidity densities are determined for each particle by integrating the measured spectrum over using the previously discussed functional form to extrapolate outside of the region of the measurement. Table 3 shows the results at and , respectively. The values per participant pair are shown as a function of in Fig. 9. The systematic errors on the yields and values from the extrapolation to the low momentum region are estimated as 510%. The only centrality dependence evident is a small increase in the rapidity densities for the and channels in going to more central collisions. The net proton rapidity densities show a increase from 4060% to 2040% and saturate after that. The proton excess,, is 0.150.010.120.02 at and 0.190.010.130.02 at from peripheral to central collisions. Our ratio from collisions showed a proton excess of 12% at midrapidity pp_run02 . This baryon asymmetry has been modeled at lower energy systems dima96 where it has been found to be significantly greater isr1 ; isr2 .
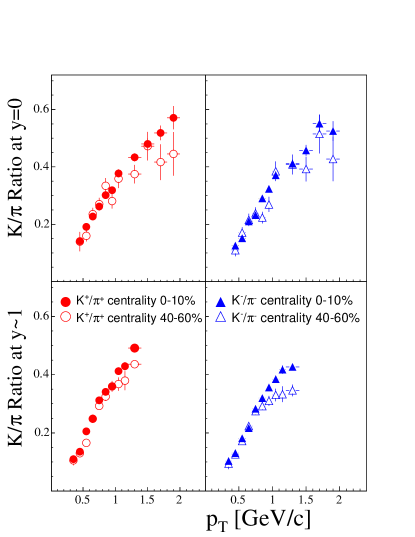
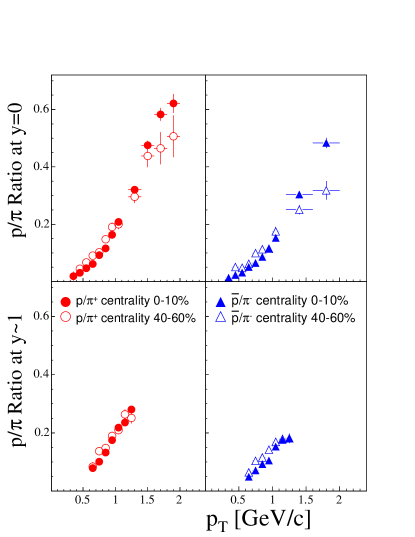
Figure 10 compares the ratios as a function of for central and peripheral collisions. The ratios for both charges increase with at both rapidities. There is no significant centrality dependence below 1 GeV/, however, the increase is faster in central than peripheral collisions at higher momentum. The weak centrality dependence of the production at RHIC star130 differs from the measurements at lower energy from AGS e8661 and SPS experiments sps1 , where the ratio is enhanced () from central collisions compared to peripheral collisions. This might be attributed to the energy dependent longitudinal geometry of the colliding nuclei fwang ; brahmsMeson , but further experimental and theoretical work is needed to understand the observed energy dependence.
Figure 11 shows the and ratios as a function of obtained at and for central and peripheral collisions. For both centralities the ratios rise fast at low . Around 2.0 GeV/ the ratios increase from peripheral to central collisions by 20% for and by 50% for ratios. Parton recombination and quark coalescence models describe qualitatively the observed baryon to meson ratios for central collisions up through the intermediate region extending to 45 GeV/ hwa ; greco .
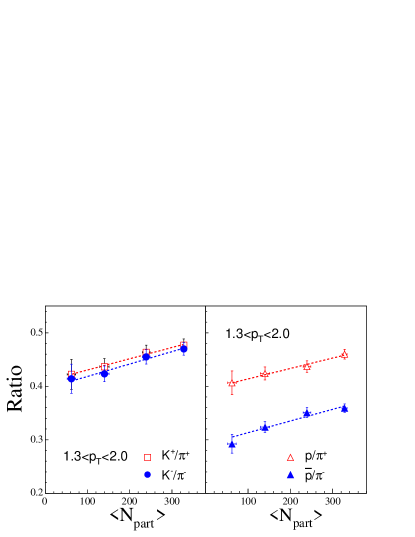
To clarify the centrality dependence of particle ratios at higher , and to see if the ratios of high particles are sensitive to the size of the interaction volume, we present the and ratios versus . Figure 12 shows that the and ratios for GeV/ increase with . This increase is similar for protons and kaons with little difference in slope between the particle and antiparticle ratios. The behavior suggests that rescattering and/or hydrodynamic effects are stronger for larger collision volumes.
IV SUMMARY
Particle production of identified charged hadrons, , , , and in Au+Au collisions at 200 GeV has been studied as a function of transverse momentum and collision centrality at and by the BRAHMS collaboration at RHIC. Significant collective transverse flow at kinetic freeze-out is estimated for both central and mid-central events. The magnitude of the radial expansion increases with the collision centrality indicating more hydro-like collectivity in the transverse direction for the central collisions. The , and yields relative to the pion production at RHIC show a strong transverse momentum dependence. Contrary to lower energy results no significant centrality dependent ratios below 1 GeV/ are observed at the RHIC energy. The and ratios increase with and centrality reaching a value of 0.6 and 0.5 at GeV/. The particle yield scaled by is nearly constant, and only weakly increasing with centrality for all particles. No significant changes for the bulk properties in hadron production are observed within one unit around midrapidity in Au+Au collisions at = 200 GeV.
Acknowledgements.
This work was supported by the division of Nuclear Physics of the Office of Science of the U.S. DOE, the Danish Natural Science Research Council, the Research Council of Norway, the Polish State Committee for Scientific Research and the Romanian Ministry of Education and Research. We thank the staff of the Collider-Accelerator Division of BNL for their excellent and dedicated work to deploy RHIC and their support to the experiment.References
- (1) For a review see E. Shuryak, Phys. Rep. 61, 71 (1980) and 115, 151 (1984).
- (2) H. Satz, Rep. Prog. Phys. 63, 1551 (2000).
- (3) P. Jacobs and X. N. Wang, Prog. Part. Nucl. Phys. 54, 443 (2005).
- (4) I. Arsene et al., BRAHMS Collaboration, Nucl. Phys. A757, 1-27 (2005). arXiv.org/abs/nucl-ex/0410020
- (5) B. B. Back et al., PHOBOS Collaboration submitted to Nucl. Phys. A (2004). arXiv.org/abs/nucl-ex/0410022
- (6) K. Adcox et al., PHENIX Collaboration submitted to Nucl. Phys. A (2004). arXiv.org/abs/nucl-ex/0410003
- (7) J. Adams et al., STAR Collaboration submitted to Nucl. Phys. A (2004). arXiv.org/abs/nucl-ex/0501009
- (8) P. Koch, B. Müller, and J. Rafelski, Phys. Rep. 142, 167 (1986).
- (9) I. G. Bearden et al., BRAHMS Collaboration, Phys. Rev. Lett. 93, 102301 (2004).
- (10) S. A. Bass, B. Müller, and D. K. Srivastava, Phys. Rev. Lett. 91, 052302 (2003).
- (11) E. Schnedermann, J. Sollfrank, and U. Heinz, Phys. Rev. C48, 2462 (1992).
- (12) S. S. Adler et al., PHENIX Collaboration, Phys. Rev. C69, 034909 (2004).
- (13) Electronic Physics Auxiliary Publication Service of AIP; BRAHMS Publication Figures and Data Archive, http://www4.rcf.bnl.gov/brahms/WWW/publication-data.
- (14) I. G. Bearden et al., BRAHMS Collaboration, Phys. Rev. Lett. 88, 202301 (2002).
- (15) Y. K. Lee et al., Nucl. Instr. and Meth. A516, 281 (2004).
- (16) M. Adamczyk et al., BRAHMS Collaboration, Nucl. Instr. and Meth. A499, 437 (2003).
- (17) X. N. Wang and M. Gyulassy, Phys. Rev. D44, 3501 (1991), http://nta0.lbl.gov/xnwang/hijing/
- (18) P. L. H. Christiansen, PhD thesis, Niels Bohr Institute, University of Copenhagen, 2003.
- (19) B. H. Samset, Master’s thesis, University of Oslo, 2001.
- (20) J. I. Jørdre, Master’s thesis, University of Bergen, 2000.
- (21) GEANT 3.21, CERN program library.
- (22) T. M. Larsen, Master’s thesis, University of Oslo, 2002.
- (23) C. Adler et al., STAR Collaboration, Phys. Rev. Lett. 89, 092301 (2002).
- (24) K. Adcox et al., PHENIX Collaboration, Phys. Rev. Lett. 89, 092302 (2002).
- (25) Olga Barannikova, nucl-ex/0403014 (2004)
- (26) F. Retire et al. nucl-ex/0111013 (2001), F. Retire and M. Lisa, Phys. Rev. C70, 044907 (2004).
- (27) S. Esumi, S. Chapman, H. van Hecke, and Nu Xu, Phys. Rev. C55, R2163 (1997).
- (28) P. Kolb and U. Heinz, nucl-th/0305084 (2003)
- (29) I. G. Bearden et al., BRAHMS Collaboration, Phys. Lett. B607, 42 (2005).
- (30) D. Kharzeev, Phys. Lett. B378, 238 (1996).
- (31) B. Alper et al., Phys. Lett. B47, 275 (1973).
- (32) A. M. Rossi et al., Nucl. Phys. B84, 269 (1975).
- (33) C. Adler et al., STAR Collaboration, Phys. Lett. B595, 143 (2004).
- (34) L. Ahle et al., E802 Collaboration, Phys. Rev. C60, 044904 (1999).
- (35) F. Sikler et al., NA49 Collaboration, Nucl. Phys. A661, 45c (1999).
- (36) F. Wang, J. Phys. G28, 2109 (2002).
- (37) I. G. Bearden et al., BRAHMS Collaboration, nucl-ex/0403050, submitted to Phy. Rev. Lett.
- (38) R. C. Hwa and C. B. Yang, Phys. Rev. C67, 034902 (2003).
- (39) V. Greco, C. M. Ko and P. Lvai Phys. Rev. Lett. 90, 202302 (2003).