FOPI Collaboration
]Received October 12, 2004
Charged pion production in Ru + Ru collisions at 400 and 1528 MeV
Abstract
We present transverse momentum and rapidity spectra of charged pions in central Ru + Ru collisions at 400 and 1528 MeV. The data exhibit enhanced production at low transverse momenta compared to the expectations from the thermal model that includes the decay of -resonances and thermal pions. Modification of the -spectral function and the Coulomb interaction are necessary to describe the detailed shape of the transverse momentum spectra. Within the framework of the thermal model, the freeze-out radii of pions are similar at both beam energies. The IQMD model reproduces the shapes of the transverse momentum and rapidity spectra of pions, but the predicted absolute yields are larger than in the measurements, especially at lower beam energy.
pacs:
25.75.Dw, 25.75.LdI introduction
Collision of relativistic heavy ions is a unique method to produce a large volume of excited nuclear matter in the laboratory at present. At incident beam energies near 1 GeV per nucleon nuclear matter can reach its density about two to three times higher than normal nuclear matter density at the temperature below 100 MeV rst1 ; hst1 . Major motivations for such studies aim to determine the nuclear equation of state (EoS) and to study the basic properties of quantum chromodynamics (QCD), the theory of strong interactions. These informations are important not only in their own virtue but also for understanding the behavior of astrophysical objects, such as neutron stars and supernovae gbr1 .
Experiments of this kind started with various ion beams at the BEVALAC in 70’s bev1 ; bev2 . Since the early 90’s the heavy ion synchrotron SIS at GSI-Darmstadt, Germany, took over a leading role in relativistic heavy ion collisions in the energy range up to 2 GeV. A scenario of several complementary experimental setups at SIS has allowed to perform thorough investigations of the EoS and in-medium properties of hadrons gsi1 ; gsi2 ; fpi1 ; fpi2 ; fopi-jkps .
Several observables, which are accessible in experiments, have been proposed as sensitive probes to characterize the properties of hot and dense nuclear matter. Among the prominent candidates are the collective flow wre1 ; jol1 and the particle production psen1 . Especially the production of pions has been suggested rather early stoe1 , as their yield can be connected to the temperature of the fireball through the nucleon resonances. However, later detailed theoretical investigations revealed that pions might not be so sensitive to the EoS bert1 ; kruse1 . Nevertheless the pion production in heavy ion collisions has attracted continuous attention because it is the most important inelastic channel in nuclear collisions dio ; e895_pi . The description of this process is necessary to understand the whole dynamic evolution of the fireball from the early stage to the freeze-out.
In this paper we present results on the pion production in Ru + Ru collisions at 400 and 1528 MeV. In the analysis we want to test in particular the modification of the -spectral function in heavy ion collisions wein1 ; wein2 and the Coulomb interaction wagn1 within the framework of the thermal model. Previously, similar ideas have been applied to the pion spectra in Au + Au collisions at 1 GeV by the KaoS collaboration at SIS/GSI wein1 ; wein2 ; wagn1 ; hong4 and at 10.8 GeV by the E877 collaboration at AGS/BNL e877-1 . The experimental data are also compared to microscopic transport model calculations, namely the Isospin Quantum Molecular Dynamics (IQMD) jai1 ; hart1 ; bass1 . Finding the common features in the interpretation of experimental data by using these two completely different approaches may shed some light on the process of particle production in relativistic nuclear collisions.
In Sec. II, the experimental setup and the method for the selection of collision centrality are described. The main experimental results on the pion spectra as functions of transverse momentum and rapidity are presented in Sec. III. In Secs. IV and V we compare the experimental data with the thermal model and the IQMD calculations, respectively. Finally, conclusions follow in Sec. VI.
II experiment
Collisions of nuclei with a target of 380 mg/cm2 thickness were studied at 400 and 1528 MeV with the FOPI detector at SIS. The beam intensities were typically on the order of 3104 ions/sec. A similar amount of events for ‘central’ and ‘medium central’ conditions was accumulated (some under ‘minimum bias’ conditions). The central trigger required a high multiplicity in the forward Plastic Wall (PLAWA), which covers the laboratory polar angles with full azimuthal symmetry, corresponding to about 15 % of the total geometric cross section . The FOPI detector system is described in detail elsewhere aga1 ; jri1 .
For the tracking of charged particles we use the central drift chamber (CDC) which is placed inside a uniform solenoidal magnetic field of 0.6 T. The CDC covers . Pions, protons, deuterons and heavier particles are identified by using the correlation of the specific energy loss () and the magnetic rigidity (the laboratory momentum divided by charge) determined by the curvature of the tracks. Details of the detector resolution and performance can be found in Refs. aga1 ; jri1 ; hong1 ; best1 .
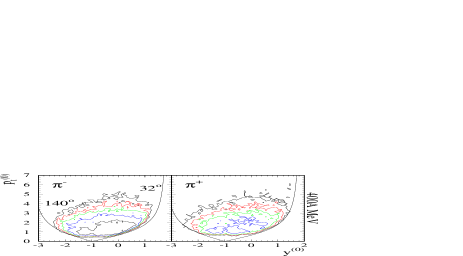
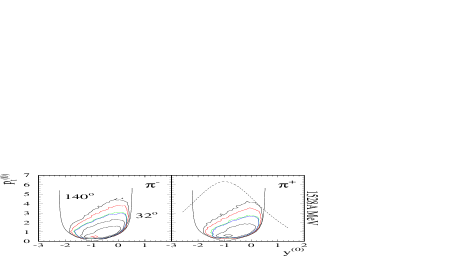
To illustrate the measured phase space we show the CDC acceptance of charged pions at both beam energies in Fig. 1. In this figure, represents the normalized transverse momentum calculated by , where is the transverse momentum, is the pion mass, and and are velocity and Lorentz gamma factor of the center of mass (c.m.), respectively. In addition, represents the normalized rapidity , where and are the pion rapidity in the laboratory frame and the c.m. rapidity of the collision system, respectively. As a result, the CDC covers more than 90 % of the full solid angle when the symmetry of the colliding system around midrapidity is utilized. For both beam energies a target absorption effect is visible at small values near the target rapidity region ().
The collision centrality of each event is determined by two methods depending on beam energy. At 400 MeV the variable is used, defined as ratio of total transverse () to longitudinal kinetic energy () in the center of mass:
| (1) |
where runs over all detected charged particles in the CDC and the PLAWA. Previously, it has been demonstrated that is a suitable variable for event centrality, especially in central collisions at beam energies MeV wre2 . At 1528 MeV the total multiplicity seen in the CDC and the PLAWA is used. In this paper we select events only for the upper most 380 mb, which corresponds to 10 % of the total geometric cross section. Total numbers of analyzed events under these cuts are approximately 80000 at 400 MeV and 240000 at 1528 MeV. We will adopt the natural units in the following.
III results


| (MeV) | Measured data | Extrapolated data | IQMD(HM) | IQMD(SM) | ||
|---|---|---|---|---|---|---|
| ( MeV) | ||||||
| 400 MeV | 35 | 0.11 | 0.32 | 0.46 | 0.45 | |
| 44 | 0.09 | 0.20 | 0.31 | 0.31 | ||
| 1528 MeV | 57 (low)/113 (high) | 3.81 | 5.92 | 7.04 | 7.70 | |
| 62 (low)/107 (high) | 3.11 | 4.50 | 5.63 | 6.18 |
Figures 2 and 3 show the experimental charged pion spectra in invariant form as a function of the transverse mass () for several rapidity bins. The spectra are corrected for the CDC track reconstruction efficiencies which are determined by a GEANT based Monte-Carlo simulation geant taking into account the detailed response of the FOPI detector; the IQMD model was used as event generator hart1 . The same method of event selection and particle identification was applied in the data analysis and in the simulation. The track reconstruction efficiencies of CDC for are evaluated by taking the ratio of the GEANT output to input spectra. This procedure has been applied in the two-dimensional space of and . On average these reconstruction efficiencies are determined to about 62 % and 80 % for and , respectively, at 400 MeV. These values become somewhat higher at 1528 MeV, namely 74 % for and 89 % for . Note that the overall tracking efficiency depends on various parameters such as the rapidity, and the track density. In general, the tracking efficiency for the algorithm used in this analysis is worse for smaller momentum. Figures 2 and 3 show the efficiency corrected spectra. More detailed discussions of the systematic errors on the invariant and the rapidity spectra will be given later in this section.
The invariant spectra of pions at 400 MeV exhibit a one-slope structure in all rapidity bins (Fig. 2) whereas clearly two slopes are present at 1528 MeV (Fig. 3). Consequently, at 400 MeV, the invariant spectra for each rapidity slice are fitted by one exponential function as follows:
| (2) |
where and are the rapidity dependent normalization constant and the inverse slope parameter, respectively. At 1528 MeV, a sum of two exponential functions is required to describe spectra. Solid and dashed lines in Figs. 2 and 3 represent the corresponding fit functions to the and invariant spectra, respectively, in the range 120 MeV. Note that the one- and two-slope fit functions are the simplest phenomenological description of the pion data. The fitted values at midrapidity are listed in Table 1. Since the parametrization by Eq. (2) describes the pion spectra reasonably well over all measured , they are used to extract the rapidity distributions. In details, we integrate the fitted exponential functions from 0 to , hence also accounting for the missing region in the CDC acceptance (see Fig. 1). The extrapolation to the missing low region is rather significant as shown in Table 1 at midrapidity.
The fully extrapolated rapidity distributions are shown in the two top panels of Fig. 4 for 400 MeV and Fig. 5 for 1528 MeV, where the forward c.m. spectra are reflected around midrapidity by using the mass symmetry of the collision system. The dashed lines in Figs. 4 and 5 are the simplest thermal model predictions for an isotropic thermal source at the c.m. schne1 :
| (3) | |||||
with and at midrapidity (higher component at 1528 MeV). Here, is 35 (44) MeV at 400 MeV and 113 (107) MeV at 1528 MeV for (). In Figs. 4 and 5 the rapidity distributions from the isotropic thermal source are normalized at midrapidity. Obviously, for both beam energies the experimental rapidity distributions of are wider than the isotropic thermal source sitting at midrapidity. Also represented by dotted lines are the estimated target/projectile components which are merely Gaussian fits to the differences between data and the dashed lines. The sums of the two contributions are shown by solid lines in Figs. 4 and 5.
Our strategy to integrate the exponential fits of the invariant spectra for the final distributions has been justified by the GEANT based Monte-Carlo simulation geant ; the input rapidity spectra agree nicely with the -integrated distributions obtained by the exponential fits to the efficiency corrected GEANT output invariant spectra. Nevertheless the most significant source of systematic errors for the distribution is the uncertainty in the estimation of the CDC efficiency which relies on the tracking strategy. Such a systematic error is significant at 400 MeV, but it becomes much smaller at 1528 MeV, however. Furthermore, this uncertainty depends on . It is negligible in the low region ( 200 MeV), but increases with transverse momentum, reaching about 50 % at 300 MeV in case of the 400 MeV beam energy (the error bars in Figs. 2 and 3 reflect the systematic as well as statistical errors). As a result, the systematic error in the -integrated distributions which is caused by the uncertainty of the CDC track reconstruction is estimated to about 15 % at 400 MeV and 6 % at 1528 MeV. Other sources of systematic errors which are similar at both beam energies can be summarized as follows. The systematic error in the particle identification (2 %) is determined by changing various selection criteria for good event and track samples. In addition, different fitting ranges in also cause maximal 2 % uncertainty in . The error due to the extrapolation procedure over the complete -range is estimated to be about 10 %. For this estimation, we first use various fit functions, e.g., an exponential fit in the invariant and the Boltzmann representations. Furthermore, we also use the IQMD model; the difference between the extrapolated yields by the fit functions to the data and the pion yields by IQMD for 120 MeV are less than 2 % at both beam energies (note that, for this test, the IQMD spectra should be normalized to the measured pion spectra for 120 MeV because the absolute yields by IQMD are always larger than the data as will be clear in Sec. V). Employing the IQMD model for the extrapolation to lower can be supported by confirming that the yield ratios of to by IQMD (independent of the EoS) agree with the estimations by the fit function to the data within 5 % for 120 MeV at both beam energies. Finally, assuming that the sources of various systematic errors are incoherent, we calculate overall systematic errors for the of both charged pions of 18 % and 12 % at 400 and 1528 MeV, respectively, by taking a quadratic sum of all contributions. Only the statistical errors are shown for the spectra presented in this paper, unless explicitly noted differently.
The pion multiplicities per event at 400 MeV are and for the most central 10 % of . The resulting agrees with the isobar model calculation rst1 , which is shown by the solid line in the bottom panel of Fig. 4, within the quoted errors. Similarly, the pion multiplicities per event at 1528 MeV are , , yielding , shown in the bottom panel of Fig. 5, again in nice agreement with the isobar model result.
IV Thermal Model
In Sec. III, we have seen the indication that the rapidity distributions of pions in central Ru + Ru collisions are wider than the isotropic thermal source at midrapidity by comparing the data with the simplest thermal model formula, Eq. (3) schne1 . In order to investigate this observation further, a more instructive (but more complicated) thermal model is formulated in this section, including the decay of -resonances to pions explicitely.
The thermal model adopted in this paper has been described previously in Refs. wein1 ; wein2 ; hong4 ; hong2 . Decay pions from -resonances, , and additional thermal pions, , are main ingredients in this model. For the momentum spectra of and at freeze-out, we assume an isotropic expanding thermal source at the c.m. with the freeze-out temperature 30 wre2 and 84 MeV hong1 at 400 and 1528 MeV, respectively. Furthermore, the radial flow velocity 0.3 is included for both beam energies. We use the following expression, which was proposed by Siemens and Rasmussen for the first time in late 70’s rasm1 , for the thermal distributions of ’s and ’s:
| (4) | |||||
where and . Here and are the total energy and respective momentum of particle in c.m.

Two different mass distributions of the resonance have been considered with and without including the interactions in the thermal fireball. Weinhold and collaborators have exploited the detailed calculation for the thermodynamic potential of a system consisting of pions and nucleons wein1 ; wein2 . Two -spectral functions are shown in the bottom panel of Fig. 6, where the dashed and solid lines are for the free and the modified spectral functions, respectively. The free spectral function is simply a normal Breit-Wigner shape
| (5) |
where is the energy-dependent width of the koch1 :
| (6) |
where
| (7) |
and
| (8) |
with being the nucleon mass. The parameters used in this analysis are 120 MeV, 1232 MeV, and 300 MeV, following Ref. wein2 .
Now considering the interactions, the spectral function is expected to be modified as
| (9) |
where the phase shift of the -resonance (-channel), , can be deduced by
| (10) |
The phase shift factor is displayed in the upper panel, and the resulting -spectral function in the bottom panel of Fig. 6. It demonstrates a clear difference between the two spectral functions and , especially close to the threshold; the modified function is shifted to lower masses. Note that can be uniquely determined by the measured phase shift from Eq. (9) in a model-independent way.


In the present thermal model, the -resonances in the thermally equilibrated system start to decay at the surface of the fireball at freeze-out. The resulting invariant spectra of near c.m. (now as a function of ) from the thermal model calculations are shown in the left panels of Fig. 7, where the dashed lines are obtained by and the solid lines are obtained by . In the model calculations, thermal weighting factors are properly taken into account for both spectral functions.
In Fig. 7, the ratios of pions from the -decay to all pions, , are determined by fitting the model calculations to the measured spectra; 72 % at 400 MeV and 76 % at 1528 MeV. Comparing to the previous results, the estimate at 1528 MeV is about 12 % higher than the number estimated for smaller Ni + Ni collisions at similar beam energy (1450 MeV) hong2 . This implies that the fraction of projectile and target nucleons excited to -resonances at freeze-out is higher for a larger collision system. But this ratio does not show the beam energy dependence between 400 and 1528 MeV. One important aspect is that at 400 MeV the ratio is not uniquely determined with the transverse momentum spectra alone, as they can be well described by one exponential function. However, by fitting the transverse momentum spectra and the yields at midrapidity simultaneously, can be uniquely fixed (see Fig. 8 and the relevant text below).
From Fig. 7 it is clear that the free spectral function can not reproduce data at low region ( MeV), and that the modified spectral function can enhance the yields at low , which brings the model calculation closer to the measurement. The same effect has also been observed before at similar beam energies between 1 and 2 GeV wein1 ; wein2 ; hong4 ; eskef .
The contributions by higher baryonic resonances, e.g., (1440), are negligible because of relatively low freeze-out temperature. Even in 1.9 GeV Ni + Ni collisions the total contribution by higher mass resonances to total pion yield has been estimated to only 5 % hong2 , hence this factor is neglected in the present thermal model analysis for the pion yields. Besides the yield estimation, higher mass resonances can not explain the differences in transverse momentum spectra between the data and the model calculations with in the left panels of Fig. 7. If we increase the number of higher mass resonances to compensate the difference at low by channels with , the pion contribution by channels also increases accordingly because the branching ratios are fixed by the experimental data pdg . But the decay momenta of pions in processes are usually larger than the ones in the -decay so that the shape of the spectra at higher becomes much flatter than the data. Hence we conclude that the modification of the -spectral function is required to describe the present pion spectra.
As next step, we consider the effect of the Coulomb potential in order to explain the observed difference between the and spectra in the low- region. With a static approximation for the Coulomb field wagn1 ; e877-1 ; kapu1 , which neglects the time evolution of the fireball, ’s at freeze-out feel the effective Coulomb potential given by
| (11) |
where is the radius of the fireball at freeze-out, the effective charge contained in the fireball. Then, the total energy of the emitted pion is modified, depending on their charge, in the following way:
| (12) |
where is the initial pion momentum without Coulomb potential. Now the number of particles with momentum , , can be related to by the Jacobian:
| (13) |
by using the identities and , where
| (14) |
for positive () and negative () particles. In order to determine the strength of the Coulomb potential, , the experimental yield ratios of to , i.e., , at a given momentum are fitted by
| (15) | |||||
where the normalization constant and the Coulomb potential are two free fit parameters to be determined by the data. The constant is responsible for the height whereas determines the slope of at low . The right panels of Fig. 7 show the comparisons of the data with thermal model calculations at both beam energies, assuming the same momentum dependence of spectra before the Coulomb correction, in this case. The values of and MeV describe data well at 400 MeV, especially in the low- region where the spectra differ significantly. Similarly, and MeV are the best set of parameters at 1528 MeV. The agreement between the data and the model calculations in at midrapidity is reasonable at both beam energies. Note that the same analysis technique as in this paper can reproduce the spectra, measured in Au + Au collisions at 1 GeV by the KaoS collaboration, with 25 MeV hong4 .
It should be emphasized that the dynamical consideration becomes important only when the velocity of pions is smaller than the surface expansion velocity () of the fireball kapu1 . Charged pions with the velocity larger than see a time-independent Coulomb potential, and the present thermal model is applicable only for those pions. For the average radial flow velocity , is about 0.40 (or 0.53) by assuming a linear (or quadratic) flow profile as a function of the fireball radius. Then, the critical momentum () of pion is about 60 (90) MeV for the linear (quadratic) flow profile. These estimated limits, shown by thick vertical solid lines in the left panels of Fig. 7, are close to or slightly lower than the low- limit of our measured pion spectra, which is about 100 MeV.
By using the determined values of , we can generate the invariant spectra of by Eqs. (13) and (14) at 400 and 1528 MeV. The dotted and dash-dotted lines in the left panels of Fig. 7 represent the final invariant spectra obtained by the thermal model for and , respectively, after the Coulomb correction is included. Good agreement between the data and the thermal model calculations can be found.
Once having estimated the magnitude of the Coulomb potential, one can deduce the source size at thermal freeze-out by using Eq. (11). The centrality condition used in this analysis corresponds to the average geometrical impact parameter of 2.3 fm. The evaluated number of participant nucleons () can be estimated to about 146 by employing the recipe given in Ref. gos1 . After scaling with of projectile and target, one obtains . The corresponding freeze-out radii are 5.6 2.0 fm at 400 MeV and 6.0 1.5 fm at 1528 MeV. These results demonstrate that the thermal freeze-out radius is almost independent of the beam energy. We also compare the freeze-out radii estimated in this paper with two other published values that were obtained by using the same method. Having applied the present thermal model to the KaoS spectra at the SIS, the pion freeze-out radius was estimated as 6.3 0.5 fm for Au + Au collisions at 1 GeV hong4 . When the same model was applied to the E877 spectra at the AGS, the pion freeze-out radius was estimated as 6.4 4.5 fm for Au + Au collisions at 10.8 GeV e877-1 . Although the error in the AGS result is too big to draw any meaningful conclusion, the mean radii do not show any beam energy dependence for Au + Au collisions, too. It is not possible to compare directly the present results with other numbers mentioned above because the system size is not the same (the mass number of Au is more than twice that of Ru). Therefore, we compare the ratio of the estimated freeze-out radius to the radius of the projectile (or target) nucleus. The results are summarized in Table 2; the resulting ratios are very similar at different beam energies between 0.4 and 10.8 GeV despite of a small difference in the collision centrality.
| ( GeV) | System | Centrality (%) | |
|---|---|---|---|
| 0.4 | Ru + Ru | 10 | 1.0 0.4 |
| 1.0 | Au + Au | 14 | 0.9 0.2 |
| 1.5 | Ru + Ru | 10 | 1.1 0.3 |
| 10.8 | Au + Au | 4 | 0.9 0.6 |


Only the midrapidity spectra of pions are tested for the present thermal model . At forward and backward rapidities, the situation is more complicated because of the observed incomplete stopping and partial transparency of projectile and target nuclei at these beam energies hong1 ; hong3 ; hong_panic ; willy04 . Figure 8 shows the measured rapidity spectra of ’s in comparison with the thermal model calculations; the data and the model calculations are compared only for 120 MeV due to the uncertainty of the spectral shape at the low- region in the present thermal model, which are indicated by thick vertical solid lines in Fig. 7. This comparison demonstrates that the thermal model calculations, assuming isotropic midrapidity thermal source, give somewhat narrower rapidity distributions than the data at both beam energies. In order to reproduce the full measured rapidity spectra, the longitudinally elongated, rather than isotropic, thermal source of -resonances and pions should be assumed. Although this kind of adjustment is, in principle, possible by changing the widths of the rapidity distributions of ’s and ’s, we do not attempt to calculate the exact rapidity spectra of pions at present.
V Comparison with IQMD


The Isospin Quantum Molecular Dynamics (IQMD) model is a nonequilibrium transport model which considers the isospin degree of freedom for the nucleon-nucleon cross section and the Coulomb interaction hart1 . In the framework of the IQMD model, pions are explicitly formed via the decay of the -resonances, and experimental cross sections are considered. The IQMD version utilized in this analysis contains only the lowest three -states. A modified detailed balance treatment, which accounts for their finite width, is also considered. As a consequence, the appearing spectral shape of ’s is changing in the course of the reaction. Therefore, in the charged pion spectra, the IQMD model has to show, in principle, the effects of the Coulomb interaction in addition to other collision effects including the interactions.
IQMD has been successful in reproducing various aspects of heavy ion collisions, including the pion production in Au + Au collisions at 1 GeV bass1 . In this section, we compare the present experimental pion spectra with the IQMD calculations in Ru + Ru collisions at 400 and 1528 MeV. For these calculations, a hard (compressibility = 380 MeV) and a soft ( = 200 MeV) EoS versions are used, including the momentum dependence of the nucleon interaction (MDI); they are denoted by IQMD(HM) and respective IQMD(SM) in the following. Note that the IQMD events are analyzed with the same analysis procedure as the data. As in the data analysis, we also use the distribution at 400 MeV to select the most central 10 % of whereas at 1528 MeV the total multiplicity measured in the PLAWA and the CDC acceptance is taken.
Top and middle panels of Figs. 9 and 10 show the comparisons of the experimental spectra (circles) with the IQMD(HM) calculations (open triangles) for and , respectively. The IQMD(SM) calculations (inverted solid triangle) are almost identical with IQMD(HM) at 400 MeV, but they are about 10 % larger in yields for both charges at 1528 MeV. Therefore, we include these results only in Fig. 10 at the higher beam energy.
In accordance with earlier investigations marc1 , we find that the IQMD model produces too many pions in Ru + Ru collisions, especially at 400 MeV. In order to compare the shape of the spectra, we need to scale the IQMD results by 0.72 and 0.67 for and , respectively, at 400 MeV for both HM and SM (solid lines in Fig. 9). These scale factors are determined in such a way that the integration of the model yields the same value as the integrated data distribution. Similarly, we also need to scale the IQMD results by 0.90 for and 0.93 for at 1528 MeV with HM (solid lines in Fig. 10). On the other hand, this scaling factor is reduced to 0.82 for and 0.84 for with the choice of SM (dashed lines in Fig. 10). The scaled distributions from the IQMD calculations can nicely reproduce the shape of the measured spectra of pions at both beam energies. The bottom panels of Figs. 9 and 10 show that the ratios of the distributions of and agree with the data within errors at both beam energies.
The left panels of Fig. 11 display the comparisons of data with the model calculations for the invariant spectra of at midrapidity. Similar to the experimental data, the IQMD(HM) calculations show different shapes for and in the low transverse momentum region, which can be attributed to the Coulomb interaction. These differences can be presented more clearly in the ratio as a function of (right panels of Fig. 11). The IQMD(HM) calculation agrees very nicely with the data. The IQMD(SM) calculation gives very similar results on the transverse momentum spectra of pions and their ratios except about 10 % higher production than HM at 1528 MeV.
VI conclusions
We have presented charged pion spectra in central Ru + Ru collisions at 400 and 1528 MeV. In both beam energies the uppermost 10 % of the geometric cross section have been selected. The measured transverse momentum spectra in their invariant form as a function of can be described very well by one exponential function at 400 MeV and by a sum of two exponential functions at 1528 MeV.
The results from thermal model have been compared to the transverse momentum spectra of pions at midrapidity. Pions from the decay of the thermal -resonances in addition to thermal pions are main ingredients of the present thermal model. The momentum distributions of -resonances and thermal pions at freeze-out are assumed to be an expanding isotropic source at the center of mass. Pion spectra at low transverse momentum require the modification of the -spectral function due to the interactions at both beam energies. The Coulomb potential is necessary to explain the different spectral shapes between the and spectra in the low transverse momentum region. With this we find excellent agreement between the data and the thermal model calculations. Using the estimated strength of the Coulomb potential, which is determined by the momentum dependent yield ratio of to , the freeze-out radius of the fireball has been deduced to be about 6.0 fm at both 400 and 1528 MeV. The rapidity spectra of pions require the longitudinally elongated (not isotropic) thermal source of ’s and pions.
Finally, the experimental data are compared to IQMD model calculations. Although the absolute yields of charged pions in the model are somewhat larger (about 30 and 10 % at 400 and 1528 MeV, respectively), the shapes of the rapidity and transverse momentum spectra agree nicely with the data. The IQMD model displays that the yield ratios of to at low transverse momenta deviate from unity due to the Coulomb interaction; the agreement between the data and the IQMD model is satisfactory. The pion yield is independent of the choice of the equation of state at 400 MeV, whereas it is about 10 % higher with a soft than with a hard EoS at 1528 MeV . The comparison of the pion transverse momentum and rapidity spectra with two completely different approaches (thermal model and IQMD) renders us the importance of the Coulomb interaction and the collision effects including the interactions in the pion spectra at SIS energies.
Acknowledgements.
We gratefully acknowledge support from the Korea Research Foundation (KRF) under Grant No. KRF-2002-015-CS0009, and from the Deutsche Forschungsgemeinschaft (DFG) under the project No. 446 KOR-113/76/0.References
- (1) R. Stock, Phys. Rep. 135, 259 (1986).
- (2) H. Stöcker and W. Greiner, Phys. Rep. 137, 277 (1986).
- (3) G. E. Brown, Phys. Rep. 163, 167 (1988).
- (4) A. Sandoval, R. Stock, H. E. Stelzer, R. E. Renfordt, J. W. Harris, J. P. Brannigian, J. V. Geaga, L. J. Rosenberg, L. S. Schroeder, and K. L. Wolf, Phys. Rev. Lett. 45, 874 (1980).
- (5) S. Nagamiya, M. C. Lemaire, E. Moeller, S. Schnetzer, G. Shapiro, H. Steiner, and I. Tanihata, Phys. Rev. C 24, 971 (1981).
- (6) KaoS Collaboration, D. Brill et al., Phys. Rev. Lett. 71, 336 (1993).
- (7) TAPS Collaboration, O. Schwalb et al., Phys. Lett. B 321, 20 (1994).
- (8) FOPI Collaboration, D. Pelte et al., Z. Phys. A 357, 215 (1997).
- (9) FOPI Collaboration, D. Pelte et al., Z. Phys. A 359, 55 (1997).
- (10) B. Hong for the FOPI Collaboration, J. Korean Phys. Soc. 43, S32 (2003).
- (11) W. Reisdorf and H. G. Ritter, Annu. Rev. Nucl. Part. Sci. 47, 663 (1997).
- (12) J.-Y. Ollitrault, Nucl. Phys. A638, 195c (1998).
- (13) P. Senger and H. Ströbele, J. Phys. G 25, R59 (1999).
- (14) H. Stöcker, A. A. Ogloblin, and W. Greiner, Z. Phys. A 303, 259 (1981).
- (15) G. F. Bertsch, H. Kruse, and S. Das Gupta, Phys. Rev. C 29 R673 (1984).
- (16) H. Kruze, B. V. Jacak, and H. Stöcker, Phys. Rev. Lett. 54, 289 (1985).
- (17) DIOGENE Collaboration, J. Poitou et al., Nucl. Phys. A536, 767 (1992).
- (18) E895 Collaboration, J. L. Klay et al., Phys. Rev. C 68, 054905 (2003).
- (19) W. Weinhold, B. Friman, and W. Nörenberg, Phys. Lett. B 433, 236 (1998).
- (20) W. Weinhold, Ph. D. Thesis, Technische Universität Darmstadt, Germany, 1998.
- (21) KaoS Collaboration, A. Wagner et al., Phys. Lett. B 420, 20 (1998).
- (22) B. Hong, J. Korean Phys. Soc. 38, L291 (2001).
- (23) E877 Collaboration, J. Barrette et al., Phys. Rev. C 62, 024901 (2000).
- (24) J. Aichelin, Phys. Rep. 202, 233 (1991).
- (25) C. Hartnack, Rajeev K. Puri, J. Aichelin, J. Konopka, S. A. Bass, H. Stöcker, and W. Greiner, Eur. Phys. J. A 1, 151 (1998).
- (26) S. A. Bass, C. Hartnack, H. Stöcker, and W. Greiner, Phys. Rev. C 51, 3343 (1995).
- (27) FOPI Collaboration, A. Gobbi et al., Nucl. Instrum. and Methods A 324, 156 (1993).
- (28) J. Ritman for the FOPI Collaboration, Nucl. Phys. (Proc. Suppl.) B44, 708 (1995).
- (29) FOPI Collaboration, B. Hong et al., Phys. Rev. C 57, 244 (1998).
- (30) FOPI Collaboration, D. Best et al., Nucl. Phys. A625, 307 (1997).
- (31) FOPI Collaboration, W. Reisdorf et al., Nucl. Phys. A612, 493 (1997).
- (32) GEANT-Detector Description and Simulation Tool, CERN Program Library Long Writeup W5013 (CN Division, CERN, 1993).
- (33) E. Schnedermann, J. Sollfrank, and U. Heinz, Phys. Rev. C 48, 2462 (1993).
- (34) FOPI Collaboration, B. Hong et al., Phys. Lett. B407, 115 (1997).
- (35) P. J. Siemens and J. O. Rasmussen, Phys. Rev. Lett. 42, 880 (1979).
- (36) J. H. Koch, N. Ohtsuka, and E. J. Moniz, Ann. Phys. (NY) 74, 99 (1984).
- (37) FOPI Collaboration, M. Eskef et al., Eur. Phys. J. A 3, 335 (1998).
- (38) Particle Data Group, C. Caso et al., Eur. Phys. J. C 3, 1 (1998).
- (39) A. Ayala and J. Kapusta, Phys. Rev. C 56, 407 (1997).
- (40) J. Gosset, H. H. Gutbrod, W. G. Meyer, A. M. Poskanzer, A. Sandoval, R. Stock, and G. D. Westfall, Phys. Rev. C 16, 629 (1977).
- (41) FOPI Collaboration, B. Hong et al., Phys. Rev. C 66, 034901 (2002).
- (42) B. Hong for the FOPI Collaboration, Nucl. Phys. A721, 317c (2003).
- (43) FOPI Collaboration, W. Reisdorf et al., Phys. Rev. Lett. 92, 232301 (2004).
- (44) M. R. Stockmeier, W. Reisdorf, N. Herrmann, M. Merschmeyer, D. Pelte, and K. Wisniewski, GSI Scientific Report 2001-1 (GSI, Germany, 2002) p. 35.