Hindrance of Heavy-ion Fusion at Extreme Sub-Barrier Energies in Open-shell Colliding Systems
Abstract
The excitation function for the fusion-evaporation reaction 64Ni + 100Mo has been measured down to a cross-section of 5 nb. Extensive coupled-channels calculations have been performed, which cannot reproduce the steep fall-off of the excitation function at extreme sub-barrier energies. Thus, this system exhibits a hindrance for fusion, a phenomenon that has been discovered only recently. In the -factor representation introduced to quantify the hindrance, a maximum is observed at =120.6 MeV, which corresponds to 90% of the reference energy , a value expected from systematics of closed-shell systems. A systematic analysis of Ni-induced fusion reactions leading to compound nuclei with mass A=100-200 is presented in order to explore a possible dependence of the fusion hindrance on nuclear structure.
pacs:
25.70.Jj, 24.10.EqI Introduction
Heavy-ion induced fusion reactions have been studied extensively for more than forty years, especially since the discovery of the sub-barrier enhancement phenomenon sum1 ; sum2 ; sum3 ; sum4 ; sum5 . Coupled-channels descriptions were shown to explain the phenomenon successfully hagi0 ; rowl . Recently, evidence was found for a strong hindrance of the fusion process at extreme sub-barrier energies, an effect for which there is no satisfactory explanation in present model calculations jiang0 . A systematic survey of existing data from the literature shows that there is a regular pattern to the energy dependence for the appearance of fusion hindrance jiang1 . For stiff, closed-shell colliding systems, a significant maximum in the -factor is present as a function of the beam energy. This maximum signals the onset of sub-barrier hindrance, and the energy, , at which it is located can be described well by an empirical formula jiang1 :
| (1) |
where . For softer systems, this formula provides an upper limit for the energy at which the -factor has its maximum.
Fusion hindrance at extreme sub-barrier energies is relevant, not only for understanding the dynamics of reactions between complex systems, but also for astrophysics and for the synthesis of superheavy elements.
The influence of nuclear structure on this hindrance behavior was first studied in a detailed comparison jiang2 for the colliding systems: 58Ni + 58Ni beck1 , 58Ni + 60Ni stef3 , 58Ni + 64Ni beck2 , and 64Ni + 64Ni jiang2 , where the systems are arranged in order of decreasing stiffness. For 64Ni + 64Ni, an open-shell colliding system, the measured location in energy of the -factor maximum is about lower than the value expected from Eq. 1 jiang2 , while the other systems are more in line with the systematics.
The aim of the present paper is to further investigate the hindrance phenomenon by measuring fusion evaporation for the open-shell system 64Ni + 100Mo. Compared to 64Ni, 100Mo is a transitional nucleus with two protons outside the closed proton shell. Two earlier measurements of fusion excitation functions for 64Ni + 100Mo can be found in the literature rehm ; halb . The minimum cross section measured in these two experiments is about 0.4 mb. Since the hindrance behavior is expected (from Eq. 1) to occur at much lower energies, the main aim of the present measurement was an extension of the excitation function into the nb region in order to localize and quantify this hindrance.
II Experimental Procedure and Results
The experiment was performed with 64Ni beams in the energy range of 196-262 MeV from the superconducting linear accelerator ATLAS at Argonne National Laboratory. The maximum beam current used was 60 pnA. The high melting point of the target material, metallic molybdenum evaporated on a 40g/cm2 carbon foil, prevented damage to the target by the relatively high beam current. The target thickness was constant during the experiment, as monitored with Si detectors. Thin targets with thicknesses of 8 or 18g/cm2 were used in order to reduce the correction for target thickness in the energy regime of steep fall-off of the excitation function. The isotopic abundance of 100Mo was 97.42, with the remainder coming from 98Mo (0.96%), 97Mo (0.28%), 96Mo (0.34%), 95Mo (0.29%), 94Mo (0.18%), and 92Mo (0.53%). The selection of the beam and target combination excluded the possibility of background from fusion reactions coming from beam or target contaminants jiang0 ; jiang1 . Two surface-barrier Si detectors, located at 43∘ with respect to the beam direction, served as monitors. The absolute cross sections for fusion-evaporation were determined by using elastic scattering measured with the monitors.
The evaporation residues were identified and measured with the Fragment Mass Analyzer (FMA) dav1 , which has been upgraded with the installation of a split-anode in the first electric-dipole dav3 . The background, originating mostly from scattered beam, was greatly suppressed after this upgrade. In order to push the cross section measurements to the lowest level, a new focal-plane detector with the configuration PGAC-TIC-PGAC-TIC-PGAC-IC, was used in the experiment. Here, the symbols PGAC stand for - position sensitive parallel grid avalanche counters hend , TIC for transmission ionization chambers penn , and IC for a large volume multi-anode ionization chamber. The first PGAC was mounted at the horizontal (-direction) focal-plane of the FMA.
The -focus condition occurs about 70 cm downstream of the focal-plane, which is nearly at the middle of the last ionization chamber. The three sets of position signals and were measured with the three PGAC’s. The flight-times and obtained from PGAC1-PGAC2 and PGAC1-PGAC3 were also recorded. Seven signals were measured with the ionization chambers (the first four - in the two transmission ionization chambers and the last three - in the final ionization chamber, IC). Another time-of-flight signal, , measured the time difference between the rf-system of the accelerator and the first PGAC. Three additional signals from the PGAC’s were also recorded. The three PGAC’s and two TIC’s operated at a fixed pressure of 3 torr of isobutane. The last ionization chamber had an adjustable pressure of 22 - 30 torr of isobutane. There was one 0.13 mg/cm2 Mylar pressure foil in front of the first PGAC, and another one with a thickness of 0.22 mg/cm2 located between the third PGAC and the last ionization chamber. This setup allowed for full tracking of each particle detected in the system, and provided very good separation between evaporation residues and background events. A more detailed description of the new detector system will be published elsewhere jiang3 .
For most settings of the FMA, two charge states of the residues were collected simultaneously. For the energies = 260.5, 245.8, 209.1, 207.1 and 202.2 MeV, full charge state distributions were measured, while for most other energies, two FMA settings, i.e. four charge states were recorded. At the four lowest energies, only two charge states were measured. From the full charge state distributions, charge state fractions were determined for extrapolation to all other energies. The energy distributions and angular distributions of evaporation residues were calculated with the statistical code PACE pace . Total angular distributions for fusion-evaporation have been measured in Ref. rehm for 64Ni + 100Mo. In order to check the PACE code, calculations were compared with these experimental angular distributions of Ref. rehm and good agreement was found as long as the total calculated angular distributions were taken as a weighted sum of the angular distributions of the different masses from our measurements and folded with multiple scattering. Whereas in Ref. rehm rather thick targets were used, the corrections from multiple scattering are small in the present experiment. The transport efficiencies of the FMA were calculated with these angular distributions together with Monte Carlo simulations, using a modified version of the GIOS Code jian . The large momentum acceptance, 10 , and the large angular acceptance, 2.3∘, of the FMA result in a high detection efficiency for the residues.
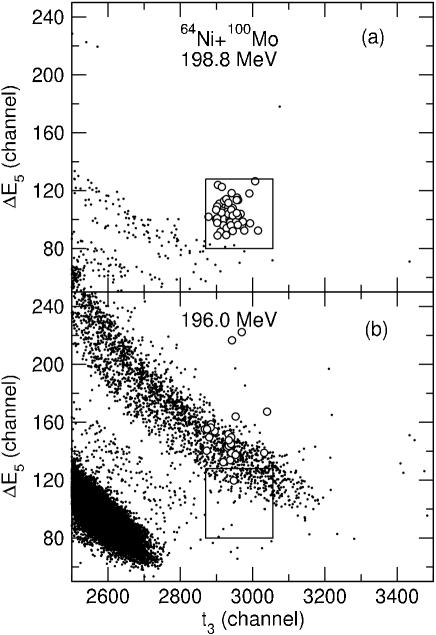
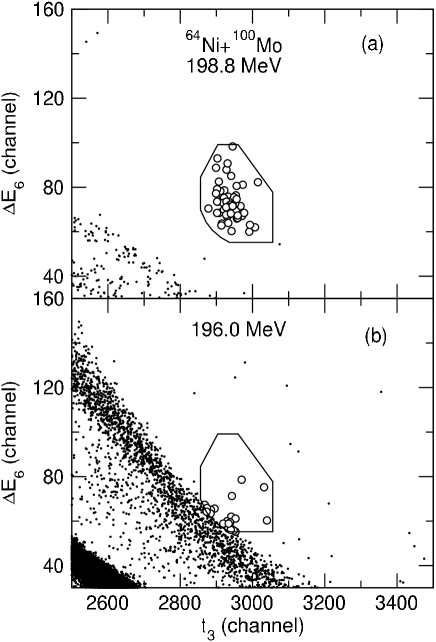
The flight-time between PGAC1 and PGAC3, together with a signal measured in a counter far behind the focal plane (e.g. ), was found to give the best separation of the residues from background events. Two-dimensional plots of vs. are shown in Fig. 1, indicating the excellent separation achieved with these two quantities. Down to a cross section level of 300 nb, the evaporation residues could be identified on the basis of these two parameters alone. The events that fall within the expected window for evaporation residues are shown as open circles in Fig. 1a. Events shown by small points originate from beam particles, scattered from the beam pipe or from the area of the “beam stop” at the first split anode. The events in Fig. 1a correspond to a cross section of 242 nb obtained in a 12 hours run. A two-dimensional plot of vs. , corresponding to the same events is shown in Fig. 2a. At this energy evaporation residues (open circles) are again well separated from background events (small points).
At the lowest energy, =196.0 MeV, we find that 23 events fall within the expected evaporation residue window as illustrated in Fig. 1b. Most of these events are suspiciously close to an intense band of scattered beam particles which borders the fusion evaporation residue window. By examining the vs. spectrum shown in Fig. 2b, it is evident that only one of these events falls within the expected range of the signal. However, this event does not have the correct -value as will be demonstrated below.
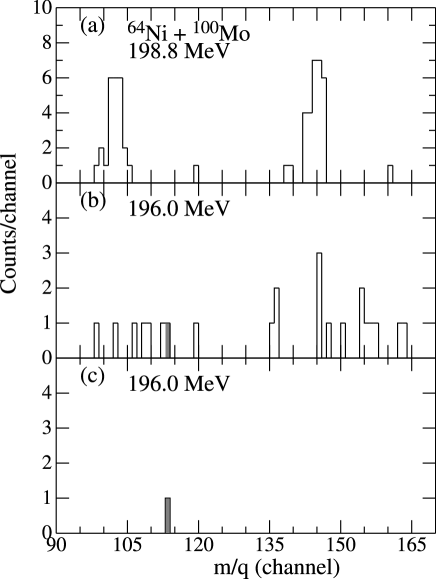
An spectrum containing the 23 events that fall inside the window is given in Fig. 3b. This spectrum is spread out over the whole range and does not appear to be associated with fusion evaporation residue events seen at higher energies to be concentrated near channels 103 and 145 (see Fig. 3a). The only candidate event at =196.0 MeV, which satisfies the conditions for the , and signals, appears in channel 114 as seen in Fig. 3b. By further checking all the detector signals for this event, it was concluded that it is a background event, probably arising from scatterings of a beam particle at several locations through the spectrometer. Hence, only an upper limit for the measured cross section could be determined at this beam energy. These results show that a background suppression factor of about 410-17 can be achieved with the upgraded FMA and the present detector system.
The uncertainties in the reported evaporation cross sections arise mainly from corrections for the charged state distribution, the FMA transport efficiency, the detector efficiency, and counting statistics. The total uncertainties for the evaporation cross sections are around 10-17, except for the measurements at the two lowest energies where only upper limits can be given. The cross sections are listed in Table I.
The fusion-fission cross sections for 64Ni + 100Mo have not been measured previously. They were, however, calculated in Ref. rehm with the code CASCADE puhl . Similar calculations with the same parameters were performed for the present experiment. The total fusion cross sections are also listed in Table I, together with the fusion-fission cross sections. Rather large uncertainties were given for the fusion-fission contributions resulting in somewhat larger errors for the total cross sections at the highest beam energies.

The experimental results for the total fusion cross sections, spanning eight orders of magnitude, are presented as a function of laboratory energy in Fig. 4 (solid circles). The incident energies have been corrected for target thickness and for the steep energy dependence; these corrections are small because rather thin targets were used. For the lowest two energies no evaporation residue was observed. The results are shown as upper limits corresponding to one count in each case. The two earlier measurements rehm ; halb are also shown in Fig. 4 as open circles and open squares, respectively. Statistical errors are smaller than the size of the symbols. The three measurements are generally in good agreement within the quoted uncertainties, except for the lowest energy point of Ref. halb .
III Coupled-channels calculations
| (MeV) | (mb) | (mb) | (mb) | |
|---|---|---|---|---|
| 158.8 | 14 | 264 35 | 275 | 539 111 |
| 149.9 | 9 | 210 25 | 80 | 290 42 |
| 141.1 | 4 | 80.0 8.8 | 2 | 82.0 9.8 |
| 136.1 | 5 | 29.2 3.0 | 0 | 29.0 3.0 |
| 131.2 | 4 | 6.80 0.71 | 0 | 6.80 0.71 |
| 129.2 | 4 | 2.87 0.30 | 0 | 2.87 0.30 |
| 127.5 | 12 | 0.92 0.10 | 0 | 0.92 0.10 |
| 126.2 | 6 | 0.35 0.04 | 0 | 0.35 0.04 |
| 125.0 | 4 | 0.109 0.012 | 0 | 0.109 0.012 |
| 123.9 | 4 | 0.0253 0.0029 | 0 | 0.0253 0.0029 |
| 123.3 | 8 | 0.0132 0.0014 | 0 | 0.0132 0.0014 |
| 122.9 | 4 | 7.4 | 0 | 7.4 |
| 121.7 | 2 | 1.10 | 0 | 1.10 |
| 121.2 | 2 | 2.42 | 0 | 2.42 |
| 120.2 | 2 | 2.0 | ||
| 119.5 | 2 | 4.6 |
The coupled-channels calculations of Ref. rehm reproduced the excitation function quite well down to the 0.5 mb level. It was found that with the same coupling parameters, the calculations cannot reproduce the new data at lower beam energies. In fact, in the literature there are not many such calculations that can reproduce successfully experimental data for heavy systems. Since the nucleus 100Mo is rather soft, multi-phonon states and large coupling effects should be included in the calculations and this represents a challenge. In the following, two sets of coupled-channels calculations are presented, including two- and three-phonon states, respectively.
| Nucleus | Ex | B(E) | |||
| (MeV) | (W.u.) | ||||
| 64Ni | 1.346 | 8.6 | 0.165 | 0.185 | |
| 2ph() | 2.869 | - | 0.165 | 0.185 | |
| 3.560 | 12 | 0.193 | 0.200 | ||
| 100Mo | 0.536 | 37 | 0.231 | 0.254 | |
| 2ph() | 1.002 | 68 | 0.222 | 0.244 | |
| 3ph() | 1.671 | 90 | 0.206 | 0.215 | |
| 1.908 | 32 | 0.210 | 0.230 | ||
| 2ph( | 3.816 | - | 0.210 | 0.230 |
| Nucleus | 64Ni | 100Mo | ||
|---|---|---|---|---|
| (MeV) | (W.u.) | (MeV) | (W.u.) | |
| 2.867 | 110 | 0.695 | 92 | |
| 2.277 | 0 | 1.064 | 51 | |
| 2.610 | 37 | 1.136 | 69 | |
| Effective-2ph | 2.87-2.75 | 22-41 | 1.002 | 68 |
| - | 0.177-0.242 | - | 0.222 | |
The nuclear structure input for the calculations is given in Table II. The structure input for 64Ni is the same as used in Ref. jiang2 to analyze the 64Ni + 64Ni fusion-evaporation excitation function. The nuclear quadrupole coupling, , for 64Ni was set higher than the value for Coulomb coupling, , (for reasons discussed in Ref. vide ). For simplicity, it was assumed that the quadrupole mode corresponds to a perfect vibrator. This is not unreasonable, considering the uncertainty of the predicted one- and two-phonon couplings shown in Table III. The structure input for 100Mo is also given in Table II. Here, the nuclear -values were also set higher than the Coulomb -values.
The two-phonon (2ph) calculations include the and one-phonon states in both nuclei, as well as mutual excitations and the two-phonon states listed in Table II. The two-phonon octupole excitation of 100Mo was also included. The two-phonon states were treated as perfect vibrational states. This gives a total number of 14 coupled channels. The three-phonon (3ph) calculations additionally include all mutual excitations of the states considered in the 2ph calculations up to two mutual two-phonon states. Moreover, the estimated three-phonon excitation of the state in 100Mo shown in table II was also included. However, states above 5.5 MeV were not included, so the total number of channels is 31. The ion-ion potential was parametrized as a Woods-Saxon well with a depth of = -82.9 MeV, diffuseness = 0.686 fm, and nuclear radius = 10.19 + fm.

If the value of =0.06 fm was used in the two-phonon calculations, the result is similar to the calculations in Ref. rehm , and it agrees quite well with the data for the excitation function above the 0.5 mb level. This two-phonon calculation is shown in Fig. 5 as the dotted-dashed curve and it is evident that it does not reproduce the data well at low energies. We have also tried the recipe of a larger diffuseness (up to =5 fm) inside the Coulomb barrier, which was described in Ref. jiang1 , but this did not result in any significant improvement of the fit to the data.
A value of = 0.21 fm was needed to reproduce the present data in the cross section region of 0.1 to 100 b. The potential with this value produces a Coulomb barrier of 134 MeV, and a pocket inside the Coulomb barrier at 112.9 MeV, which is about 20 MeV higher than the ground state energy of the compound nucleus at 92.3 MeV. The value of = 0.21 fm was also adopted in the 3ph calculations. The result is shown as the solid curve in Fig. 5, which is seen to provide a better fit to the data in the 0.1 to 100 b cross section range. The dashed curve shows as a reference the results obtained in a one-dimensional calculation, i.e., without any couplings (with = 0.21 fm). It should be emphasized that the difference between the two sets of calculations, using the same = 0.21 fm, is rather modest. Hence, the 2ph calculation with = 0.21 fm is not shown for clarity. These two calculations reproduce the experimental data in the highest energy region and in the 0.1 to 10 b range, but the cross sections in the region around E=130 MeV are overpredicted. These calculations also overpredict the cross sections at the lowest energies, which is the main topic of the present study.
The coupled-channels calculations shown in Fig. 5 exhibit essentially the same energy dependence (slope) as the one-dimensional calculation when the cross sections are small ( 10 b). The coupled-channels calculations are just shifted to lower energies relative to the one-dimensional calculation. In the present case the shift is about 7 MeV (for the same = 0.21 fm). This is a general feature of coupled-channels calculations and it is, therefore, very unlikely that any minor adjustment in the coupled-channels calculations would reproduce the steep falloff that the data exhibit at extreme sub-barrier energies. Thus, it appears that the fusion hindrance behavior, which now has been observed for many systems, is also present in the new data for 64Ni+100Mo. This will be shown more convincingly in the next section, where other representations of the fusion cross section are discussed.
From the experimental data and calculations alike, one can infer a rather broad, about 18 MeV wide, barrier distribution (not shown here). An elaborate coupling scheme is therefore needed in the coupled-channels calculations. At energies above the barrier, one-dimensional calculations result in higher cross sections when compared to coupled-channels calculations. This behavior is caused by the long-range Coulomb-excitation/polarization of the low-lying quadrupole states, as pointed out in Ref. rehm . As expected, the suppression of the coupled-channels fusion cross sections is rather strong in this region for the “soft” 100Mo nucleus.
IV Logarithmic derivatives and -factors

The logarithmic derivative, , originally introduced in Ref. jiang0 , is shown in Fig. 6a for the 64Ni + 100Mo system. The solid circles were obtained directly from two successive data points, whereas the stars were derived from least-squares fits to three neighboring data points. The lower limit of the logarithmic derivative was derived from the upper limit on the cross section at =120.2 MeV and the data point at =121.2 MeV (see Table I). The present data are compared to those of Refs. rehm ; halb , which are represented by open circles and solid triangles in Fig. 6a, respectively. Only two-point derivatives are shown for these data. The three-phonon coupled-channels and the one-dimensional barrier penetration calculations are shown as solid and dashed curves, respectively, while the thick solid, nearly horizontal line corresponds to a constant -factor expression derived in Ref. jiang1 . The present experimental results just reach the constant -factor line, implying that the experimental data have reached a maximum value for the -factor. The energy, , representing the intersection between the experimental logarithmic derivatives and the constant -factor line corresponds to a value of =120.6 MeV. The dashed-dotted line in Fig. 6a is an extrapolation obtained under the assumption that the logarithmic derivative is a straight line near the crossing point. This method was first introduced in Ref. jiang2 in order to obtain the extrapolated values of for the systems 58Ni + 60Ni and 58Ni + 64Ni. The calculated logarithmic derivatives are seen to saturate around =1.5 - 2 MeV-1 (or start to oscillate) below =124 MeV, whereas the corresponding experimental values continue to grow with decreasing energies. This saturation behavior has already been noted in Refs. jiang0 ; jiang1 ; jiang2 .
| System | Ref. | |||||||||
| (MeV) | (MeV) | (MeV) | (mb) | (MeV) | (MeV) | |||||
| 58Ni+58Ni | 4222 | 94.0 | 93.0 | 1.01 | 0.049 | 66.12 | 102.0 | 2+2 | beck1 | |
| 58Ni+60Ni | 4258 | 92 | 93.5 | 0.98 | 0.040 | 62.69 | 101.3 | 2+4 | stef3 | |
| 58Ni+64Ni | 4325 | 89 | 94.5 | 0.94 | 0.077 | 53.04 | 100.0 | 2+4 | beck2 | |
| 64Ni+64Ni | 4435 | 87.7 | 96.1 | 0.91 | 48.78 | 98.1 | 4+4 | jiang2 | ||
| 60Ni+89Y | 6537 | 122.9 | 124.5 | 0.99 | 90.50 | 136.5 | 4+1 | jiang0 | ||
| 58Ni+92Mo | 7014 | 132.9 | 130.5 | 0.17 | 108.0 | 148.6 | 2+2 | rehm | ||
| 64Ni+92Mo | 7225 | 132.1 | 133.1 | 2.6 | 100.6 | 146.0 | 4+2 | rehm | ||
| 58Ni+100Mo | 7125 | 128.9 | 131.8 | 0.72 | 90.39 | 143.3 | 2+10 | rehm | ||
| 64Ni+100Mo | 7346 | 120.6 | 134.5 | 0.90 | 92.29 | 136.5 | 4+10 | present | ||
| 58Ni+74Ge | 5109 | 98.5 | 105.6 | 0.93 | 0.037 | 62.03 | 113.4 | 2+6 | beck2 | |
| 64Ni+74Ge | 5249 | 97.5 | 107.5 | 0.91 | 0.013 | 58.48 | 111.3 | 4+6 | beck2 | |
| 58Ni+90Zr | 6652 | 127.3 | 125.9 | 0.35 | 97.24 | 141.1 | 2+0 | scar | ||
| 58Ni+91Zr | 6666 | 126.4 | 126.1 | 0.25 | 94.18 | 140.8 | 2+1 | scar | ||
| 58Ni+94Zr | 6708 | 122.7 | 126.6 | 0.35 | 86.94 | 139.8 | 2+4 | scar | ||
| 64Ni+92Zr | 6881 | 119.0 | 128.8 | 91.45 | 137.8 | 4+2 | jans ; stef2 ; henn | |||
| 64Ni+96Zr | 6940 | 120.2 | 129.5 | 0.15 | 86.48 | 136.6 | 4+6 | stef2 | ||
| 58Ni+124Sn | 8801 | 149.4 | 151.8 | 0.19 | 112.4 | 170.3 | 2+8 | free | ||
| 64Ni+124Sn | 9096 | 155.0 | 155.1 | 23. | 117.5 | 167.3 | 4+8 | free |
The -factor representation for the 64Ni + 100Mo system is presented in Fig. 6b. As the experimental logarithmic derivatives only just reach the constant -factor curve, the -factor maximum is not fully developed. Additional measurements would be required to clearly delineate the maximum in the -factor. The dashed-dotted curve corresponds to the straight line extrapolation of the logarithmic derivative in Fig. 6a. The two- and three-phonon calculations are shown in Fig. 6b as dashed and solid curves, respectively. It is evident that coupled-channels calculations overpredict the fusion cross section at extreme sub-barrier energies.
V Comparison to other Ni-induced fusion systems
The experimental fusion data involving Ni projectiles and compound nuclei in the A=100 - 200 region, are summarized in Table IV. For four systems, namely the 58Ni+58Ni, 64Ni+64Ni, 60Ni+89Y and the present 64Ni+100Mo reactions, the cross sections have been measured to sufficiently low energies to determine the energy, of the maximum of the -factor representation. Previously, we have obtained the values for the 58Ni+60Ni and 58Ni+64Ni systems jiang1 . The values of are listed in column three of Table IV. Two additional systems, namely 58Ni+74Ge and 64Ni+74Ge from Ref.beck2 , have been measured down to levels close to where the -factor maximum occurs. The logarithmic derivative for these systems is shown in Fig. 7. The location of the -factor maximum was obtained by performing a small extrapolation (solid line) of the logarithmic derivative to where it crosses the constant -factor line (dashed line). The resulting values are listed in Table IV. Because of the uncertainties inherent in these extrapolations, errors of 2 (2 MeV) were assigned to the extrapolated data. Table IV also lists other fusion systems involving Ni beams for which the cross section was not measured down to a level that allows for determination of the -factor maximum. For these systems only the lowest measured energy is listed.
The values of are plotted as a function of the parameter in Fig. 8 and compared to the empirical formula (solid curve), Eq. 1, obtained from a fit to all available fusion data involving stiff nuclei. Obviously, only two systems, 58Ni+58Ni and 60Ni+89Y follow the systematics; all other systems fall below the curve. Previously, it has been pointed out jiang2 that there is a rather compelling correlation between the stiffness of the interacting nuclei and the location of the -factor maximum, , relative to the empirical trend for the Ni+Ni systems. The addition to the systematics of the data points for 64Ni+100Mo and for the two Ni+Ge systems, which all involve soft nuclei, appears to corroborate this observation. Thus, for the 64Ni+100Mo system, the value of predicted from Eq. 1 is =134.5 MeV whereas the measured value of =120.6 MeV is only 90 of this value. The reason for this reduction is presumably that 64Ni + 100Mo should be viewed as an open-shell colliding system so that strong coupling effects broaden the effective barrier distribution and push the energy where the hindrance behavior occurs down to even lower energies.


The deviation of the measured or extrapolated values of from the expected value, seen in Fig. 8, thus appears to depend on the stiffness of the fusing nuclei. A quantitative relation between the stiffness and the deviation from is not yet known. As a first attempt, we associate the stiffness of a nucleus to its proximity to closed proton or neutron shells and define the number of “valence nucleons”, , as the sum of particles and holes outside the nearest closed shells. Here, 64Ni is considered to have four holes in the N=40 neutron shell rather than eight particles outside N=28. The values of are listed in Table IV and, in Fig. 9, the ratio is plotted as a function of this parameter. There is a general trend of decreasing values of with increasing values of . We observe that for the other systems in Table IV, the data for (upper limits) are not in contradiction with Figs. 8 and 9. It should be noted that all of the systems shown in Figs. 8 and 9 and Table IV have rather large negative fusion values. One may also compare the -values to the height of the Coulomb barrier (obtained from the Bass prescription), which is listed in Table IV. The ratio exhibit a stronger dependency on the value of than that obtained for the ratio indicating that the observed effect does not just depend on the change in the Coulomb barrier height with addition of neutrons to the interacting nuclei.

VI Discussion
The above observations are all phenomenological in nature as there is at present no satisfactory understanding of the fusion hindrance at extreme sub-barrier energies. Many authors have tried to explain this new phenomenon lin ; linr ; hagi ; dass ; gira ; proc1 ; proc2 . One suggestion is to use a large diffuseness of the ion-ion potential in the coupled-channels calculations. This recipe is sometimes used to explain high-precision fusion data hagi . It has been argued that the failure to reproduce the steep fall-off is caused by the Hill-Wheeler approximation lin ; linr . In Ref. jiang1 it was shown, however, that these limitations of the analysis are not responsible for the observed sub-barrier fusion hindrance phenomenon. Dasso and Pollarolo tried to reduce the fusion cross sections by using a shallow well inside the barrier dass . Giraud et al. investigated the effect of “friction” gira . More discussions about this phenomenon can be found in Refs. proc1 ; proc2 . All of these suggestions may improve the fit of calculations to the experimental data in some cases, but they do not provide a convincing explanation of the observed suppression in all systems. These studies are presently at the stage of raising questions and discovering weak points in the existing models. The data are most likely still insufficient to lead to the correct explanation. More precision sub-barrier fusion measurements are required to further explore which modifications in the theoretical models are relevant for a correct description of the phenomenon.
VII Summary and conclusion
The phenomenon of sub-barrier fusion hindrance was first observed in systems involving stiff nuclei and a simple expression jiang0 ; jiang1 was derived for the energy at which the hindrance of fusion between such nuclei occurs. Furthermore, a study of Ni+Ni fusion involving different Ni isotopes jiang2 has shown that the onset of the fusion hindrance deviates from these systematics depending on the “stiffness” of the interacting nuclei.
In the present work, we have measured the fusion excitation function for the system 64Ni+100Mo down to a cross section level of 5 nb, i.e. about 12% below the Bass barrier. We observe that the fusion process is hindered at the lowest energies relative to expectations based on coupled-channels calculations. The present study of the 64Ni+100Mo system shows that the fusion hindrance for this system, as well as two other soft systems, deviates strongly from the systematics, and it thus corroborates the earlier observation in Ni+Ni systems. It is furthermore shown that this deviation depends monotonically on a parameter , which is the sum of nucleons (holes) outside of closed shells of the fusing nuclei suggesting that this parameter is a good measure of the “stiffness” of the interacting nuclei.
In conclusion, an interesting nuclear structure dependence of the fusion hindrance has been observed. The origin of this effect is still unknown. It occurs at relatively high excitation energies (for systems in Fig. 8 and 9, they are around 30 - 40 MeV), where the natural width of compound levels is larger than their spacing. A lack of available final states thus appears to be ruled out as an explanation.
Acknowledgments This work was supported by the US Department of Energy, Office of Nuclear Physics, under Contract Nos. W-31-109-ENG-38 and DE-FG-06-90ER-41132.
References
- (1) M. Beckerman, Physics Report, 129, 145 (1985).
- (2) M. Beckerman, Rep. Prog. Phys. 51, 1047 (1988).
- (3) R. Vandenbosch, Annu. Rev. Nuc. Part. Sci. 42, 447 (1992).
- (4) A. B. Balantekin and N. Takigawa, Rev. Mod. Phys. 70, 77 (1998).
- (5) M. Dasgupta, D.J. Hinde, N. Rowley and A.M. Stefanini, Annu. Rev. Nucl. Part. Sci. 48, 401 (1998).
- (6) K. Hagino and N. Takigawa, Phys. Rev. C 55, 276 (1997).
- (7) N. Rowley, G.R. Satchler and P.H. Stelson, Phys. Lett. B254, 25 (1991).
- (8) C.L. Jiang et al., Phys. Rev. Lett. 89, 052701 (2002).
- (9) C.L. Jiang, H.Esbensen, B.B. Back, R.V.F. Janssens and K.E. Rehm, Phys. Rev. C. 69, 014604 (2004).
- (10) C.L. Jiang et al., Phys. Rev. Lett. 93, 012701 (2004).
- (11) M. Beckerman, J. Ball, H. Enge, M. Salomaa, A. Sperduto, S. Gazes, A. DiRienzo and J.D. Molitois, Phys. Rev. C 23, 1581 (1982).
- (12) A.M. Stefanini et al., Phys. Rev. Lett. 74, 864 (1995).
- (13) M. Beckerman et al., Phys. Rev. C 25, 837 (1982).
- (14) D. Ackermann et al., Nucl. Phys. A609, 91 (1996).
- (15) K.E. Rehm, H. Esbensen, J. Gehring, B. Glagola, D. Henderson, W. Kutschera, M. Paul, F. Soramel and A.H. Wuosmaa, Phys. Lett. B317, 31 (1993).
- (16) M.L. Halbert, J.R. Beene, D.C. Hensley, K. Honkanen, T.M. Semkow, V. Abenante, D.G. Sarantites, and Z. Li, Phys. Rev. C. 40, 2558 (1989).
- (17) C.N. Davids and J.D. Larson, Nucl. Instr. and Meth. B40/41, 1224 (1989); C.N. Davids, B.B. Back, K. Bindra, D.J. Henderson, W. Kutschera, T. Lauritsen, Y. Nagame, P. Sugathan, A.V. Ramayya and W.B. Walters, Nucl. Instr. and Meth. B70, 358 (1992).
- (18) C.N. Davids, ANL Phys. Div. Annual Report ANL-03-23, (2003), p. 104.
- (19) D.G. Kovar and D.J. Henderson, ANL Phys. Div. Annual Report ANL-90-18, (1990), p. 108.
- (20) T.O. Pennington, D.J. Henderson, D.Seweryniak, K.E. Rehm, C.L. Jiang, C.N. Davids, C.J. Lister, B.J. Zabransky and B. Blank, ANL Phys. Div. Annual Report ANL-03-23, (2003), p. 105.
- (21) C.L. Jiang et al., to be submitted to Nuclear Instrument and Methods A.
- (22) A. Gavron, Phys. Rev. C 21, 230 (1980).
- (23) C.L. Jiang and C.N. Davids, ANL Phys. Div. Annual Report ANL-95/14, (1995), p. 74.
- (24) F. Pühlhofer, Nucl. Phys. A280, 267 (1977).
- (25) J. Charbonneau, N.V. De Castro Faria, J. L’Ecuyer and D. Vitoux, Bull. Am. Phys. Soc. 16, 625 (1971).
- (26) F. Videbaek, P.R. Christensen, O. Hansen and K. Ulbaek, Nucl. Phys. A256, 301 (1976).
- (27) M. R. Braunstein, J.J. Kraushaar, R.P. Michel, J.H. Mitchell, R.J. Peterson, H.P. Blok, H. de Vries, Phys. Rev. C 37, 1870 (1988).
- (28) B. Singh, At. Data Nucl. Data Tables 81, 1 (1997).
- (29) K. Hagino, N. Rowley and M. Dasgupta, Phys. Rev. C 67, 054603 (2003).
- (30) R. Bass, Nucl. Phys. A231, 45 (1974).
- (31) F. Scarlassara, S. Beghini, F. Soramel, S. Signorini, L. Corradi, G. Montagnoli, D.R. Napoli, A.M. Stefanini and Z.C. Li, Z. Phys. A 338, 171 (1991).
- (32) A.M. Stefanini, L. Corradi, H. Moreno, L. Müller, D.R. Napoli, P. Spolaore and E. Adamides, Phys. Lett. B 252, 43 (1990).
- (33) R.V.F. Janssens, R. Holzmann, W. Henning, T.L. Khoo, K.T. Lesko, G.S.F. Stephans, D.C. Radford and A.M. Van Den Berg, Phys. Lett. B 181, 16 (1991).
- (34) W. Henning et al., private communication (1994).
- (35) W.S. Freeman, H. Ernst, D.F. Geesaman, W. Henning, T.J. Humanic, W. Kühn, G. Rosner, J.P. Schiffer, B. Zeidman and F.W. Prosser, Phys. Rev. Lett 50, 1563 (1991).
- (36) C. J. Lin, Phys. Rev. Lett. 91, 229201 (2003).
- (37) C. L. Jiang et al., Phys. Rev. Lett. 91, 229202 (2003).
- (38) C.H. Dasso and G. Pollarolo, Phys. Rev. C 68, 054604 (2003).
- (39) B.G. Giraud, S. Karataglidis, K.Amos and B.A. Robson, Phys. Rev. C 69, 064613 (2004).
- (40) Procedings of the International Conference Fusion03: From a Tunneling Nuclear Microscope to Nuclear Processes in Matter, Nov. 12-15, 2003, Matsushima, Japan, Prog. Theor. Phys. Suppl. No. 154, 2004. D.J. Hinde, p. 1; H. Esbensen, p. 11; C.L. Jiang, p.61; C.J. Lin, p. 184; G. Pollaroro, p. 201; M. Dasgupta, p. 209; D. Brink, p. 268; A.B. Balantakin, p. 465.
- (41) S.V.S. Sastry et al., Conference Book of International Conference Fusion03: From a Tunneling Nuclear Microscope to Nuclear Processes in Matter, Nov. 12-15, 2003, Matsushima, Japan, p. 143, 2003.