Unified Analysis of Spin Isospin Responses of Nuclei
T. Wakasa
Department of Physics, Kyushu University,
Higashi, Fukuoka 812-8581, Japan
M. Ichimura
Faculty of Computer and Information Sciences, Hosei University,
Koganei, Tokyo 184-8584, Japan
H. Sakai
Department of Physics, The University of Tokyo,
Bunkyo, Tokyo 113-0033, Japan
Abstract
We investigated the Gamow-Teller (GT) strength distribution,
especially the quenching with respect to the GT sum rule,
and the enhancement of the pionic responses
in the quasielasic scattering region,
in the same theoretical framework.
That is the continuum random phase approximation
with the model interaction,
incorporated with distorted wave impulse approximation
and two-step calculations.
From this analysis we searched the Landau-Migdal parameters,
and ,
through the comparison with the experimental data
of the GT strength distribution obtained at 300 MeV
and the spin-longitudinal (pionic) cross sections
of at 350 and 500 MeV.
This comprehensive and sophisticated study gave
a common set of =0.6–0.7 and =0.2–0.4,
for both low and high momentum transfers.
pacs:
21.30.Fe, 21.60.Jz, 25.40.Kv, 24.30.Cz
Recent and experiments at intermediate energies
have presented reliable information
on nuclear spin isospin responses rapaport_alfold .
Following two contrastive subjects are especially interesting.
One is quenching of the total strength
of the Gamow-Teller (GT) transitions npa_396_127c_1983
from its sum rule value npa_334_248_1980 ,
and the other is enhancement of the pionic (isovector spin-longitudinal)
response functions in the quasielastic scattering (QES) region
prl_73_3516_1994 ; prc_59_3177_1999 ; prc_69_054609_2004
as a precursor of the pion condensation np_a379_429_1982 .
A common key concept to understand these contrastive phenomena simultaneously
is the Landau-Migdal (LM) parameters,
, , and ,
which specify the LM interactions , namely
the zero range particle-hole () and Delta-hole () interactions.
In this paper we study the GT strength distributions
and the quenching factor observed at 295 MeV at RCNP,
and the spin-longitudinal cross sections
of at 346 MeV at RCNP and at 494 MeV at LAMPF,
which well represent the pionic response function .
To all these observables, we apply the same theoretical framework,
namely the continuum random phase approximation (RPA)
with the model interaction,
which properly treats the finite geometry. Then we look for
the LM parameters, which reproduce the data as well as possible.
Estimations of from the GT giant resonances (GTGR) have been
carried out by several authors rmp_64_491_1992 .
For instance, Suzuki plb_104_92_1981
used energy weighted sum technique
and Bertsch, Cha, and Toki prc_24_533_1981 used the continuum RPA.
Fitting the peak position of GTGR,
they obtained similar values of 0.6 for 90Zr.
Their analyses used only the LM interaction for the nucleons.
Most of later works with npa_395_189_1983 ; prc_31_372_1985
used the universality ansatz, .
Further the experimental spectra are of the cross sections of ,
but not of the genuine GT strength.
We re-investigate the GTGR spectrum
by use of model interaction
without the universality ansatz.
From the GT quenching factor,
Suzuki and Sakai plb_455_25_1999
estimated by the Fermi gas model only with ,
treating the finite size effect crudely.
They obtained for 90Zr.
Using the first order perturbation on the transition part of
the model interaction,
Arima et al.plb_499_104_2001
obtained .
This increase of 0.1 from the Suzuki-Sakai’s result
comes from the and exchange interaction
due to the nuclear finite size.
The present RPA calculation presents more integrated analysis.
As to the pionic responses in the QES region, it has been
shown prc_63_044609_2001
that a conventionally used eikonal approximation is
not quantitatively reliable
to extract the pionic response function from
due to the nuclear distortion.
Thus we have to calculated
by the distorted wave impulse approximation (DWIA)
incorporated with the continuum RPA response functions,
and to compare the theoretical and experimental results directly.
Further it has also been shown prc_69_054609_2004
that two-step processes contribute as an appreciable background
for the RCNP data. Therefore we extend the DWIA + two-step analysis
to the LAMPF data and search the suitable ’s in an overall point of view.
We write the
transition operators with N and in the unit of as
(1)
with and
,
where is the weak coupling constant
for NN () transition,
and is the nucleon Pauli spin (isospin) matrix,
and is the spin (isospin) transition operator
from N to .
Similarly we write the isovector spin-longitudinal transition operators
with momentum transfer as
(2)
where , and
is the
coupling constant.
Here we neglect the transitions from to
in both and .
We take the quark model relation
=
=
1.70 in this paper.
What we are interested in are how the nuclei respond to these operators.
Since neither the momentum nor
the spin directions are conserved in finite nuclei,
we introduce the spin-isospin transition densities
(3)
with , and calculate the spin-isospin response functions
(4)
by the continuum RPA with the orthogonality condition
in the coordinate representation prc_51_269_1995 .
The ++ model interaction is written as
(5)
where and are the one-pion
and the one-rho-meson exchange interactions, respectively.
The LM interaction is written by the LM parameters
, , as
(6)
We fixed prc_23_1154_1981
since the calculated results depend on it very weakly .
Non-locality of mean fields is taken into account
by a local effective mass approximation in the form of
(7)
with the Woods-Saxon radial form .
First we discuss the strength distributions of the transitions,
which are expressed by the response functions
for the ground-state
(8)
where and denote
the -th nuclear state and its energy.
They are experimentally extracted
from the cross sections
deduced by the multipole decomposition analysis (MDA) as
prc_55_2909_1997
(9)
with the GT unit cross section and
the dependence factor .
Converting the calculated response functions
into
those in the momentum representation ,
the GT response functions of Eq. (8)
are given by
(10)
where
=
.
The strength distribution
from to was obtained
by MDA of the data
prc_55_2909_1997 ; jpsj_73_1611_2004 , which
cover not only the GTGR region but also the excitation energy up to 50 MeV.
Figure 1 shows the dependence of the GTGR peak position.
The curves correspond to the results of =0.0–0.9 in 0.3 steps,
with and .
The result with =0.6 reproduces the peak position well.
This value is very close to
the previous results plb_104_92_1981 ; prc_24_533_1981 .
The excess of the theoretical value around the peaks should be redistributed
by the configuration mixing of states and more prc_26_1323_1982 .
This redistribution is seen as significant experimental strength beyond GTGR.
This is the quenching of one kind, which should be distinguished from
the other quenching due to mixing discussed below.
Figure 2 examines the and dependences
of the GTGR spectrum.
In the left panel the curves denote the results of
=0.0–0.9 in 0.3 steps.
The peak position hardly depends on
but its height strongly does.
Since the governs the coupling between and ,
it controls how much the strength in the GTGR region moves up
to the region.
The dependence is shown in the right panel,
where the curves represent the results of =1.0–0.6 in 0.2 steps.
The affects the GTGR so weakly that
it is hard to get information about .
From these analysis, we obtained
with care for the small and dependences.
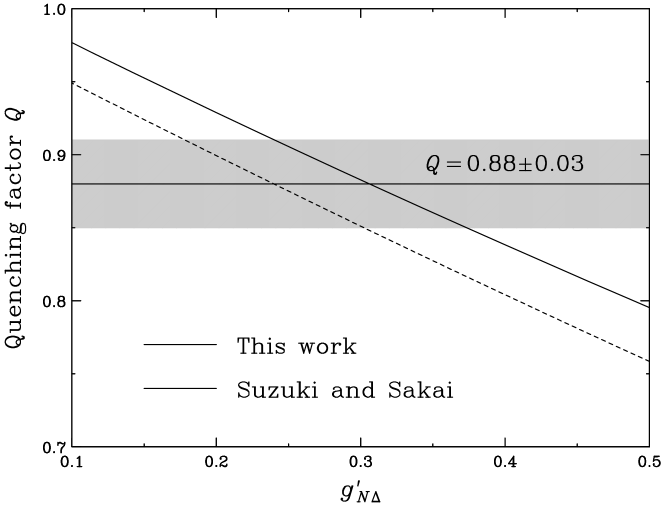
Next we discuss the GT quenching factor , which is defined as
(11)
with
(12)
Very recently Yako et al.nucl_ex_0411011 applied MDA to both
the and data,
and obtained
where they used the end energy MeV
(50 MeV of excitation) and chose
the relevant in account of the Coulomb energy shift.
Since is almost exclusively determined by
in the calculation, we display the dependence
in Fig. 3 with fixed . The solid line shows
the results of the continuum RPA and the dashed line does those of
Suzuki-Sakai’s formulas plb_455_25_1999 .
The experimental and its uncertainty are shown by
the horizontal solid line and the horizontal band, respectively.
From this comparison we obtained .
The difference between the present calculation and the Suzuki-Sakai’s line
is well understood by the mechanism of Arima et al.plb_499_104_2001 .
Third we investigate the enhancement of the pionic modes in the QES region.
The relevant spin-longitudinal cross sections
were measured for and at =346 MeV
prc_59_3177_1999 ; prc_69_054609_2004 and 494 MeV
prl_73_3516_1994 taken at RCNP and LAMPF, respectively.
We performed DWIA calculations by use of
the response functions ,
and also estimated the two-step contributions
in the same manner as Ref. prc_69_054609_2004 .
Since the obtained characteristics are very similar
both for and ,
we compare in Fig. 4 the calculations with
the experimental only for
taken at RCNP and LAMPF in the left and right panels, respectively.
The top panels show the dependence for =0.0–0.9
in 0.3 steps with the fixed and .
The calculations are sensitive to near and below the QES peak.
The experimental data are reasonably reproduced with
=0.7, whose uncertainty could be about 0.1.
This result is consistent with the value of
evaluated from the GTGR spectrum.
The middle panels denote the dependence for
=0.0–0.9 in 0.3 steps with the fixed
and .
The dependence is evidently seen around the QES peak.
The most probable choices of are about
0.4 and 0.2 for the RCNP and LAMPF data, respectively.
From these results, we could estimate ,
which is consistent with that from the quenching factor .
The bottom panels display the dependence for
=1.0–0.6 in 0.2 steps with the fixed and
.
The theoretical estimations pl_126b_421_1983 ; np_a481_381_1988 of
is consistent with that required by the data.
In summary, we reported the theoretical analyses
of the two contrastive phenomena, the quenching of the GT transition and
the enhancement of the pionic response at the QES region.
The GT strength distributions and the latest data of the quenching factor
are calculated by means of the continuum RPA
with the interactions including degree of freedom.
In the same framework of the structure calculation
incorporated with the DWIA and two-step calculations, we also calculated
the spin-longitudinal cross sections at different incident energies.
By this elaborated and comprehensive calculations
in a unified way for widespread phenomena,
we found a common set of the LM parameters,
=0.6–0.7 and =0.2–0.4,
which explain the quenching and the enhancement simultaneously.
We thank all the members of the RCNP-E57, E59, E131, and E149
collaborations, especially for K. Yako.
This work was supported in part by the
Grands-in-Aid for Scientific Research Nos.
12640294, 12740151, and 14702005 of the
Ministry of Education, Culture, Sports,
Science, and Technology of Japan.
References
(1)
For reviews, see,
J. Rapaport and E. Sugarbaker,
Annu. Rev. Nucl. Part. Sci. 44, 109 (1994);
W. P. Alford and B. M. Spicer,
Adv. Nucl. Phys. 24, 1 (1994).
(2)
C. Gaarde,
Nucl. Phys. A396, 127c (1983).
(3)
C. Gaarde, J. S. Larsen, M. N. Harakeh, S. Y. van der Verf,
M. Igarashi, and A. Müller-Arnke,
Nucl. Phys. A334, 248 (1980).
(4)
T. N. Taddeucci et al.,
Phys. Rev. Lett. 73, 3516 (1994).
(5)
T. Wakasa et al.,
Phys. Rev. C 59, 3177 (1999).
(6)
T. Wakasa et al.,
Phys. Rev. C 69, 054609 (2004).
(7)
W. M. Alberico, M. Ericson, and A. Molinari,
Nucl. Phys. A379, 429 (1982).
(8)
For a review, see,
F. Osterfeld,
Rev. Mod. Phys. 64, 491 (1992).
(9)
T. Suzuki,
Phys. Lett. 104B, 92 (1981).
(10)
G. Bertsch, D. Cha, and H. Toki,
Phys. Rev. C 24, 533 (1981).
(11)
T. Izumoto,
Nucl. Phys. A395, 189 (1983).
(12)
F. Osterfeld and D. Cha and J. Speth,
Phys. Rev. C 31, 372 (1985).
(13)
T. Suzuki and H. Sakai,
Phys. Lett. B 455, 25 (1999).
(14)
A. Arima, W. Bentz, T. Suzuki, and T. Suzuki,
Phys. Lett. B 499, 104 (2001).
(15)
K. Kawahigashi, K. Nishida, A. Itabashi, and M. Ichimura,
Phys. Rev. C 63, 044609 (2001).
(16)
K. Nishida and M. Ichimura,
Phys. Rev. C 51, 269 (1995).
(17)
W. H. Dickhoff, A. Faessler, J. Meyer-ter-Vehn, and
H. Müther,
Phys. Rev. C 23, 1154 (1981).
(18)
T. Wakasa et al.,
Phys. Rev. C 55, 2909 (1997).
(19)
T. Wakasa et al.,
J. Phys. Soc. Jpn. 73, 1611 (2004).
(20)
G. F. Bertsch and I. Hamamoto,
Phys. Rev. C 26, 1323 (1982).
(21)
K. Yako et al.,
nucl-ex/0411011.
(22)
Nguyen van Giai and Pham van Thieu,
Phys. Lett. 126B, 421 (1983).
(23)
C. Mahaux and R. Sartor,
Nucl. Phys. A481, 381 (1988).
Figure 1: The dependence of
strength distributions from
to , where
and are set to 0.3 and 0.7, respectively.
The filled circles are the experimental data taken from
Ref. prc_55_2909_1997 .Figure 2:
The (left panel) and (right panel)
dependences of the RPA calculations.
In the left panel
and are set to 0.6 and 0.7, respectively.
In the right panel
and are set to 0.6 and 0.3, respectively.Figure 3:
The GT quenching factor as a function of .
The experimental result of nucl_ex_0411011
is shown by the horizontal solid line and band.
The dashed curve is the theoretical prediction by
Suzuki and Sakai plb_455_25_1999 .Figure 4:
The spin-longitudinal polarized cross section
for the reaction at
=346 MeV prc_59_3177_1999 ; prc_69_054609_2004 (left panels)
and =494 MeV prl_73_3516_1994 (right panels).
The top, middle, and bottom panels show the
, , and
dependences of the calculations.
The notations of the curves are the same as those
in Figs. 1 and 2
except for =0.7 in the middle and bottom panels.