Review of Results from the NA49 Collaboration
Abstract
New results of the NA49 collaboration on strange particle production are presented. Rapidity and transverse mass spectra as well as total multiplicities are discussed. The study of their evolution from AGS over SPS to the highest RHIC energy reveals a couple of interesting features. These include a sudden change in the energy dependence of the -spectra and of the yields of strange hadrons around 30 GeV. Both are found to be difficult to be reproduced in a hadronic scenario, but might be an indication for a phase transition to a quark gluon plasma.
1 Introduction
In the recent years the NA49 experiment has collected data on Pb+Pb collisions at beam energies between 20 to 158 GeVwith the objective to cover the critical region of energy densities where the expected phase transition to a deconfined phase might occur in the early stage of the reactions. In this contribution the energy dependence of - and rapidity-distributions, as well as the production rates of strange particles are reviewed. NA49 is a fixed target experiment at the CERN SPS and consists of a large acceptance magnetic spectrometer equipped with four TPCs as tracking devices and a forward calorimeter for centrality selection. Details on the experimental setup can be found in [1].
2 Rapidity spectra
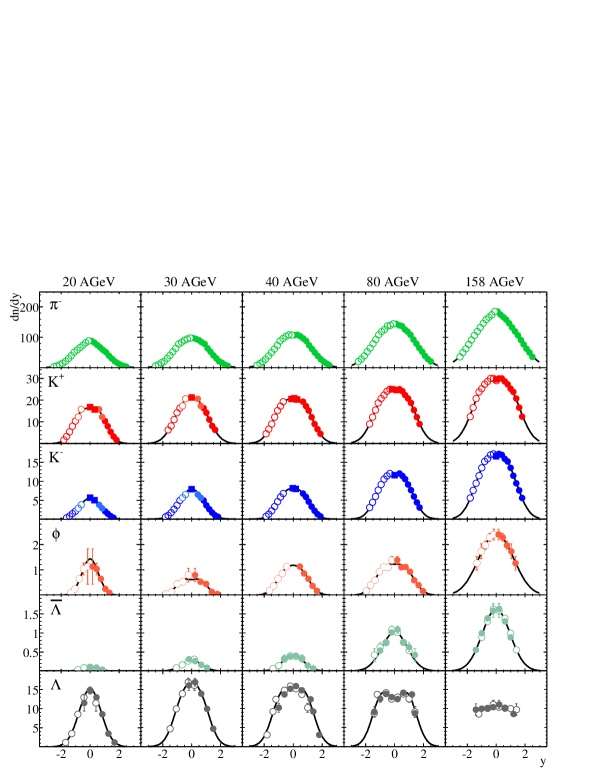
The large acceptance of the NA49 spectrometer allows to measure particle spectra over a wide range of the longitudinal phase space. Fig. 1 shows a compilation of the rapidity distributions of , , , , , and . The shapes of these distributions are generally well described by a Gaussian. Only the -distributions exhibit a strong variation of the shape. While at 30 GeV they are still Gaussian-shaped, a clear plateau develops with increasing beam energy.
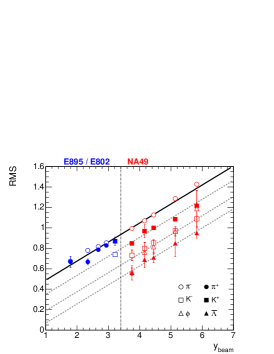
An increase of the RMS-widths of the rapidity spectra, calculated from the fits shown in Fig. 1, with beam energy can be observed which for the pions exhibits to a good approximation a linear dependence on the beam rapidity in the center-of-mass system over the whole energy range covered by the AGS and SPS (see Fig. 2). Between 20 GeV and 158 GeV this is also true for the other particle types having a Gaussian-like distribution, with a clear hierarchy in the widths: . However, this seems to break down at lower energies, where the widths of the kaons apparently approach the ones of the pions.
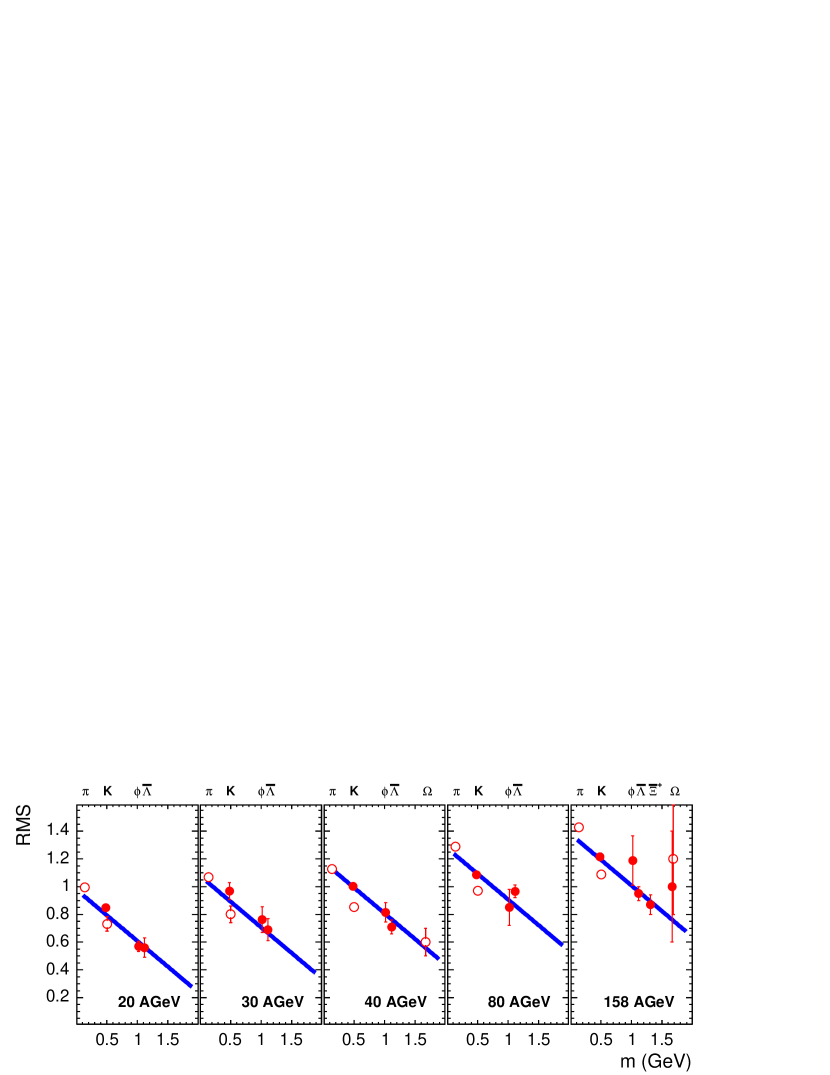
The dependence of the RMS-widths on the particle mass at SPS energies is shown in Fig. 3. An approximately linear mass dependence is observed, which appears to have the same slope for all SPS-energies. This mass dependence can be interpreted as a result of the thermal spectrum of hadrons superimposed on the longitudinal collective expansion.
3 Transverse mass spectra
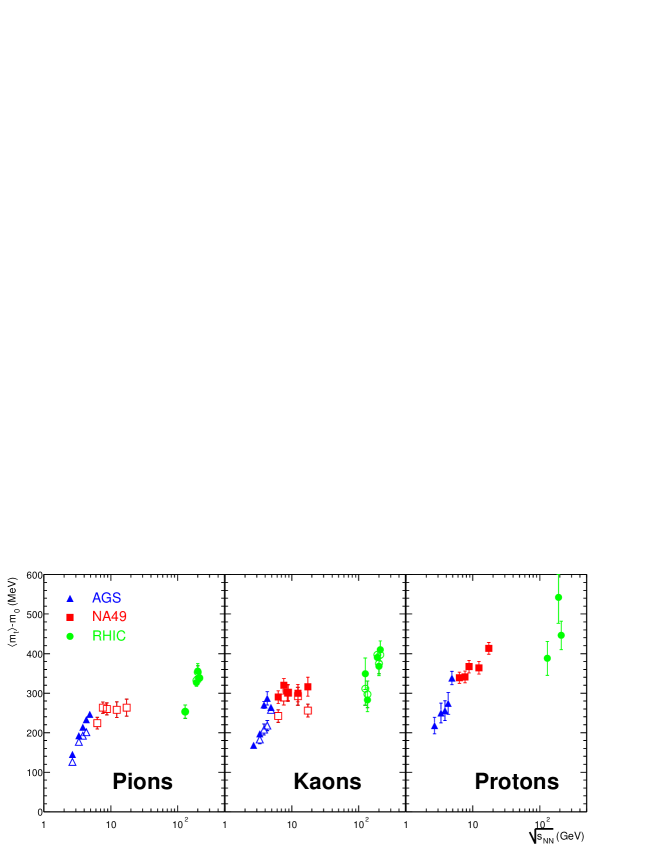
The increase with energy of the inverse slope parameter of the kaon -spectra, as derived from an exponential fit, exhibits a sharp change to a plateau around 30 GeV [4]. Since the kaon -spectra – in contrast to the ones of the lighter pions or the heavier protons – have to a good approximation an exponential shape, the inverse slope parameter provides in this case a good characterization of the spectra. For other particle species, however, the local slope of the spectra depends on . Instead, the first moment of the -spectra can be used to study their energy dependence. The dependence of on the center of mass energy is summarized in Fig. 4. The change of the energy dependence around around a beam energy of 20 – 30 GeV. is clearly visible for pions and kaons. While rises steeply in the AGS energy range, the rise is much weaker from the low SPS energies on. To a lesser extend this change is also seen for protons.
4 Particle yields
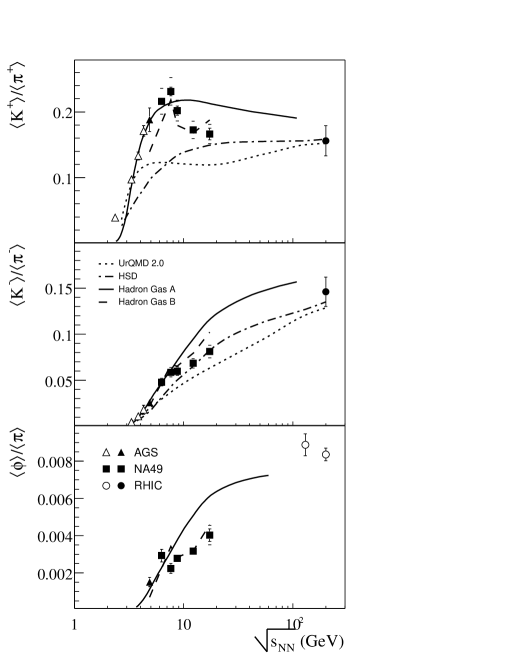
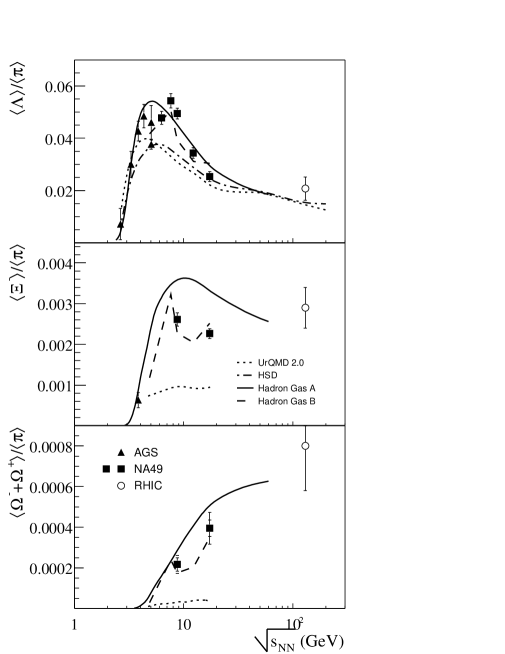
By integrating a measured rapidity distribution, as shown in Fig. 1, the total multiplicity of a given particle type can be determined. In Fig. 5 the energy dependence of the total multiplicities for a variety of strange hadrons, normalized to the total pion yield, is summarized and compared to model predictions. A detailed discussion can be found in [10]. Generally, it can be stated that string hadronic models UrQMD and HSD [11, 12] do not provide a good description of the data points. Especially the and production is substantially underestimated and the maximum in the /ratio is not reproduced. The statistical hadron gas models [13, 14], on the other hand, provide a better overall description of the measurements. However, the introduction of an energy dependent strangeness under-saturation factor is needed [14], in order to capture the structures in the energy dependence of most particle species (, , , ).
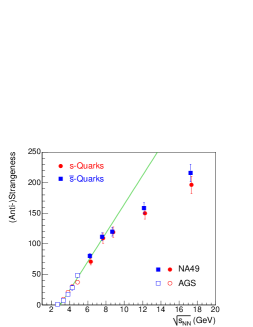
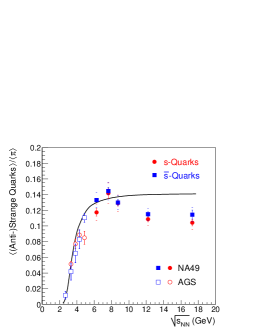
From the measured total yields of the strange particles the energy dependence of the number of produced strange quarks and anti-quarks is constructed (see left panel of Fig. 6). The strange quark carriers which are taken into account are , , (including ), , , and . For the strange anti-quark these are , , (including ), , , and 111The contribution is calculated using isospin symmetry (, ). If no measurement is available, the values for the and yields were taken from statistical model fits [14]. The contribution is estimated based on the empirical factor [15]. Note that the strange quarks from the and are not included. The - and -yields derived from the NA49 measurements agree at all energies, illustrating the consistency of the analysis. A departure from the energy dependence of strangeness production as observed at lower energies (indicated by the straight line) is observed around 30 GeV. If divided by the total number of pions a clear maximum of the relative strangeness production at the same energy can be seen (right panel of Fig. 6). While the statistical hadron gas model with full strangeness equilibration [16] matches the data below this maximum quite well, it over-predicts the measurements at higher energies.
5 Conclusions
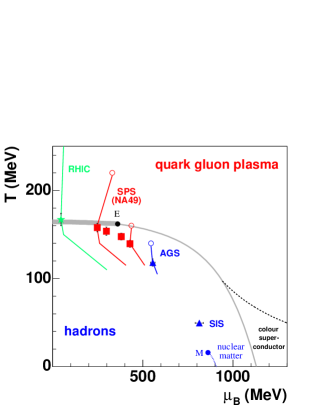
The results of the NA49 energy scan program have revealed a variety of interesting features. Among these are a clear change in the energy dependence of the -spectra and a maximum in the strangeness to pion ratio around 30 GeV. Both are difficult to explain in a hadronic scenario, but can be understood as a reflection of a phase transition [17, 18]. One of the most remarkable features of the phase diagram, shown in Fig. 7, is the fact that the line of the first order phase transition ends in a second order critical point (for a review of the current theoretical situation see [19]). Its position is subject to large theoretical uncertainties, but recent lattice calculations [20, 21] with physical quark masses indicate that it might be around MeV. If this estimate holds, it might be possible to access the critical endpoint with heavy ion reactions at SPS energies. Since the above described results on the energy dependence of hadronic observables might indicate that the phase transition is already reached at beam energies of 30 GeV, where the chemical freeze-out happens at MeV. This would imply that at this energy the first order transition line is crossed (see vertical lines in Fig. 7), while at the top SPS energy the evolution passes through the rapid crossover region. Therefore, a careful scan of this region of beam energy, accompanied by an additional variation of the system size, might allow to experimentally identify the position of the endpoint. An indication for the endpoint would possibly be a strong increase of fluctuations in e.g. transverse momentum, particle ratios or multiplicities. So far, only limited attempts of systematically studying these effects in the interesting energy range have been made. Significant non-statistical fluctuations of the kaon to pion ratio at low SPS energies are reported in [22]. Also, large multiplicity and fluctutions in collisions of small systems at 158 GeVhave been observed [4]. However, these effects are still far from having a clear connection to the critical point. Future measurements that would scan the interesting energy range and the system size more closely, might have a chance of seeing stronger evidence for its existence.
Acknowledgments
This work was supported by the US Department of Energy
Grant DE-FG03-
97ER41020/A000,
the Bundesministerium fur Bildung und Forschung, Germany,
the Polish State Committee for Scientific Research
(2 P03B 130 23, SPB/CERN/P-03/Dz 446/2002-2004, 2 P03B 04123),
the Hungarian Scientific Research Foundation (T032648, T032293, T043514),
the Hungarian National Science Foundation, OTKA, (F034707),
the Polish-German Foundation, and the Korea Research Foundation
Grant (KRF-2003-070-C00015).
Notes
-
a
The NA49 collaboration:
C. Alt9, T. Anticic21, B. Baatar8,D. Barna4, J. Bartke6, L. Betev9,10, H. Białkowska19, A. Billmeier9, C. Blume9, B. Boimska19, M. Botje1, J. Bracinik3, R. Bramm9, R. Brun10, P. Bunčić9,10, V. Cerny3, P. Christakoglou2, O. Chvala15, J.G. Cramer17, P. Csató4, N. Darmenov18, A. Dimitrov18, P. Dinkelaker9, V. Eckardt14, G. Farantatos2, D. Flierl9, Z. Fodor4, P. Foka7, P. Freund14, V. Friese7, J. Gál4, M. Gaździcki9, G. Georgopoulos2, E. Gładysz6, K. Grebieszkow20, S. Hegyi4, C. Höhne13, K. Kadija21, A. Karev14, M. Kliemant9, S. Kniege9, V.I. Kolesnikov8, T. Kollegger9, E. Kornas6, R. Korus12, M. Kowalski6, I. Kraus7, M. Kreps3, M. van Leeuwen1, P. Lévai4, L. Litov18, B. Lungwitz9, M. Makariev18, A.I. Malakhov8, C. Markert7, M. Mateev18, B.W. Mayes11, G.L. Melkumov8, C. Meurer9, A. Mischke7, M. Mitrovski9, J. Molnár4, S. Mrówczyński12, G. Pálla4, A.D. Panagiotou2, D. Panayotov18, A. Petridis2, M. Pikna3, L. Pinsky11, F. Pühlhofer13, J.G. Reid17, R. Renfordt9, A. Richard9, C. Roland5, G. Roland5, M. Rybczyński12, A. Rybicki6,10, A. Sandoval7, H. Sann7, N. Schmitz14, P. Seyboth14, F. Siklér4, B. Sitar3, E. Skrzypczak20, G. Stefanek12, R. Stock9, H. Ströbele9, T. Susa21, I. Szentpétery4, J. Sziklai4, T.A. Trainor17, V. Trubnikov20, D. Varga4, M. Vassiliou2, G.I. Veres4,5, G. Vesztergombi4, D. Vranić7, A. Wetzler9, Z. Włodarczyk12, I.K. Yoo16, J. Zaranek9, J. Zimányi4
1NIKHEF, Amsterdam, Netherlands. 2Department of Physics, University of Athens, Athens, Greece. 3Comenius University, Bratislava, Slovakia. 4KFKI Research Institute for Particle and Nuclear Physics, Budapest, Hungary. 5MIT, Cambridge, USA. 6Institute of Nuclear Physics, Cracow, Poland. 7Gesellschaft für Schwerionenforschung (GSI), Darmstadt, Germany. 8Joint Institute for Nuclear Research, Dubna, Russia. 9Fachbereich Physik der Universität, Frankfurt, Germany. 10CERN, Geneva, Switzerland. 11University of Houston, Houston, TX, USA. 12Institute of Physics Świ etokrzyska Academy, Kielce, Poland. 13Fachbereich Physik der Universität, Marburg, Germany. 14Max-Planck-Institut für Physik, Munich, Germany. 15Institute of Particle and Nuclear Physics, Charles University, Prague, Czech Republic. 16Department of Physics, Pusan National University, Pusan, Republic of Korea. 17Nuclear Physics Laboratory, University of Washington, Seattle, WA, USA. 18Atomic Physics Department, Sofia University St. Kliment Ohridski, Sofia, Bulgaria. 19Institute for Nuclear Studies, Warsaw, Poland. 20Institute for Experimental Physics, University of Warsaw, Warsaw, Poland. 21Rudjer Boskovic Institute, Zagreb, Croatia.
References
References
- [1] S.V. Afanasiev et al. (NA49 collaboration), Nucl. Instrum. Meth. A 430 (1999), 210.
- [2] J.L. Klay et al. (E895 Collaboration), Phys. Rev. C 68 (2003), 054905.
- [3] L. Ahle et al. (E802 collaboration), Phys. Rev C 57 (1998), 466.
- [4] M. Gaździcki (for the NA49 collaboration), J. Phys. G 30 (2004), S701.
- [5] E. Schnedermann and U. Heinz, Phys. Rev. C 50, 1675 (1994).
- [6] C. Alt et al. (NA49 collaboration), nucl-ex/0409004.
- [7] M. van Leeuwen et al. (for the NA49 Collaboration), Nucl. Phys. A 715, 161c (2003).
- [8] M.I. Gorenstein, K.A Bugaev, and M. Gaździcki, Phys. Rev. Lett. 88, 132301 (2002).
- [9] U. Heinz, these proceedings.
- [10] V. Friese (for the NA49 Collaboration), these proceedings.
- [11] M. Bleicher et al., J. Phys. G 25 (1999), 1859.
- [12] E.L. Bratkovskaya et al., Phys. Rev. C 69 (2004), 054907.
- [13] P. Braun-Munziger, J. Cleymans, H. Oeschler, and K. Redlich, Nucl. Phys. A 697 (2002), 902.
- [14] F. Becattini, M. Gaździcki, A. Keränen, J. Manninen, and R. Stock, Phys. Rev. C 69 (2004), 024905.
- [15] A.K. Wróblewski, Acta Phys. Polon. B 16 (1985), 379.
- [16] K. Redlich, these proceedings and private communication.
- [17] M. Gaździcki and M.I. Gorenstein, Acta Phys. Polon. B 30 (1999), 2705.
- [18] M. Gaździcki, M.I. Gorenstein, F. Grassi, Y. Hama, T. Kodama, and O. Socolowski Jr., Braz. J. Phys. 34 (2004), 322.
- [19] M.A. Stephanov, Prog. Theor. Phys. Suppl. 153 (2004), 139.
- [20] Z. Fodor and S.D. Katz, JHEP 0404 (2004), 050.
- [21] S. Ejiri, C.R. Allton, S.J. Hands, O. Kaczmarek, F. Karsch, E. Laermann, and C. Schmidt, Prog. Theor. Phys. Suppl. 153 (2004), 118.
- [22] C. Roland (for the NA49 collaboration), these proceedings and J. Phys. G 30 (2004), S1381.