Precision measurement of the half-life and the decay branches of 62Ga
Abstract
In an experiment performed at the Accelerator Laboratory of the University of Jyväskylä, the -decay half-life of 62Ga has been studied with high precision using the IGISOL technique. A half-life of T1/2 = 116.09(17) ms was measured. Using - coincidences, the intensity of the 954 keV transition and an upper limit of the -decay feeding of the 0 state have been extracted. The present experimental results are compared to previous measurements and their impact on our understanding of the weak interaction is discussed.
1 Centre d’Études Nucléaires de Bordeaux-Gradignan, Le Haut-Vigneau,
F-33175 Gradignan Cedex, France
2 Oliver Lodge Laboratory, University of Liverpool, Liverpool L69 7ZE, UK
3 Kernfysisch Versneller Instituut, Zernikelaan 25, NL 9747 AA Groningen,
Netherlands
4 Department of Physics, University of Jyväskylä,
P.O. Box 35, FIN-40351 Jyväskylä, Finland
PACS numbers: 23.40-s, 21.10 Tg, 27.50.+e
1 Introduction
Studies of superallowed 0+ 0+ pure Fermi transitions and the precise determination of their ft value are important as tests for the weak interaction theory. The corrected Ft-value of these transitions serves as a stringent test for the Conserved Vector Current (CVC) hypothesis, for the determination of the vector coupling constant Gν of nuclear -decay and for the validity of the three-generation Standard Model through the determination of the Vud element of the Cabbibo-Kobayashi-Maskawa (CKM) quark mixing matrix. The following relation links the coupling constant Gν to the corrected Ft-value [1]:
| (1) |
Here, f is the -decay phase space factor, t is the partial half-life, k is a constant ( k/(c)6 = (8120.271 0.012)10-10 GeV-4s ) [1], , and are radiative corrections and accounts for the deviation of the parent and daughter states from perfect isospin symmetry. Presently, nine transitions have been measured to a precision equivalent or better than 10-3 : 10C, 14O, 26Alm, 34Cl, 38Km, 42Sc, 46V, 50Mn and 54Co [1, 2]. The data concerning these transitions confirm the CVC hypothesis at the 310-4 precision level but until very recently the unitarity of the first row of the CKM matrix was not confirmed at more than 2.2 standard deviations [2, 3]. New measurements seem to indicate that the value of the up and strange mixing matrix element (Vus) was too low [4]. The new value of Vus could indicate that unitarity may be completely restored (V=0.9999(16) instead of 0.9968(14) before). However, more measurements are certainly needed to confirm this finding.
Deviation from unitarity would have important consequences for the description of the weak interaction through the Standard Model. However, before claiming new physics beyond the standard model, a very careful determination of the corrected Ft-value is needed, where especially the isospin symmetry breaking factor is an important input. In fact, different model calculations predict that this correction could strongly increase for heavier N=Z, odd-odd nuclei. Therefore measurements for these heavier nuclei are needed to test the evolution of the correction and thus to check nuclear models used for the calculations.
The aim of this work is a precise determination of the half-life of 62Ga as well as of its decay branches which are part of the inputs necessary to calculate the corrected Ft value for 62Ga. This experiment constitutes part of the efforts [5] at IGISOL in Jyväskylä to measure the half-life and the -decay branching ratios as well as, using the new IGISOL ion trap, the masses of 62Zn and 62Ga in order to extract the Q value of the reaction.
The half-life has been measured several times [6, 7, 8, 9, 10] in the past, however, except for the very recent experiment performed at GSI [10], the precision on the result was too low to be included in the CVC test and the determination of the CKM matrix unitarity. The results presented in this paper achieve the necessary precision concerning the half-life.
2 Experimental setup
The 62Ga activity was produced via the 64Zn(p,3n) fusion-evaporation reaction. The decay of 62Ga was studied after mass separation using the IGISOL technique [11, 12] which is independent of the chemical and physical properties of the elements and well suited for short-lived activities. The 3 mg/cm2 64Zn target used as the entrance window of the light-ion ion guide was bombarded with a 48 MeV proton beam (20 A) from the k = 130 Jyväskylä cyclotron.
The 40 keV mass-separated A=62 beam was impinging on a 1/2 inch wide movable tape at the end of the central IGISOL beam line. The tape was located at the center of a 4 cylindrical plastic scintillator (2 mm thick, 12 mm diameter entrance hole) which was used for detection. The scintillation light was collected by two 2-inch photomultiplier tubes in coincidence through a special light guide. The coincidence requirement allowed us to remove most of the photomultiplier noise. The -particle detection efficiency was 90 %. Three co-axial germanium detectors (40% relative efficiency) in close geometry were used in order to provide - and -- coincidence data. They were mounted at a typical distance of 40 mm from the source point and had a total photopeak efficiency of 3.4 % at 1 MeV.
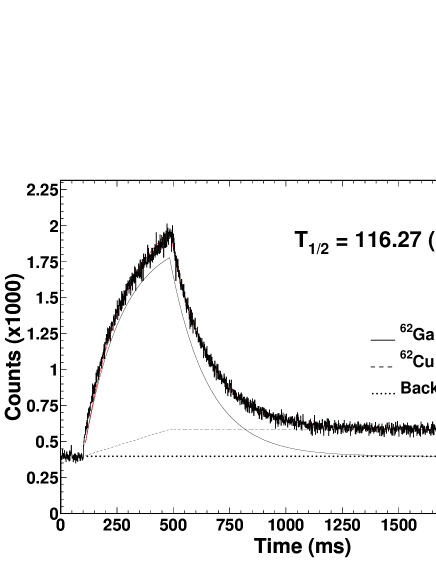
To provide grow-in and decay sequences of the activities, the IGISOL beam was pulsed (TON = 400 ms, TOFF = 1600 ms) and the implantation tape was moved at the end of the beam-off period. We added a 100 ms beam off sequence just before the beam-on period as shown in figure 1. This yielded a well-defined background and allowed for a clean separation of the different contributions (62Ga, 62Cu, constant background) in the decay spectrum.

In order to minimize systematic effects linked to the data acquistion system, we used three independent acquisition systems (DAQ) which worked with different parameters (fixed dead time, type of records and spectra etc.), each of them running in different data record modes: DAQ 1 in an event-by-event mode, DAQ 2 in a cycle-by-cycle mode, and DAQ 3 in a run-by-run mode. Energy signals for the different detectors and a time stamp were acquired and stored event-by-event on tape using the Jyväskylä VENLA data acquisition system [13] (DAQ 1). The fixed dead time was set to 30 s for this data acquisition and the time binning was 1 ms/channel. This dead time was much longer than any other dead time from electronics modules or from the data acquisition itself. For the other two acquisition systems, a coincidence between the signals of the two photomultipliers was required by a hardware condition. In the course of the experiment, two different fixed dead times of 2 s and 5 s were tested. For the main part of the data taking, we used a fixed dead time of 5 s. Again, these fixed dead times were chosen to be longer than any possible event treatment by the electronics or data acquisition systems. The data analysis showed no observable difference between the different data sets. DAQ 2 allowed to store data cycle by cycle with 1 ms/channel. The data recorded for a given cycle were stored on disk while the tape was repositioned. DAQ 3 only acquired total grow-in/decay time spectra over a whole run (between about 200 and 5000 cycles) with a binning of 10 ms/channel. Table 1 summarizes the different characteristics of each DAQ.
| DAQ | Fixed | Time | Running | Recorded |
|---|---|---|---|---|
| dead time | binning | mode | data | |
| N∘1 | 30 s | 1 ms/ch | listmode | time distribution |
| energy spectra | ||||
| energy spectra | ||||
| counting rate | ||||
| N∘2 | 5 s | 1 ms/ch | cycle | time distribution |
| N∘3 | 5 s | 10 ms/ch | run | time distribution |
3 Half-life measurements
The first paragraph of this section will be devoted to the way we did the analysis for each acquisition system. In the second part, we will investigate the possible systematic error sources as well as the influence of the different contaminants and finally we will present the half-life results.
3.1 Analysis with three acquisition systems
As mentioned above, DAQ 1 stored the data in an event-by-event mode. As in addition to the time distribution also the energy signals from the photomultipliers were written on tape, software conditions allowed to remove the noise contribution to the events stored. Different cuts were applied; however, no influence on the half-life could be observed.
As the data were written in listmode, the beam-on/beam-off cycles could be reconstructed offline and time spectra were obtained for each cycle. Therefore, the data from DAQ 1 and DAQ 2 could be analysed on a cycle-by-cycle basis which will be described shortly in the following.
Before accepting a cycle for further analysis, different checks were performed: i) the counting rate for the cycle had to be higher than a user defined limit (we tested different limits in order to make sure that the counting rate limit does not alter the half-life. We finally used 20 counts per cycle as the limit). ii) A fit of the time distribution of each cycle was performed with a function taking into account the different contributions to the time spectrum. This fit had to yield a reduced value of better than 5 (other values were tested as well, but no influence could be found on the half-life).
Cycles which passed these two selection criteria were then corrected channel-by-channel for the dead-time. For this purpose, each channel content was divided by a correction factor of where is the fixed dead-time and is the counting rate per second in each channel. After this correction, the cycles were summed up to yield the time spectrum for a given run.
In order to make sure that the data analysis does not introduce any bias to the half-life, a set of simulation data was generated for each accepted cycle using the same counting rate for the different contributions (62Ga, 62Cu, constant background), as determined during the cycle fitting mentioned above. For the half-life, fixed values were used for 62Ga (116.2 ms) and for 62Cu (584.4 s). We should mention that due to its very long half-life (9.186 h) compared to both 62Ga and 62Cu, we always considered the 62Zn contribution as a constant background. These simulated data were subject to the same dead-time as the fixed dead-time used experimentally (30 s and 5 s for DAQ 1 and DAQ 2, respectively). This procedure created a simulated data set equivalent to the experimental data, except that the input half-life was known. The aim was to obtain the input half-life after treatment of the simulated data with the same programs as the experimental data.
More details about the selection criteria, the fitting procedure and the generation of the simulated data sets can be found in reference [10].
The data acquisition DAQ 3 stored all the data for a given run. Therefore, no correction for the fixed dead-time was possible. However, as could be shown with the data from DAQ 2, the dead-time correction, for a fixed dead-time as short as 5s and the counting rate of the present experiment (less than 1000/s), had only a minor influence (0.08ms) on the half-life determined. Assuming the same change in half-life for DAQ 3, we will corrected the half-life from DAQ 3 by this time and add it quadartically to the error for DAQ 3.
For the whole body of data, the further analysis was then very similar. In a first fit with fixed half-lives for 62Ga and 62Cu, the fit parameters for the counting rates of the different contributions were determined. This fit was performed over the whole time range of the cycles. A second fit over the whole time range was then performed with the 62Ga half-life as an additional free parameter. The final fit was performed on the decay part of the spectrum only, with three free parameters: the 62Ga rate and half-life as well as the background rate. The parameters describing the 62Cu contribution were kept at the values from the previous fit. The fact that we fixed the 62Cu contribution does not influence the fit results in any significant way. In fact, due to its rather long half-life (584.4 s), the 62Cu contribution can basically be treated as a constant background in the decay part of the time distribution (see below). This third fit yielded the final half-life value for each run and each data acquisition system.
3.2 Systematic errors and possible influences of contaminants
As we performed part of the fits on the whole time range of the cycles, the beam-on and beam-off times are crucial for a good description of the experimental spectra by the fit. In order to study the influence of the exact time stamp when the beam was switched on or off, we performed fits to the data with fixed switching times (100 ms and 500 ms after the start of a cycle) and with variable switching times, where the times were treated as fit parameters. As the quality of the fit and thus the resulting half-life depended strongly on these times, we finally used fixed values, however, as adjusted in the analysis where they were treated as free parameters.
An important correction to the half-life comes from the dead-time. In order to study the influence of this correction, we performed tests with different fixed dead-times generated by hardware for DAQ 1 and DAQ 2. The half-life values determined for 62Ga for fixed dead-times of 2s and 5s were in nice agreement. In addition, DAQ 3 had a much longer dead-time of 30s. After correction we obtained half-life values in agreement with DAQ 1 and DAQ 2 for each run.
An independent check of the dead-time correction as well as of other parts of the analysis procedure was performed with the simulated data mentioned above. As shown below, after analysis of these data the input half-life was nicely reproduced.
Another check performed on the data was to start the fit later in the time spectrum. If the spectra were affected by a significant dead-time, a fit from the beginning of the decay curve should yield a longer half-life than a fit where the first part of the decay-time distribution is excluded. Such a behaviour could be explained by the fact that the first part of the time distribution is more subject to dead-time due to its higher counting rate than a later part in the time distribution. However, no effect was observed.
As the IGISOL system is not chemically selective, all mass A=62 nuclei produced in the reaction are transported to the detection station. This means for example that much more 62Cu and 62Zn was deposited on the collection tape. However, as mentioned above, due to its rather long half-life 62Zn is not of concern. In contrary, 62Cu has to be considered as its production rate was about 250 times higher than the one of 62Ga. Therefore we tested different procedures in order to take into account the 62Cu distribution. It turned out that this contaminant could be treated as a constant contamination in the decay part of the spectrum. In fact, whatever we did with the 62Cu contribution, the fit adjusted the level of the background in the opposite way, as it is expected for a basically constant contribution from 62Cu.
Finally, the fact that consistent results have been obtained for the three acquisition systems indicates that acquistion related phenomena like the dead-time were treated correctly.
3.3 Half-life results
Approximatively 107 decay events of 62Ga were recorded. Figure 2 presents the experimental data and the result of the fit for one run together with its extracted half-life.
The half-life determined for each run and each acquisition system as well as the reduced value for each individual fit are shown in figure 3. The half-lives scatter around 116 ms and the reduced values are close to unity except for one low-statstics run. The error-weighted average yields the final half-life for each data
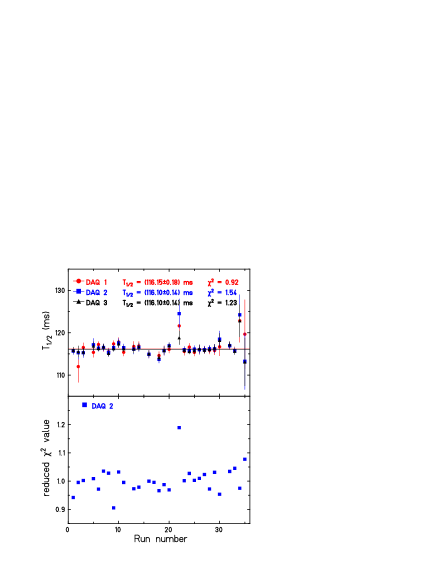
acquistion system and its associated analysis. However, due to the fact that the averaging procedure does not give an acceptable reduced value for two of the data acquisition systems, we normalized the error bars of the individual half-lives for each run by the square root of the reduced value, as proposed by the Particle Data Group [14]. The new average obtained with the increased error bars yields the final result for each data set. These results are given in table 2. As our final result we adopt the error-weighted average of these three results. However, as the data for the three acquisition systems originate from the same data sample, we keep as the final error the smallest error bar of the three data acquisitions. This result is therefore 116.09(17) ms. It will be compared below to other experimental half-lives.
| DAQ 1 | DAQ 2 | DAQ 3 | Final result |
| 116.15(18) | 116.10(17) | 116.02(17) | 116.09(17) |
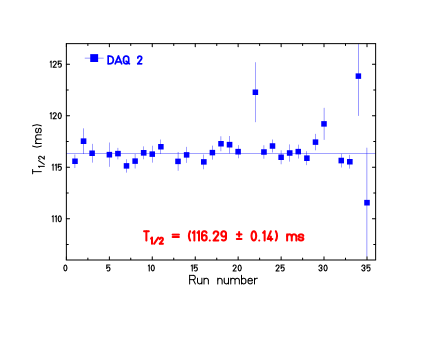
The simulation data which were generated with the same parameters as the experimental data and treated in the same way as described above are shown in figure 4. The dead-time corrected data yield an average half-life of 116.29(14) ms for an input value of 116.2 ms.
4 Branching ratios
Another goal of the experiment described here was to measure branching ratios for all important decay branches, in particular for allowed Gamow-Teller branches and non-analog Fermi transitions, with the Fermi transition to the first excited 0+ state in 62Zn located at 2.33 MeV being the most important transition to measure. If observed, the branching ratio for the Fermi transition allows for a direct comparison to theoretical prediction of one part of the isospin-mixing correction .
Figure 5 shows the -gated -ray spectra in the vinicity of the 954 keV ray from the decay of the first excited 2+ state in 62Zn. After efficiency correction and normalisation to the number of 62Ga implanted, we find a branching ratio for this line of (0.11 0.04) %.

According to selection rules, the state can not be fed directly by an allowed decay. The explanation is that the state acts as a collector state which collects most of the -decay strength from higher-lying and levels. Therefore, we searched also for - coincidences with the 954 keV. However, no clear indication for a cascade was found with -ray energies below 2.8 MeV. In particular, we looked for a 1376 keV transition from the first excited 0+ to the first excited 2+ state. However, neither the - coincidence data with the 954 keV line nor a direct analysis of the singles spectrum at 1376 keV yielded any evidence for such a line. From the direct search, we established an upper limit of 0.039 % (95 % confidence level) for the branching ratio for this transition by fitting the germanium spectra with a Gaussian plus a linear background term.
| Alburger [6] | Chiba et al. [7] | Davids et al. [8] | Hyman et al. [9] | Blank et al. [10] | Present work | Average |
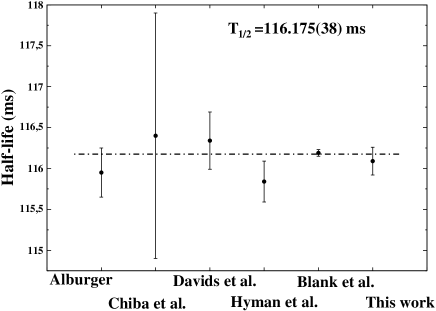
| 115.95(30) ms | 116.4(15) ms | 116.34(35) ms | 115.84(25) ms | 116.19(4) ms | 116.09(17) ms | 116.175(38) ms |
5 Discussion and conclusions
Our experimental result for the half-life of 62Ga of T1/2 = 116.09(17) ms is in nice agreement with all previous half-life measurements (see table 3 and figure 6). It is the second most precise value ever measured. The fact that all experimental half-lives are in agreement gives some confidence that the half-life of 62Ga is known now with sufficient precision in order to serve for the determination of the corrected value for the super-allowed decay of 62Ga. By averaging the experimentally measured half-life values, we obtain the new recommended half-life of 62Ga of 116.175(38) ms.
Several -decay branching ratio measurements of 62Ga have been published recently [5, 9, 15] and they are all in excellent agreement with our results. As mentioned above, we find that the intensity of the 954 keV line, de-exciting the first excited 2+ state to the ground state of 62Zn, is 0.11(4) %. In table 4, we compare our result for this decay branch with the other experimental data published.
Based on his results for the branching ratios in conjunction with shell-model calculations, Hyman et al. [9] determined a branching ratio of 99.8(1) % for the super-allowed decay from the ground state of 62Ga to the ground state of 62Zn, a result which is not altered by our new results.
| Blank [5] | Hyman et al. [9] | Döring et al. [15] | Present work | Average |
| 0.12(3) % | 0.120(21) % | 0.106(17) % | 0.11(4) % | 0.112(11) % |
Similar agreement is obtained for the upper limit for the feeding of the excited 0+ state at 2.33 MeV fed by a forbidden Fermi transition. Our limit of 0.039 % (95% confidence limit) compares well with a limit of 0.017% [5] and 0.043% [9] (one-sigma limits) obtained earlier. In a two-level mixing model, this upper limit can be compared to the part of the isospin correction which is due to level mixing [16]. From our new limit of 0.039%, we calculate an upper limit of the mixing matrix element of = 0.21 which can be compared to theoretical results from Ormand and Brown of = 0.169 and 0.079 [17] using two different shell interactions and from Towner and Hardy of = 0.085(20)[3]. Our upper limit is still in agreement with these predictions, which means that more precise experimental data for the feeding of the state in 62Zn are needed to distinguish between the different model predictions.
Figure 7 presents a partial decay scheme for 62Ga which summarizes the different branching ratios, the half-life, and the -decay Q value. These values will be used to determine the value for the super-allowed decay of 62Ga.

The experimental results now available for the decay of 62Ga, i.e. the Q value of 9171(26) keV [8], the half-life of 116.175(38) ms, and the branching ratio of 99.8(1)% yield a ft value of ft=3056(47) s. Finally, by taking into account the correction factors as calculated by Towner and Hardy [3], we derive a corrected Ft value of Ft=3057(47) s. This value is basically the same as the one for ft, as the correction factors nearly compensate each other.
This result agrees well with the average Ft value, 3072.2(8) s, obtained from the nine well-known superallowed decays of nuclei with 10A54. However, the poor precision on QEC and to some extent on the branching ratio severely limits the precision one can achieve for the moment on the Ft value for 62Ga. Mass measurement campains on 62Ga and 62Zn are planned or have recently started at ISOLTRAP at CERN and at the new JYFL-trap in Jyväskylä to reach a precision for both systems of the order of 10-8. More experiments on the precise measurement of the branching ratios are planned for the near future. Therefore, a high-precision Ft value can be expected in the near future for 62Ga. These results together with results recently published for 74Rb [18] will allow us to test the CVC hypothesis through decay of higher-Z nuclei, to verify the isospin correction terms more carefully, and to yield a better understanding of the weak-interaction standard model.
Acknowledgment
The authors would like to acknowledge the continous effort of the whole Jyväskylä accelerator laboratory staff for ensuring a smooth running of the experiment. This work was supported in part by the Conseil Régional d’Aquitaine and by the European Union Fifth Framework Programme ”Improving Human Potential - Access to Research Infrastructure” (Contract No. HPRI-CT-1999-00044). We also acknowledge support from the Academy of Finland under the Finnish Centre of Excellence Programme 2000-2005 (Project No. 44875, Nuclear and Condensed Matter Physics Programme at JYFL).
References
- [1] I. S. Towner and J. C. Hardy, J. Phys. G: Nucl. Part. Phys. 29 (2003) 197.
- [2] J. C. Hardy et al., Nucl. Phys. A 509 (1990) 429.
- [3] I. S. Towner and J. C. Hardy, Phys. Rev C 66 (2002) 035501.
- [4] A. Sher et al., Phys. Rev. Lett. 91 (2003) 261802.
- [5] B. Blank, Eur. Phys. Jour. A 15 (2002) 121.
- [6] D. E. Alburger, Phys. Rev. C 18 (1978) 1875.
- [7] R. Chiba et al., Phys. Rev. C 17 (1978) 2219.
- [8] C. N. Davids et al., Phys. Rev. C 19 (1979) 1463.
- [9] B. C. Hyman et al., Phys. Rev. C 68 (2003) 015501.
- [10] B. Blank et al., Phys. Rev. C 69 (2004) 015502.
- [11] P. Dendooven, Nucl. Instrum. Meth. Phys. Res. B 126 (1997) 182.
- [12] J. Äystö, Nucl. Phys. A 693 (2001) 477.
- [13] K. T. Loberg et al., IEEE Trans. on Nucl. Sci. 42 (1995) 17.
- [14] G.P. Yost et al., Phys. Lett. B 592 (2004) 1.
- [15] J. Döring et al., Proceeding of ENAM2001, Hämeenlina, Finland, 2001, edited by J. Äystö, P. Dendooven, A. Jokinen and M. Leino. Springer-Verlag Berlin (2002), p. 323.
- [16] J. C. Hardy and I. S. Towner, nucl-th/9812036 (1998).
- [17] W. E. Ormand and B. A. Brown, Phys. Rev. C 52 (1995) 2455.
- [18] A. Kellerbauer et al., Phys. Rev. Lett. 93 (2004) 072502.