Determination of the Gamow-Teller Quenching Factor from Charge Exchange Reactions on
Abstract
Double differential cross sections between – were measured for the reaction at 293 MeV over a wide excitation energy range of 0–70 MeV. A multipole decomposition technique was applied to the present data as well as the previously obtained data to extract the Gamow-Teller (GT) component from the continuum. The GT quenching factor was derived by using the obtained total GT strengths. The result is , not including an overall normalization uncertainty in the GT unit cross section of 16%.
keywords:
Charge exchange reaction; Gamow-Teller strength; Gamow-Teller sum rulePACS:
24.30.Cz, 25.40.Kv, 27.60.+jThe reaction at intermediate energies provides a highly selective probe of spin-isospin excitations in nuclei due to the energy dependence of the isovector part of nucleon-nucleon (NN) -matrices [1]. The spectrum of this reaction is marked by the dominance of the Gamow-Teller (GT) giant resonance (GTGR), which is the mode [2, 3]. There exists a model-independent sum rule, , where is the total GT strength observed for the type [4]. Surprisingly, however, only a half of the GT sum rule value was identified from measurements in the 1980’s on targets throughout the periodic table [5]. This problem, the so-called quenching of the GT strength, has been one of the most interesting phenomena in nuclear physics because it could be related to non-nucleonic degrees of freedom in nuclei. At that time it was often assumed that the missing strength was shifted to the energy region of the excitation due to coupling between nucleon particle-hole (ph) and -isobar nucleon-hole (h) states [6, 7]. However, part of the quenching is due to the nuclear configuration mixing between 1p1h and 2p2h states [8, 9]. To discuss the contribution of 2p2h states quantitatively, one should search for missing GT strength in the continuum, excitation energy region of 20–50 MeV, where a significant amount of the 2p2h component is predicted [8, 9].
In 1997, Wakasa et al. [10] accurately measured the spectra at 295 MeV, the energy at which spin-flip cross sections are large, distortion effects are minimal [11] and therefore the characteristic shapes of the angular distributions for each angular momentum transfer () are most distinct. They successfully identified the GT strength in the continuum region through multipole decomposition (MD) analysis which extracted the component from the cross sections [10]. They obtained a GT quenching factor, defined as , of , where the error is due to the uncertainty of the MD analysis [10]. As discussed in Ref. [10], the main source of the systematic uncertainties is the overall normalization, i.e., the GT unit cross section and the value. The uncertainty of the GT unit cross section amounts to 16%, but will be reduced to by the ongoing systematic analysis of new data at 295 MeV [12]. On the other hand, the uncertainty in the value is difficult to properly assess. A value of used in Ref. [10] was obtained from a similar, but simpler MD analysis of data at 198 MeV by Raywood et al. [13]. Raywood et al. found a significant amount of the monopole () cross sections in the continuum in the region of MeV, which corresponds to a GT strength of 5, but attributed all to the isovector spin-monopole (IVSM) strength [13]. Thus, the quenching factor was subject to uncertainties of both the strength in the continuum and contributions of the IVSM component. To reduce those systematic uncertainties, it is essential to have accurate data at the same energy as the data, and to perform consistent analyses on both sets of data. In this letter the measurement of the reaction at 293 MeV is reported. Performing a consistent analysis on both the and data, we have derived a reliable GT quenching factor.
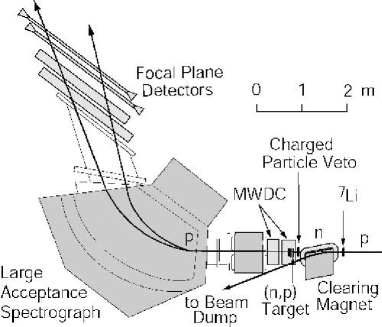
The measurement was performed with the facility [14] at the Research Center for Nuclear Physics (RCNP). A schematic view of the facility is shown in Fig. 1. A nearly mono-energetic neutron beam was produced by the reaction at 295 MeV. The primary proton beam, after going through the target, was deflected away by the clearing magnet to a Faraday cup in the floor. The typical beam intensity was 450 nA and the thickness of the target was 320 mg/cm2. About neutrons bombarded the target area of located 95 cm downstream from the target. Three targets with thicknesses of 485, 233, and 215 and a polyethylene () target with a thickness of 46 were mounted in a multiwire drift chamber (MWDC). Wire planes placed between the targets detected outgoing protons and enabled us to determine the target in which the reaction had occurred. Charged particles coming from the beam line were rejected by a veto scintillator with a thickness of 1 mm. The scattering angle of the reaction was determined by the information from the target MWDC and another MWDC installed at the entrance of the Large Acceptance Spectrometer (LAS) [15]. The outgoing protons were momentum-analyzed by LAS and were detected by the focal plane detectors [16]. The number of events from the target was compared to the SAID [17] calculated cross sections for normalization of the neutron beam flux. Blank target data were also taken for background subtraction.
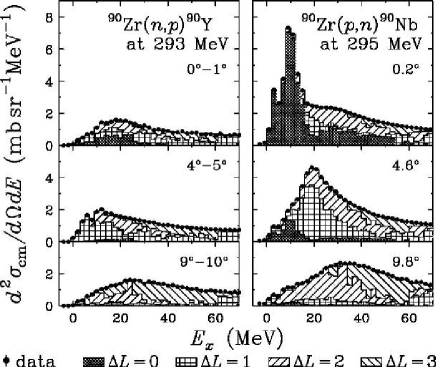
We have obtained double differential cross sections up to 70 MeV excitation energy over an angular range of – in the laboratory frame. The data have been analyzed in 1-degree bins. The spectra at three of the twelve angles are shown in the left panel in Fig. 2 by the solid dots. The overall energy resolution is 1.5 MeV, mainly originating from the target thicknesses and the energy spread of the beam. The angular resolution is 10 mr which is dominated by multiple scattering effects in the targets. In addition to the statistical uncertainty of % per 2-MeV excitation energy bin, there is a systematic uncertainty of 5%, where the main contributions are that of target thicknesses (4%) and the angular distribution of the cross section taken from the phase-shift analysis (2%). The right panel in Fig. 2 shows the spectra [10]. At the cross sections are larger than the cross sections not only in the GT resonance region but also in the high excitation energy region of due to excess neutrons in .
The MD analyses were performed on the [10] and excitation energy spectra to obtain GT strengths. Details of the MD analysis are given in Ref. [10]. For each excitation energy bin between 0 MeV and 70 MeV, the experimentally obtained angular distribution has been fitted using the least-squares method with the linear combination of calculated distributions,
| (1) |
where the variables are fitting coefficients all of which have positive values. The calculated angular distributions for each spin and parity transfer have been obtained using the distorted wave impulse approximation (DWIA) calculations described below.
The DWIA calculations were performed with the computer code DW81 [18] for the following transfers: , , , and . The one-body transition densities were calculated from pure 11 configurations. The and configurations were used to calculate the GT transitions in the analyses of both the and the spectra. For the transitions with in the channel, the active proton particles were restricted to the , , , , , or shells, while the active neutron holes were restricted to the , , , , or shells by assuming to be the core. In the analysis of the spectra, the active neutron particles were restricted to the , , , , or shells, while the active proton holes to , , , or . The optical model potential (OMP) parameters for proton were taken from Ref. [19]. The OMP parameters for neutron were also taken from Ref. [19], but without the Coulomb term. The effective NN interaction was taken from the -matrix parameterization of the free NN interaction by Franey and Love at 325 MeV [1]. It should be noted that DWIA calculations using this parameter set better reproduce the polarization transfer for the reaction than those at 270 MeV [10]. The radial wave functions were generated from a Woods-Saxon (WS) potential [20], adjusting the depth of central potential to reproduce the binding energies [21, 22, 23, 24]. The unbound particle states were assumed to have a shallow binding energy to simplify the calculations. For a given transfer, the shapes of the angular distributions depend on the 1p1h configurations. Thus, all combinations of 1p1h configurations were examined by the -minimization program and the optimal combination was obtained for each excitation energy bin.
Results of the MD analyses are shown in Fig. 2. The obtained component in the spectra has a large contribution not only in the GTGR region, but also in the high excitation energy region up to 50 MeV [10]. The component of the cross section, , is proportional to the GT strength [5] such that,
| (2) |
where is the GT unit cross section [10] and is the kinematical correction factor [25]. The GT unit cross section has been determined so that the value up to the GTGR region of becomes [5] as described in Ref. [10]. The obtained value is , which is consistent with mb/sr, the value used in Ref. [10].
The strength distributions are shown in Fig. 3. Here the contribution from the isobaric analogue state (IAS) at 5.1 MeV, corresponding to in GT unit [10], is already subtracted. The strength is denoted as because it contains the IVSM component [13]. The error bars are the confidence limits obtained by a Monte-Carlo simulation, where the minimization is performed for synthetic data sets generated by replacing the actual data set in accordance with the statistical errors [26]. The MD analysis of the spectra becomes unstable above 50 MeV excitation [10] and reanalysis with larger bin width has not improved the stability. Therefore we set the upper limit of the excitation energy to 50 MeV. The integrated strength thus obtained is up to 50 MeV excitation energy, neglecting the uncertainty in the subtraction of the IAS contribution. The first error is the statistical error of the MD analysis. The systematic uncertainty due to the input parameters for DWIA calculations has been evaluated by using the wave functions generated from a potential by the relativistic Hartree approach [27] or with other OMPs [11, 27, 28], and it is estimated to be . The third error reflects the error in the GT unit cross section. The distribution of strength in Fig. 3 is shifted by MeV, accounting for the Coulomb displacement energy and the nuclear mass difference. The strength integrated up to 32 MeV excitation of , or MeV in Fig. 3, is .
The curves in Fig. 3 show the theoretical predictions of GT strength distribution by employing the dressed particle random phase approximation (DRPA) model [29], folded by a Gaussian distribution to simulate the energy resolution of the measurement. The agreement between the experiment and the theory is excellent, except in the excitation energy region around 30–40 MeV, where the IVSM resonance is important [13, 30]. The IVSM resonance is the excitation via the operator and has the same spin and parity transfer as the GT resonance. Since the angular distribution of the IVSM transition has a forward peaking shape similar to that of the GT transition [31, 32], the present MD analysis cannot discriminate these two components.
Hamamoto and Sagawa studied the IVSM modes for both the and reactions [30]. They pointed out that the response function to the operator calculated for the excitation contains a small GT component because of the difference of the neutron and proton one-particle wave functions with the same quantum numbers. This GT component has to be subtracted to obtain the pure IVSM strength [30]. Although interference exists between the GT and the IVSM modes, the cross section associated with the pure IVSM component is estimated in this work and its contribution is subtracted incoherently from each spectrum since the distribution of the GT strength in the IVSM resonance region is unknown. The DWIA calculations have been performed by assuming that the strengths are fully exhausted in the state with central energies reported to be 35 MeV in the spectrum [32], corresponding to 19 MeV excitation of , and MeV in Fig. 3, in the spectrum [30]. The transition densities are obtained by the procedure of Condé et al. [33]. The small GT components are explicitly eliminated by modifying the radial wave functions of the final states. The obtained IVSM strengths are within 10% of the theoretical prediction [30]. The calculated IVSM cross sections at for the and the channels are mb/sr ( GT units with ) and mb/sr ( GT units with ), respectively. The uncertainties are mainly due to the choice of OMP parameters. By subtracting these values from , the actual GT strengths of and have been obtained. This new value is consistent with but slightly higher than the one reported in Ref. [10]. The value agrees well with the DRPA prediction of [29].
The present strength may be compared with previously reported results that employed similar MD techniques on the spectra. Condé et al. [33] obtained up to 10 MeV excitation at MeV while Raywood et al. [13] obtained up to at MeV. The errors given above do not include the uncertainty in the GT unit cross section. The strengths obtained in this work up to 8 MeV and 10 MeV excitation are and , respectively. These values are significantly smaller than those obtained by Raywood et al. or by Condé et al. We note that the analysis of the MeV data may suffer from ambiguities in the reaction mechanism due to multi-step processes while the MD analysis at 200 MeV may suffer from the ambiguity due to the distortion effects which are larger than those at 300 MeV.
The consistent analyses of both (p,n) and (n,p) spectra yield a quenching factor of , where the systematic uncertainty of the normalization in the cross section (5%) is also indicated. An uncertainty in the GT unit cross section of 16% is not included. It should be noted that since the errors are correlated, the combined systematic errors are smaller than their geometric sum. Thus quenching of GT strength up to 50 MeV due to coupling between ph and states becomes significantly smaller when 2p2h contributions are properly accounted for [9, 10].
The interpretation of this small quenching in terms of the short range correlation in nuclei is particularly interesting. Assuming that the missing GT strength of % is attributed to the excitation, one can derive the Landau-Migdal (LM) parameter which describes the short range correlations for ph h transitions in the model [34]. The value deduced by using an RPA model in ph and h spaces [34] with the Chew-Low [35] coupling constant () is shown in Fig. 4 as a function of . If we take here , combining the uncertainty of MD analysis and that of IVSM contribution in quadrature, then we derive assuming [36]. Arima et al. have examined the finite size effects of the nucleus by taking the finite range interaction due to - or -exchange into account [37]. If their argument is employed here, the value increases by 0.07 for the same . Therefore it is reasonable to assume the value to be , which is significantly smaller than that assuming the universality relation of the LM parameters, i.e., –0.8 [38]. This result is consistent with those obtained using the coupled channel -matrix calculations [36, 39]. An important consequence of such a small value is the enhancement of the pion correlation in nuclei. According to the RPA prediction by Tatsumi et al. [40] the critical density of the pion condensation becomes , just a half of that predicted by employing the universality assumption.
In summary, we measured the double differential cross sections between – for the reaction at 293 MeV in an excitation energy region of 0–70 MeV to study the GT strengths in the continuum. The MD technique was applied to the measured cross sections to extract the cross section in the continuum. After subtracting the IVSM contribution a total GT strength of up to 32 MeV excitation was obtained. A revised and consistent analysis of the [10] and reaction data from yield a reliable quenching factor of , not including the uncertainty of the GT unit cross section of 16%. The error includes the uncertainty of the estimated IVSM contribution as well as error in the data and the MD analysis. This work is the first attempt to deduce the GT quenching factor by accurately taking into account GT strengths in the continuum region.
References
- [1] M.A. Franey, W.G. Love, Phys. Rev. C 31 (1985) 488.
- [2] R. Doering, A. Galonsky, D. Patterson, G. Bertsch, Phys. Rev. Lett. 35 (1975) 1691.
- [3] K. Ikeda, S. Fujii, J.I. Fujita, Phys. Lett. 3 (1963) 271.
- [4] C. Gaarde et al., Nucl. Phys. A334 (1980) 248.
- [5] C. Gaarde et al., Nucl. Phys. A369 (1981) 258.
- [6] E. Oset, M. Rho, Phys. Rev. Lett. 42 (1979) 47.
- [7] M. Ericson et al., Phys. Lett. 45B (1973) 19.
- [8] M. I. K. Shimizu, A. Arima, Nucl. Phys. A226 (1972) 282.
- [9] G.F. Bertsch, I. Hamamoto, Phys. Rev. C 26 (1982) 1323.
- [10] T. Wakasa et al., Phys. Rev. C 55 (1997) 2909.
- [11] S. Quing-biao, F. Da-chun, Z. Yi-zhong, Phys. Rev. C 43 (1991) 2773.
- [12] M. Sasano et al., private communication.
- [13] K.J. Raywood et al., Phys. Rev. C 41 (1990) 2836.
- [14] K. Yako et al., Nucl. Phys. A684 (2001) 563c.
- [15] N. Matsuoka, T. Noro, RCNP annual report 1987, p.176.
- [16] A. Okihana et al., RCNP annual report 1987, p.171.
- [17] R.A. Arndt, L.D. Roper, Scattering Analysis Interactive Dial-in (SAID) program, SM94 phase shift.
- [18] M.A. Schaeffer, J. Raynal, Program DWBA70 (unpublished); J. R. Comfort, Extended version DW81.
- [19] E.D. Cooper et al., Phys. Rev. C 47 (1993) 297.
- [20] A. Bohr, B.R. Mottelson, Benjamin, New York, 1969, Nuclear structure, Vol. 1, p.239.
- [21] J. Kasagi et al., Phys. Rev. C 28 (1983) 1065.
- [22] J.L. Horton et al., Nucl. Phys. A190 (1972) 362.
- [23] B.M. Preedom et al., Phys. Rev. 166 (1968) 1156.
- [24] A. Graue et al., Nucl. Phys. A187 (1972) 141.
- [25] T.N. Taddeucci et al., Nucl. Phys. A469 (1987) 125.
- [26] S.A. Teukolsky, W.T. Veterling, B.P. Flannery, “Numerical Recipes in C++”, (Cambridge Univ., Cambridge, 2002) p.696.
- [27] D.P. Murdock, C.J. Horowitz, Phys. Rev. C, 35, 1442 (1987); C.J. Horowitz, D.P. Murdock, and B.D. Serot, in “Computational Nuclear Physics 1”, edited by K. Langanke, J.A. Maruhn, and S.E. Koonin (Springer, New York, 1993) p.129.
- [28] L. Rikus, N. Nakano, H. V. von Geramb, Nucl. Phys. A414, 413 (1984); J.J. Kelly, Program Code LEA.
- [29] G.A. Rijsdijk et al., Phys. Rev. C 48 (1993) 1752.
- [30] I. Hamamoto, H. Sagawa, Phys. Rev. C 62 (2000) 024319.
- [31] A. Klein, W.G. Love, N. Auerbach, Phys. Rev. C 31 (1985) 710.
- [32] D.L. Prout et al., Phys. Rev. C 63 (2000) 014603.
- [33] H. Condé et al., Nucl. Phys. A545 (1992) 785.
- [34] T. Suzuki, H. Sakai, Phys. Lett. B 455 (1999) 25.
- [35] G.F. Chew, F.E. Low, Phys. Rev. 101 (1956) 1570.
- [36] W.H. Dickhoff et al., Phys. Rev. C 23 (1981) 1154.
- [37] A. Arima, W. Bentz, T. Suzuki, T. Suzuki, Phys. Lett. B 499 (2001) 104.
- [38] E. Oset et al., Phys. Rep. 83, 281 (1982).
- [39] H. Sagawa et al., Phys. Rev. C 33 (1986) 629.
- [40] M. Nakano et al., J. Mod. Phys. E 10 (2001) 459; T. Tatsumi et al., private communication.