Single Electron Elliptic Flow Measurements in Au+Au collisions from STAR
Abstract
Recent measurements of elliptic flow and the nuclear modification factor of strange mesons and baryons in the intermediate domain in Au+Au collisions demonstrate a scaling with the number-of-constituent-quarks. This suggests hadron production via quark coalescence from a thermalized parton system. Measuring the elliptic flow of charmed hadrons, which are believed to originate rather from fragmentation than from coalescence processes, might therefore change our view of hadron production in heavy ion collisions.
While direct measurements of charmed hadrons are currently not available, single electron at sufficiently high transverse momenta can serve as a substitute. At transverse momenta above GeV/c, the production of single electrons from non-photonic sources is expected to be dominated by the decay of charmed hadrons. Simulations show a strong correlation between the flow of the charmed hadrons and the flow of their decay electrons for GeV/c.
We will present preliminary STAR results from our single electron measurements from Au+Au collisions at RHIC energies.
1 Introduction
Elliptic flow of hadrons has long been suggested as a sensitive probe of the pressure built up in the early stages of heavy ion collisions [1]. It has furthermore been proposed as a signal of a phase transition from Quark-Gluon-Plasma to hadronic matter [2]. At RHIC energies, for the first time in relativistic heavy ion collisions, elliptic flow of unflavored and strange hadrons111Throughout this manuscript we will call the and quarks the unflavored quarks. Hadrons built up exclusively from unflavored constituent quarks will be called unflavored hadrons. In this notation, the -meson will be flavored. and quarks will be called light quarks. was found to be reasonably well described by hydro-dynamic calculations [3] up to transverse momenta of at least GeV/c as shown in Figure 1[4] for the 80% most central events from collisions at GeV.
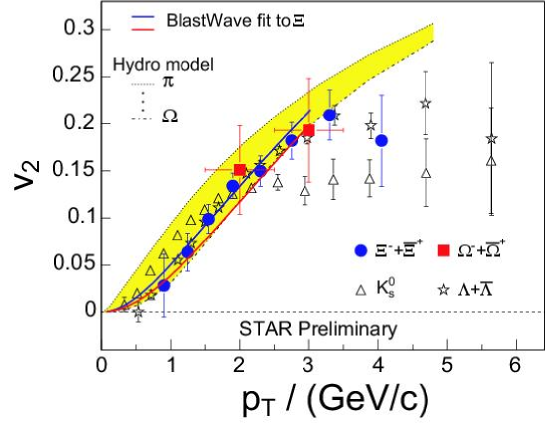
At transverse momenta above GeV/c however, the measured values seem to saturate and therefore are not describe by the hydro-dynamic calculations anymore. More interesting than this deviation between data and calculation is an apparent splitting between mesons and baryons, independent of their masses. While mass ordering is an essential feature of hydro-dynamics and has been shown to lead to lower values for heavier particles in the low transverse momentum region [5], a mass independent splitting between mesons and baryons has also been observed in the nuclear modification factor [6]. Voloshin first suggested a scaling of and with the number of constituent quarks for all particle species [7], which has been interpreted as a signal for a partonic phase in the early stages of the collision. This interpretation is supported by quark coalescence and quark recombination models, which are able to reproduce the measured and values at intermediate transverse momenta (— Gev/c) when assuming a system of thermalized quarks [8]. Please note, at even higher transverse momenta ( GeV/c) , hadron production is expected to be dominated by parton fragmentation, hence quark coalesence models should break down in the high- region [9].
In the regime where quark coalescence is valid, the elliptic flow for all particle species can be expressed as
| (1) |
Here, is the number of constituent quarks and () is the hadron (quark) elliptic flow amplitude.
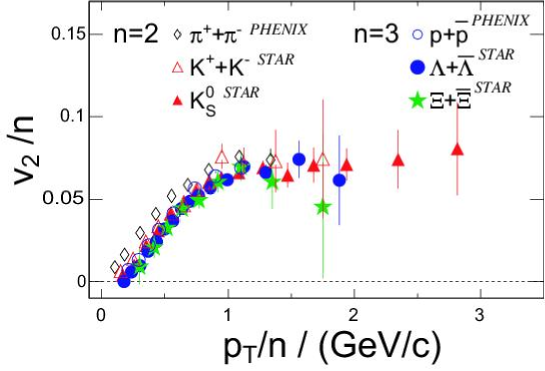
Figure 2 [4] shows the scaled flow amplitudes as a function of for three meson and three baryon species, again for the 80% most central events from collisions at GeV. Ignoring the low momentum pions, which suffer from strong resonance feed-down, the number-of-constituent-quark-scaling seems to nicely hold for hadrons built up from and quarks. Note, there is no evident ordering between hadrons of different strangeness content, suggesting that the quark’s flow is similar to that of the quarks [8] .
With the arrival of the first charm measurements from the RHIC detectors, it is now of great interest to study the elliptic flow of charmed hadrons. Within quark coalescence models, and of and quarks being determined from Figures 1 and 2, elliptic flow measurements from D-mesons present a direct measure of the quark elliptic flow (). In contrast to the and quarks which are predominantly produced in soft collisions, quarks are expected to be produced via hard processes. At the time of their creation, quarks should therefore be unaware of the collision geometry, i.e. carry no azimuthal anisotropies. Due to the large mass of the quark, Dong et al[11] argue, that large values can only be achieved if re-scattering in a partonic phase is strong enough to also thermalized the light quarks.
The measurement of D-meson elliptic flow might therefore not only challenge our current understanding of charmed hadron production, but also strengthen the case of a system with partonic degrees of freedom and is a sensitive probe of thermalization therein.
2 Concepts
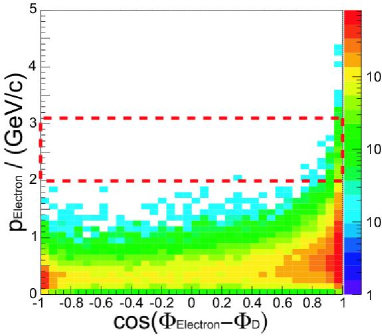
Although we have reported on measurements of open charm directly via invariant mass reconstruction of D-Mesons from hadronic decays, i.e. , in d+Au collisions [10], low signal statistic and the large combinatoric background beneath the signal do not allow to study azimuthal anisotropies. However, at higher transverse momenta semileptonic decays () are expected to dominate the single electron spectrum and for momenta higher than GeV/c, the decay electron’s azimuthal angle reflects the D-meson’s azimuth angle very accurately as shown in the left panel of Figure 3. Plotted is the cosine of the difference of the D-meson’s and its decay electron’s azimuthal emission angles () is versus the electron momentum. The dashed box reflects the momentum region used for this manuscript. Simulations done for this analysis and in [11, 13, 14] suggests that single electron is a good measure of open charm flow as seen in the right panel of Figure 3 (taken from [12]). Here, the solid lines depict the D-meson flow from quark coalescence under the assumptions that the quark a) does not flow (, lower line), and b) flows just as the light quarks (, upper line). The dashed lines and the symbols represent the flow of single electrons from D-meson decays under these assumptions.
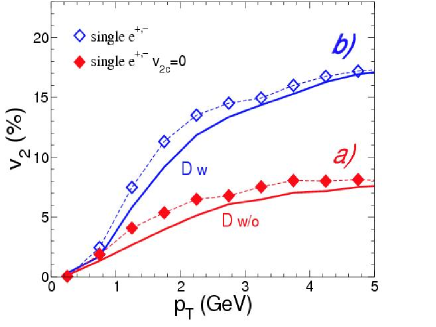
Note, for both assumptions, only D-meson production from coalescence is taken into account. Possible anisotropies from jet fragmentation are omitted.
3 Analysis
For the analysis reported on here, we studied data from Au+Au collisions at GeV recorded by STAR[16] during Brookhaven’s RHIC beam-time in the year 2001. Selecting the 80% most central events from a minimum bias triggered data set and after applying quality cuts (e.g. requiring the primary vertex to be located within cm from the center of the STAR Time Protection Chamber (TPC) [15] along the beam-axis), we used about 2M events.
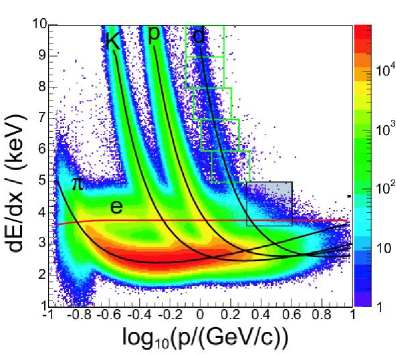
Similar as described in [17], the event-by-event reaction-plane was determined by calculating the Q-vector from charged particles within the phase space region and . For the electron candidate tracks to be correlated with the reaction-plane the momentum range was restricted to and a cut on the track’s specific ionization of the TPC gas was placed at . The choice of these selection criteria is due to the , K, p, and deuteron bands crossing over the electron band at lower momenta and the limited separation between the bands above GeV/c as seen in the left panel of Figure 4.
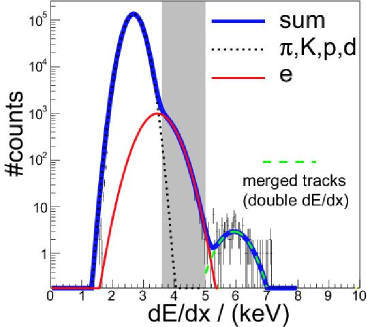
The right panel shows the distribution in the momentum range . The three gaussian curves represent: a) the combined contributions from , K, p, and deuteron tracks centered at about keV/cm, b) the contribution from electrons centered at keV/cm, and c) background believed from merged tracks222two tracks close together in the TPC which are falsely identified as one single track at keV/cm. The shaded areas indicate the region accepted, leading to a non-electron contamination of about 10%, while rejecting about 80% of the total electron yield.
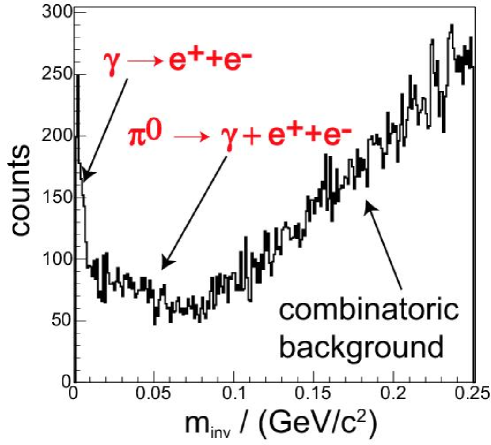
Before these electron candidates are correlated with the reaction-plane, we perform an invariant mass calculation for each candidate with all other tracks within the same event. The so obtained invariant mass distribution (see Figure 5) features three distinct regions: a) a sharp peak from conversion in the detector material, b) a smeared out peak from the Dalitz decay where the is not reconstructed, and c) the combinatoric background of random pairs. All electrons which form a pair with an invariant mass of less that MeV/c2 are removed from the candidate sample.
With detailed simulations of the STAR detector and using the distribution from [18], we find that this method eliminates about 50% of all electrons originating from decays and -conversions. In the momentum interval , we estimate our electron sample to constitute to 63% from D-meson decays and to 37% from electrons from the remaining photonic sources ( conversion and Dalitz decays). Electron backgrounds originating from other sources, e.g. the Dalitz decay, are expected to be relatively small [10] and are neglected for this analysis.
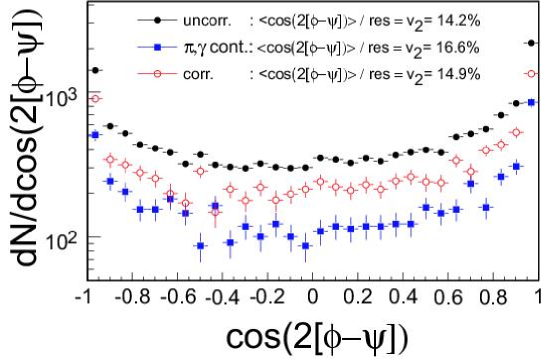
The azimuth angles from the remaining are now correlated with the reaction-pane angles and the distribution (see Figure 6) recorded. The value can then be calculated . Here, is the reaction-plane resolution which is determined via the sub-event method as described in [19].
4 Results
In order to correct for the 37% background from photonic sources, we again use the spectrum from [18] onto which we impose elliptic flow according to Figure 2 (). Passing the resulting azimuthal anisotrop –distribution through our detector simulation and analysis code, we obtain a distribution as shown by the squares in Figure 6. Subtracting this distribution from the uncorrected distribution (solid bullets), we obtain the distribution for from D-meson decays (open bullets). Again, the elliptic flow amplitude is calculated as and evaluates to in the momentum interval . Our preliminary estimate of systematic uncertainties originates from uncertainties in the and the exact amount of photonic background and adds up to (relative). Other sources of systematic uncertainties (e.g. a slight systematic bias against central events when removing –conversion electrons) are still under investigation.
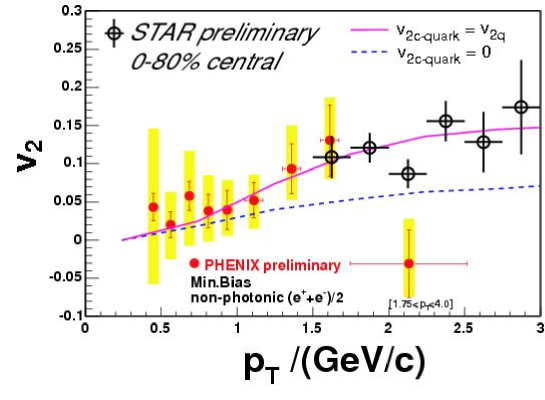
Figure 7 shows our preliminary single electron elliptic flow results as a function of transverse momentum (open bullets). Again, the vertical bars represent only the statistical uncertainties and our preliminary systematic uncertainty estimate is about . The figure also features data from a similar analysis presented by the Phenix experiment [14] (full bullets). Neglecting the difference in the centrality of the event samples used (Phenix: min. bias, this analysis 0-80% central), our data agree well with the Phenix results and extend them smoothly to higher momenta.
The data points seem to favor the prediction from the quark coalescence model [12, 13] under the assumptions of a partonic stage with thermalized and strongly flowing quarks (solid line). However, with the present understanding of systematic uncertainties, the non-flow assumption can not be ruled out completely.
References
References
- [1] Ollitraut J-Y, Phys.Rev.D 46 (1992 ) 229
- [2] Sorge H, Phys.Rev.Lett 82 (1999) 2048
- [3] Huovinen P et al, Phys. Lett. B503 (2001) 58
- [4] Schweda K for the STAR Collaboration, J. Phys. G30 (2004) S693
- [5] Adler C, et al, Phys.Rev.Lett 87 (2001) 182301
- [6] Adams J, et al, Phys.Rev.Lett 92 (2003) 052303 S693
- [7] Voloshin A, Nucl. Phys. A (2003) 379
- [8] Nonaka C and Fries R J and Bass S A, nucl-th/038051
- [9] Monlar D and Voloshin A, nucl-th/0302014
- [10] Adams J et al, nucl-ex/0407006
- [11] Dong X et al, nucl-th/0403030
- [12] Greco V and Ko C M, nucl-th/0405040
- [13] Greco V and Ko C M and Rapp R, nucl-th/0312100
- [14] Kaneta M et al, nucl-th/0404014
- [15] Anderson M et al, Nucl. Instrum. Meth. A 499 (2003) 659
- [16] Ackerman K H et al, Nucl. Instrum. Meth. A 499 (2003) 624
- [17] Ackerman K H et al, Phys. Rev Lett 86 (2001) 402
- [18] Adler S S et al, Phys. Rev. Lett. 91 (2003) 0702301
- [19] Adler C et al, Phys. Rev. C 66 (2004) 034904