Inclusive spectra at high transverse momentum in d-Au collisions at RHIC
Abstract
Preliminary results on inclusive neutral pion production in d-Au collisions at = 200 GeV in the pseudo-rapidity range are presented. The measurement is performed using the STAR Barrel Electromagnetic Calorimeter (BEMC). In this paper, the analysis of the first BEMC hadron measurement is described and the results are compared with earlier RHIC findings. The invariant differential cross sections show good agreement with next-to-leading order (NLO) perturbative QCD calculations.
1 Introduction
A suppression of high hadron production relative to a simple scaling from p-p has been observed in central Au-Au collisions at RHIC [1, 2]. It was also found that jet-like correlations opposite to trigger jets are suppressed and that the elliptic anisotropy in hadron emission persists out to very high [3, 4]. In contrast, no suppression effects were seen in d-Au collisions, which provide an important control experiment for the effects of cold nuclear matter. This has led to the conclusion that the observations are due to the high density final state in Au-Au. The most probable explanation to date is parton energy loss from induced gluon radiation (jet quenching). For a recent review see Ref. [5]. To quantitatively understand the existing modification from cold nuclear matter, precise measurements of identified hadrons at high in d-Au are required. The STAR EMC allows high transverse momentum measurements of , mesons and direct photons and may contribute to the identification of mesons. In this paper we present preliminary results of neutral pion production in d-Au collisions.
2 Experimental setup
The results were obtained using two components of the STAR detector system [6], namely the Time Projection Chamber (TPC) and the Barrel Electromagnetic Calorimeter (BEMC). The TPC is situated in a 0.5 Tesla solenoidal magnetic field and provides a precise measurement of the charged particle trajectories. The BEMC [7] is a lead-scintillator sampling calorimeter with a of depth of 21 radiation lengths () and an inner radius of 220 cm, divided into towers of granularity . Two layers of gaseous shower maximum detectors (SMD), located at a depth of 5 , measure the EM shower shape with high resolution . In this analysis a partial implementation of the BEMC was used, consisting of 2400 towers covering and full azimuth (the deuteron beam has positive rapidity). When complete, the BEMC will have a coverage of . Beam test results [8] provide the absolute energy calibration, whereas the relative calibration is obtained from the peak position of minimum ionizing particles (mostly charged hadrons) on a tower-by-tower basis [9]. Moreover, an overall gain calibration was obtained by comparing the momentum of electrons identified in the TPC with the energy deposited in the BEMC. The achieved energy resolution is .
In the minimum bias trigger a neutron signal was required in the Zero Degree Calorimeter (ZDC) in the Au beam direction resulting in an acceptance of of the d-Au hadronic cross section. To enhance the high range, two high tower triggers (HT1 and HT2) were used with an energy threshold of 2.5 GeV and 5 GeV for the highest EMC cluster energy, respectively. The tower occupancy is 1–5% for d-Au events, and the high tower trigger efficiency is nearly 100%.
3 Data analysis
After event quality cuts, 10M d-Au events taken in the year 2003 were used for the analysis presented in this paper. Neutral pions were reconstructed in the decay channel (branching fraction 98.8%) by calculating the invariant mass of all pairs of clusters in the calorimeter. Only those clusters were selected which do not have a TPC track pointing to them. Furthermore, a cut on the energy asymmetry was imposed . At present, the full calibration of the calorimeter and the finding of noisy and dead towers are in progress. To perform a neutral pion analysis at this stage a sub-sample of good towers was selected. The quality of the individual towers was checked using the invariant mass distribution. The towers are assigned by the decay photons with the highest energy. Only those towers were used which have a well defined signal above the combinatorial background. A Gaussian fit to the signal has to have a relative mass and width error of 30% and 50%, respectively. By this method approximately one third of all the towers was used for the present analysis. The peak position of all good towers was used to perform an additional tower gain correction (7% on average).
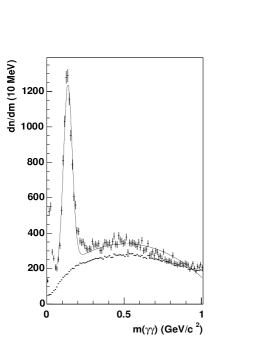
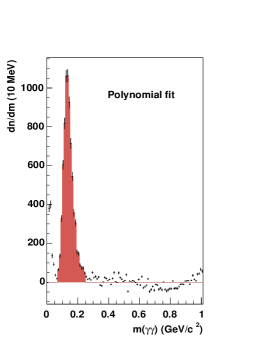
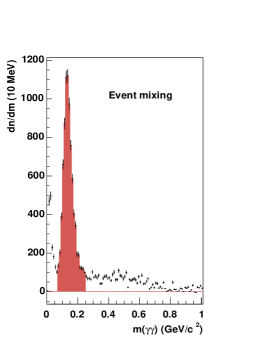
In Fig. 1, the resulting invariant mass distribution of cluster pairs is shown. A clear signal is observed with a RMS width of 28 MeV/. The combinatorial background from random pairs was estimated by two different methods. First, a second-order polynomial was fitted to the invariant mass distribution outside the peak region (solid curve in the left plot of Fig. 1). The second method describes the background using the event mixing technique. The event mixing distribution, which is shown in the lower histogram in the left plot of Fig. 1, describes the background reasonably well in the range 0.8–5 GeV/ (not shown). At lower invariant mass the excess can be attributed to the tail of the peak and a contribution from the signal ( = 547.3 MeV/). The peak observed at 0.05 GeV/ stems from cluster splittings in the EMC towers.
The background subtracted spectra are shown in the middle and right-hand plot of Fig. 1. The yields per event obtained from both subtraction methods were extracted in bins (width of 0.5 GeV for minimum bias and 1 GeV for high tower triggered events) by integrating the background subtracted mass distribution in a range around the peak. The mean values were used for further analysis and the difference contributes 10–15% to the systematic uncertainties. The signal-to-background ratio increases from 1 at about = 1 GeV/c to 8 at 4 GeV/c.
Corrections for reconstruction losses (quality cuts) and detector efficiencies were calculated with Monte-Carlo simulations using the STAR detector geometry and reconstruction software. A correction for the unmeasured trigger fraction, which is expected to be a few percent, is not applied. Losses due to cluster density effects and contributions from weak decays of K0 mesons are not corrected yet, but are expected to be small. The high tower trigger spectra are normalized using pre-scale factors obtained from the ratios of the BEMC cluster transverse energy distributions in the overlap region. The overall systematic errors related to efficiency, yield extraction, pre-scale factors, and energy calibration are estimated to be 30% for low and 50% for high transverse momenta.
4 Results and discussions
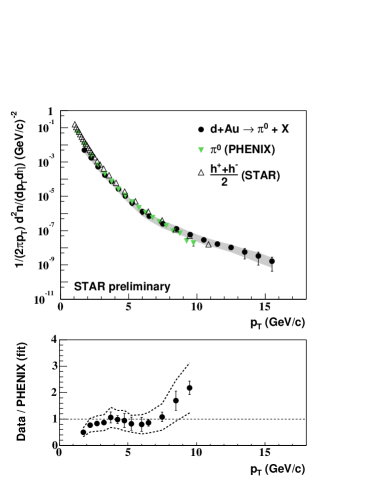
The inclusive distribution for neutral pions is shown in the left panel of Fig. 2. The yields up to 6 GeV/c are from minimum bias events while above 6 (9.5) GeV/c they are from HT1 (HT2) triggered events. For the different trigger samples the yields have an overlap of one point in the spectrum and agree within errors. It is seen from Fig. 2 that mesons are presently measured up to = 16 GeV/c. The spectrum is compared with previous STAR measurements on charged hadron cross section [10] and with PHENIX results on neutral pion production [11]. There is a reasonable agreement within 10–20%.
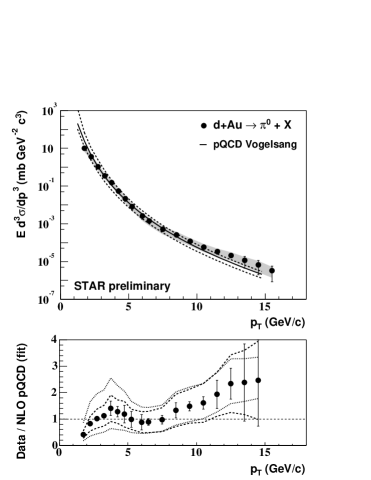
The right panel of Fig. 2 shows the invariant differential cross sections obtained from the product of the yields and the hadronic cross section in d-Au collisions [10]. The normalization uncertainty is 10%. The results are compared to next-to-leading order (NLO) pQCD predictions [12] which are calculated using the CTEQ6M set of nucleon parton distribution functions [13] and the nuclear parton densities in the gold nucleus from [14]. In this calculation the factorization scale was identified with and is varied by a factor two to estimate the scale uncertainties (see Fig. 2). The fragmentation functions are taken from [15]. The Cronin effect is not included in the calculations. The data, within errors, are consistent with the calculation up to = 15 GeV/c.
References
- [1] J. Adams et al. (STAR Collaboration), Phys. Rev. Lett. 92, 052302 (2004).
- [2] J. Adams et al. (STAR Collaboration), Phys. Rev. Lett. 91, 172302 (2003).
- [3] C. Adler et al. (STAR Collaboration), Phys. Rev. Lett. 90, 082302 (2003).
- [4] C. Adler et al. (STAR Collaboration), Phys. Rev. Lett. 90, 032301 (2003).
- [5] P. Jacobs and X. N. Wang, to be published in Prog. Part. and Nucl. Phys. (arXiv: hep-ph/0405125).
- [6] K. H. Ackermann et al. (STAR Collaboration), Nucl. Instrum. Meth. A499, 624 (2003).
- [7] M. Beddo et al. (STAR Collaboration), Nucl. Instrum. Meth. A499, 725 (2003).
- [8] T. M. Cormier et al. (STAR Collaboration), Nucl. Instrum. Meth. A483, 734 (2002).
- [9] J. Adams et al. (STAR Collaboration), arXiv: nucl-ex/0407003 (submitted to Phys. Rev. C) .
- [10] J. Adams et al. (STAR Collaboration), Phys. Rev. Lett. 91, 072304 (2003).
- [11] S. S. Adler et al. (PHENIX Collaboration), Phys. Rev. Lett. 91, 072303 (2003).
- [12] W. Vogelsang, 2004, private communication.
- [13] J. Pumplin et al. (CTEQ Collaboration), J. High Energy Phys. 0207, 012 (2002).
- [14] L. Frankfurt and M. Strikman, Eur. Phys. J. A5, 293 (1999), L. Frankfurt, V. Guzey, M. McDermott, and M. Strikman, J. High Energy Phys. 0202, 027 (2002), L. Frankfurt, V. Guzey and M. Strikman, arXiv: hep-ph/0303022.
- [15] B. A. Kniehl, G. Kramer, and B. Pötter, Nucl. Phys. B582, 514 (2000).