Measurements of R = and the Separated Longitudinal and Transverse Structure Functions in the Nucleon Resonance Region
Abstract
We report on a detailed study of longitudinal strength in the nucleon resonance region, presenting new results from inclusive electron-proton cross sections measured at Jefferson Lab Hall C in the four-momentum transfer range Q GeV2. The data have been used to accurately perform 167 Rosenbluth-type longitudinal / transverse separations. The precision data are presented here, along with the first separate values of the inelastic structure functions and in this regime. The resonance longitudinal component is found to be significant, both in magnitude and in the existence of defined mass peaks. Additionally, quark-hadron duality is here observed above GeV2 in the separated structure functions independently.
pacs:
13.60.-r,12.38.Qk,13.90.+i,13.60.HbThe description of hadrons and their excitations in terms of elementary quark and gluon constituents continues to be one of the fundamental challenges in physics today. Considerable information on nucleon structure has been extracted over the past few decades from separations of inclusive lepton-nucleon cross sections into longitudinal and transverse structure functions. The original experimental observation [1] of the vanishing ratio , the ratio of the contributions to the measured cross section from longitudinally and transversely polarized virtual photon scattering, respectively, as measured in deep inelastic scattering (DIS), provided the first evidence of the fundamental spin-1/2 nature of the partons. Since that time, separated structure functions have been measured in DIS over a wide range of four momentum transfer, , and Bjorken scaling variable , where is the electron energy transfer, and M is the proton mass.
The quantity is expressed in terms of the fundamental nucleon structure functions (purely transverse), (purely longitudinal), and (combined longitudinal and transverse) as follows:
| (1) |
Precision measurements of are necessary for several fundamental measurements. Extractions of the structure function , or of the purely longitudinal or transverse structure functions, and , from cross section measurements have historically depended on assumptions for . The uncertainties introduced by this assumption are highly -dependent, where is the relative longitudinal polarization of the virtual photon in the electron-nucleon scattering process. Uncertainties in the separation of unpolarized structure functions also have a direct impact on the extraction of the spin structure functions from spin-asymmetry measurements in electron scattering. Additionally, precision measurements of can greatly aid efforts to develop decisive global descriptions of existing inclusive electroproduction data at moderate to high and , necessary for lepton-nucleon scattering model development, structure function evolution studies, and accurate radiative correction calculations.
Very few measurements of have been made in the nucleon resonance region. Here, the quantity and precision of the existing data (prior to this work) was such that it was impossible to study either the mass-squared () or dependences of the separated longitudinal and transverse resonant structure. In a resonance excitation probed at moderate momentum transfer, large values of and, correspondingly, , are possible, due to gluon exchanges between the quarks. These effects, as well as the longitudinal character of individual resonances, are accessible via precision measurements of . The results presented here represent the first detailed study of longitudinal strength in the full nucleon resonance region, to investigate nucleon resonance structure, and nucleon structure function behavior.
The experiment (E94-110) ran in Hall C at the Thomas Jefferson National Accelerator Facility (Jefferson Lab, or JLab). An electron beam with a near constant current of 60 was provided by the CEBAF accelerator with seven different energies ranging from 1.2 GeV to 5.5 GeV. Incident electrons were scattered from a 4 cm long liquid hydrogen target and detected in the High Momentum Spectrometer (HMS), over an angular range . To account for backgrounds from production and decay into two photons and subsequent electron-positron pairs, positrons were measured in the Short Orbit Spectrometer (SOS) and also intermittently in the HMS. Other backgrounds included electron scattering from the aluminum walls of the cryogenic target cell, as well as electroproduced negatively charged pions. Events from the former were subtracted by performing substitute empty target runs, while events from the latter were identified and removed by the use of both a gas Cherenkov counter and an electromagnetic calorimeter. In all aspects of this experiment, particular attention was given to demonstrable systematic uncertainty minimization. For more details regarding the analysis and the Hall C apparatus employed in this experiment, see Ref. [2, 3].

The inclusive double differential cross section for each energy and angle bin within the spectrometer acceptance was determined from
| (2) |
where () is the bin width in solid angle (scattered energy), is the total integrated luminosity, and is the measured electron yield after correcting for detector inefficiencies, background events, and radiative corrections. The latter include the bremsstrahlung, vertex corrections, and loop diagrams standard to electron scattering experiments. No corrections were made for higher order radiative processes involving two photon exchange, since there exists no decisive inelastic calculation for such effects. Moreover, minimal (less than [4]) non-linear dependence of the reduced cross section was observed over the large kinematic coverage in , and of this experiment.
For each energy bin, a weighted average cross section over within the spectrometer acceptance was obtained after using a model to correct for the angular variation of the cross section from the central angle value. In order to minimize dependence on the model used to compute both this and the radiative correction, the following iterative procedure was employed: a model was used to compute the corrections; the data thus obtained were fit to obtain a new model; and this resultant new model was then employed to recompute the original corrections. These steps were repeated until the fitting yielded no further changes. Differing starting models were used to verify that the final cross sections were independent of the starting model within . A positive byproduct of this approach is the availability of a new resonance region fit which describes the data here presented to better than [5, 6].
Typical cross section statistical uncertainties per energy bin were less than 1 with systematic errors, uncorrelated in , of . The total systematic scale uncertainty in the cross section measurements was . The full cross section sample consisted of 32 scans across the mass-squared range GeV2. Measurements at over 1,000 distinct , and points were obtained, allowing for longitudinal / transverse separations to be performed at fixed , values with typically between 3 and 5 points in each separation.
The extractions of purely longitudinal and transverse cross sections and structure functions were accomplished via the Rosenbluth technique [7], where measurements are made over a range in at fixed , , and the reduced cross section, is fit linearly with . Here, is the transverse virtual photon flux in the electron-nucleon scattering process. Both and were calculated from the measured kinematic variables. The intercept of such a fit gives the transverse cross section (and therefore the structure function ), while the slope gives the longitudinal cross section , from which can be extracted the structure functions and . Because is determined by the slope of the fit, relative to , the uncertainty in the extracted value of (and likewise, ) is dominated by the uncorrelated uncertainties in the cross sections versus . Typical example Rosenbluth plots are shown Fig. 1.
Prior to a separation being performed, data within a range of GeV2 and range of GeV2 for GeV2 and GeV2 for GeV2 were brought to a central value using a fit. (Larger ranges were employed at the higher W2 values where the cross section becomes less W2-dependent.) Different fits were utilized to assess any model-dependent uncertainty in this step, which was typically less than . This uncertainty concern dictated that separations were not performed if the required centering correction was larger than .
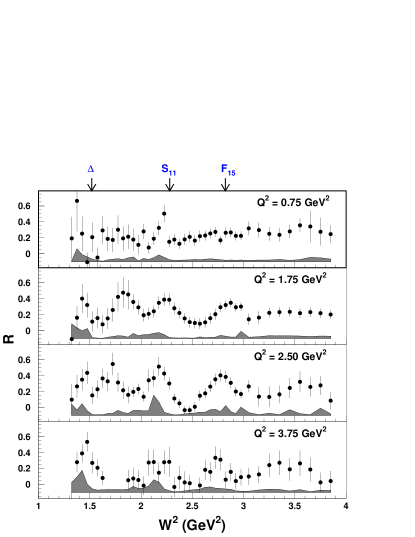
Values obtained for are plotted versus in Fig. 2 for the values indicated. It is clear from the mass enhancements in the data that exhibits resonant structure, and that this variation with can be quite large. This is the first direct observation of such structure, contradicting a common assumption that the resonance contribution to , or the longitudinal strength in the resonance region, is small or negligible (for example, [8, 9, 10, 11, 12, 13, 14]).
The almost twenty well-established nucleon resonances with masses below GeV give rise to only three distinct enhancements in the unseparated inclusive electron scattering cross section and, of the three, only the first (the lowest mass , ) state is not a superposition of overlapping resonant states. The second enhancement region is often referred to as the , as the unseparated cross section here is dominated above GeV2 by the ground state resonance, even though there exists the overlapping resonance. A similar situation is true for the third enhancement region, which is dominated by the , with even more overlapping resonance states. In , however, the situation appears to be different. There is an additional prominent peak at GeV2, somewhat below the dominated mass region.
The lowest mass resonance region exhibits non-negligible longitudinal strength, which does not appear to diminish over the range of this experiment. The spin-flip required for this positive parity isospin excitation suggests that it be dominantly transverse, yet some models predict a possible non-negligible longitudinal component [15, 16, 17, 18, 19]. Recent analyses of predominantly exclusive scattering data from JLab [20, 21, 22] differ somewhat but generally tend to indicate a small longitudinal resonant component. It has been noted that Rosenbluth separated data such as that presented here will be critically useful input to such analyses [23]. It is also possible that the values here observed may indicate a substantial non-resonant background contribution in this regime.
The possible peak observed in at GeV2 in Fig. 2 below the is notable, albeit with large uncertainty, in the longitudinal channel. This mass is close to that of the elusive Roper resonance, , the electroproduction of which is a topic of some interest (see for example, [24, 25, 26, 27, 28, 29, 30]). The excitation of the Roper resonance has been found to be dominantly longitudinal [21]. The observed mass is also near the , or , resonance. This resonance should have a small cross section in electroproduction, however it could show up preferentially in the longitudinal channel which is dominant in kaon production. Regardless of its origin, this is a surprising observation of significant resonant longitudinal strength, and bears further experimental and theoretical investigation.
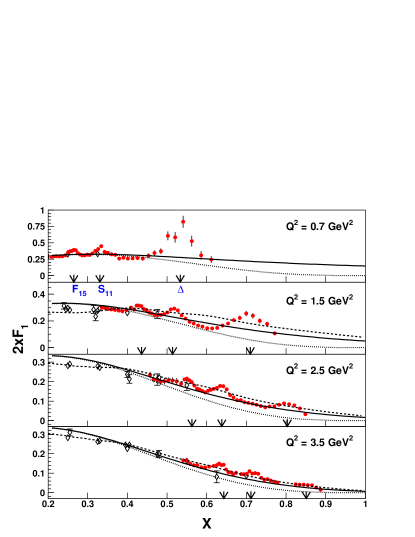
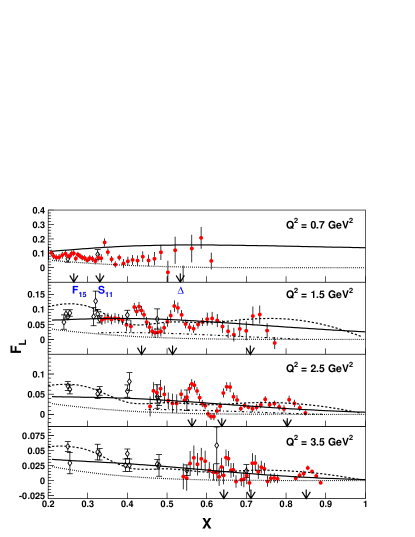
In all, the data clearly exhibit differing longitudinal and transverse resonance behavior, as shown in Fig. 3, where the purely transverse and purely longitudinal structure functions are plotted separately. Here, the structure functions are plotted as a function of rather than , for the purpose of further discussions below. The mass peak regions move up in with increasing . It may be observed that there are mass peaks in both the longitudinal and transverse channels, and that the peak positions differ somewhat. Not only do the data unequivocally demonstrate significant longitudinal resonance structure, but the -dependence of is larger than that of above GeV2, as evidenced by the relatively greater prominence of the mass peaks.
A precise extraction of information on individual resonances, such as transition form factors, from this inclusive data must involve a detailed fitting study beyond the scope of this report. At lower values of GeV2, unitary isobar fits like MAID [31] give quite definite and accurate predictions based on single pion, two pion, eta, and kaon decay channels for resonances below GeV2. At the higher values of the data presented here, however, multi-pion effects, tails of higher mass resonances, and non-resonant components are very significant and therefore such fits tend to underestimate this data, as can be seen from the MAID curve in Fig. 3 (bottom).
Also presented with the resonance region data in Fig. 3 are the predominantly DIS ( GeV2) data from Rosenbluth separations performed at SLAC [32, 33]. Where overlapping, the two data sets are in agreement, providing additional confidence in the achievement of the demanding precision required for these experiments. In all cases, there is a smooth transition between the resonance and DIS data in both and .
The curves shown are parton distribution based parameterizations of structure functions at next-to-next-to leading order, from Alekhin [34], including target mass effects according to [35], and from MRST [36], both with and without target mass effects according to [37, 38]. The MRST parameterization includes data from deep inelastic scattering as well as other experiment types, while Alekhin’s calculation uses only DIS. The latter calculation is valid only down to GeV2.
It is clear that some prescription for target mass effects is required to describe the data. However, for GeV2, it appears that minimal if any additional non-perturbative descriptions (such as higher twist effects) seem necessary to describe the average behavior of the resonance region. The resonances oscillate around the scaling curves. Furthermore, this is true for the range of different values, indicating that the scaling curve describes as well the average dependence of the resonance regime. These observations are consistent with quark-hadron duality [39], and may be counted as the first observation of duality in the separated transverse and longitudinal structure functions.
In summary, we have reported results from a first detailed study of longitudinal and transverse strength in the nucleon resonance region. The new data have yielded an array of interesting observations. Contrary to most transition form factor fit assumptions, the resonant longitudinal component is found to be substantial. Furthermore, the resonance mass dependence of the longitudinal structure function is more pronounced than the transverse. Significant strength is observed between the and resonance mass regions in the longitudinal channel. Separated measurements of the inelastic structure functions and are presented. The data show quark-hadron duality for the first time in the and structure functions independently.
These data are now available [40] for additional studies.
We gratefully acknowledge research grant support from the National Science Foundation and the U.S. Department of Energy. We thank the Jefferson Lab Hall C scientific and engineering staff for their outstanding support. The Southeastern Universities Research Association operates the Thomas Jefferson National Accelerator Facility under the U.S. Department of Energy contract DEAC05-84ER40150.
References
- [1] A. Bodek et al., Phys. Rev. D 20, 1471 (1979) (1978)
- [2] Y. Liang, PhD Thesis, The American University (2003), unpublished
- [3] M. E. Christy et al. [E94110 Collaboration], Phys. Rev. C 70, 015206 (2004)
- [4] V. Tvaskis, J. Arrington, M. E. Christy, R. Ent, C. E. Keppel, Y. Liang and G. Vittorini, Phys. Rev. C 73, 025206 (2006)
- [5] M.E. Christy and P.E. Bosted, Phys. Rev. C 81, 055213 (2010)
- [6] The fit is available at http://www.jlab.org/christy/cs_fits/cs_fits.html
- [7] M.N. Rosenbluth, Phys. Rev. 79, 615 (1956)
- [8] P. Stoler, Phys. Rept. 226, 103 (1993)
- [9] L. M. Stuart et al., Phys. Rev. D 58, 032003 (1998)
- [10] M. M. Dalton et al., Phys. Rev. C 80, 015205 (2009)
- [11] K. Joo et al., Phys. Rev. Lett. 88, 122001 (2002)
- [12] N.F. Sparveris et al., Phys. Rev. Lett. 94, 022003 (2005)
- [13] V.V. Frolov et al., Phys. Rev. Lett. 82, 45 (1999)
- [14] F. Kalleicher, U. Dittmayer, R.W. Gothe, H. Putsch, T. Reichelt, B. Schoch and M. Wilhelm, Z. Phys. A 359, 201 (1997)
- [15] P. Kroll, M. Schurmann and W. Schweiger, Z. Phys. A 342, 429 (1992)
- [16] N. Isgur, G. Karl and R. Koniuk, Phys. Rev. D 25, 2394 (1982)
- [17] U. Meyer, E. Hernandez and A.J. Buchmann Phys. Rev. C 64, 035203 (2001)
- [18] S.S. Kamalov and S.N. Yang, Phys. Rev. Lett. 83, 4494 (1999)
- [19] M. Fiolhais, G. Golli and S. Sirca, Phys. Lett. B373, 229 (1996)
- [20] I.G. Aznauryan et al. [CLAS Collaboration], Phys. Rev. C 80, 055203 (2009), and references therein.
- [21] J.J. Kelly et al., Phys. Rev. C 75, 025201 (2007), and references therein.
- [22] I. G. Aznauryan et al. arXiv:1212.4891 [nucl-th]
- [23] J.J. Kelly, Phys. Rev. C 72, 048201 (2005) [Erratum-ibid. C 72, 059901 (2005)]
- [24] K. Joo et al. [CLAS Collaboration], Phys. Rev. C 70, 042201 (2004)
- [25] T. S. Lee and L. C. Smith, J. Phys. G 34, S83 (2007)
- [26] L. Alvarez-Ruso, M. B. Barbaro, T. W. Donnelly and A. Molinari, Nucl. Phys. A 724, 157 (2003)
- [27] Z. p. Li, V. Burkert and Z. j. Li, Phys. Rev. D 46, 70 (1992)
- [28] S. R. Beane and U. van Kolck, J. Phys. G 31, 921 (2005)
- [29] R. D. Matheus, F. S. Navarra, M. Nielsen, R. Rodrigues da Silva and S. H. Lee, Phys. Lett. B 578, 323 (2004)
- [30] R. L. Jaffe and F. Wilczek, Phys. Rev. Lett. 91, 232003 (2003)
- [31] D. Drechsel, S.S. Kamalov and L. Tiator, Nucl. Phys. A 645, 145 (1999); Eur. Phys. J. A 34, 69 (2007)
- [32] S. Dasu et al., Phys. Rev. D 49, 5641 (1994)
- [33] L.H. Tao et al., Z. Phys. C70, 387 (1996)
- [34] S. Alekhin, Phys. Rev. D 68, 014002 (2003)
- [35] H. Georgi and H.D. Politzer, Phys. Rev. Lett. 36 (1976) 1281; Erratum 37 (1976) 68; Phys. Rev. D 14, 1829 (1976)
- [36] A.D. Martin, R.G. Roberts, W.J. Stirling, and R.S. Thorne, Eur. Phys. J. C18, 117 (2000)
- [37] R. Barbieri, J. R. Ellis, M. K. Gaillard and G. G. Ross, Nucl. Phys. B 117, 50 (1976)
- [38] I. Schienbein et al., J. Phys. G 35, 053101 (2008)
- [39] W. Melnitchouk, R. Ent and C. Keppel, Phys. Rept. 406, 127 (2005)
- [40] The data are available at hallcweb.jlab.org/resdata.