The PHOBOS Perspective on Discoveries at RHIC
Abstract
This paper describes the conclusions that can be drawn from the data taken thus far with the PHOBOS detector at RHIC. In the most central Au+Au collisions at the highest beam energy, evidence is found for the formation of a very high energy density system whose description in terms of simple hadronic degrees of freedom is inappropriate. Furthermore, the constituents of this novel system are found to undergo a significant level of interaction. The properties of particle production at RHIC energies are shown to follow a number of simple scaling behaviors, some of which continue trends found at lower energies or in simpler systems. As a function of centrality, the total number of charged particles scales with the number of participating nucleons. When comparing Au+Au at different centralities, the dependence of the yield on the number of participants at higher (4 GeV/c) is very similar to that at low transverse momentum. The measured values of charged particle pseudorapidity density and elliptic flow were found to be independent of energy over a broad range of pseudorapidities when effectively viewed in the rest frame of one of the colliding nuclei, a property we describe as “extended longitudinal scaling”. Finally, the centrality and energy dependences of several observables were found to factorize to a surprising degree.
keywords:
PACS:
25.75.-q1 Introduction
Currently, there exists a good understanding of the basic building blocks of normal matter, and of the fundamental forces or interactions between them. The bulk of hadronic matter is comprised of partons (quarks and gluons) bound into neutrons, protons, and subsequently nuclei by the strong force mediated by the field quanta, the gluons. The fundamental interactions between these partons are described by the theory of quantum chromodynamics (QCD) [1] and are reasonably well understood. However, because of the strength and non-Abelian nature of the interactions, finding solutions to the QCD equations remains notoriously difficult. As a result, the current understanding of the phase structure of strongly interacting matter (what phases exist, what are the properties of the matter in each phase, and what is the nature of the transitions between phases) is only partly based on theoretical QCD calculations. Instead, it is driven, to a large extent, by experiment. Among many examples of the significance of the properties of QCD “matter” is the fact that more than 98% of the mass of all normal hadronic matter in the universe arises from the interactions (i.e. the gluons and the sea quarks), not from the (current) mass of the valence quarks in the hadrons [2]. This mass is generated predominantly by the lower energy interactions which are most difficult to study quantitatively. Areas of impact outside nuclear physics include the evolution of the early universe, as well as the overall properties and interior structure of compact stars and stellar remnants. Both theory and experiment suggest the existence of a very rich “condensed matter” governed by QCD.
At very short distances (hadronic sizes) the QCD coupling constant between partons is weak and decreases as the distance between the partons decreases, a phenomenon known as “asymptotic freedom” [3, 4, 5]. An expected consequence of asymptotic freedom is that a system created by heating the vacuum to high temperatures should have the properties of an almost ideal relativistic gas in which color is deconfined (first pointed out by [6] using the term “quark soup”, see also [7, 8, 9]). The high temperature of this medium entails an extremely high concentration of partons, whose thermodynamics follows the Stefan-Boltzmann law. Such a system has traditionally been designated the Quark-Gluon Plasma (QGP), a term proposed in [7]. To specifically recognize its ideal, weakly interacting nature, we use the term wQGP. The current consensus is that the whole universe was in the wQGP state at an early stage following the big bang.
At another extreme, it is known that the only stable configuration of strongly interacting matter at low temperatures and densities is the multitude of varieties of color neutral objects, namely the hadrons, as well as conglomerates of hadrons such as atomic nuclei. In addition, the QCD Lagrangian (and the wQGP solution of that Lagrangian) is understood to have a higher symmetry than the observed hadron states. The solutions of QCD at temperatures and densities which correspond to normal matter, i.e. the world of hadrons and nuclei, spontaneously break this so-called “chiral symmetry” (see, for example, [10, 11, 12]). The questions of what forms and phases of QCD matter exist between the two extremes and what symmetries, properties, and interactions characterize these phases, are currently the subject of very active theoretical and experimental research (see, for example, [13]).
On both the experimental and the theoretical fronts, there are very few tools available for the study of QCD matter as a function of density and temperature. To date, the most fruitful approach to the theoretical study of high temperature QCD has been the use of numerical calculations based on the techniques of lattice gauge theory. These calculations suggest that at low baryon densities there is a phase difference in QCD matter below and above a critical temperature 150–200 MeV or energy density 1 GeV/fm3 (see, for example, [14], which quotes a of 175 MeV and an energy density of 700 MeV/fm50%). At another extreme, theoretical progress has been made in recent years in the understanding of cold, ultra-dense, QCD matter which must be in some color superconducting state [15, 16, 17]. For example, there are indications that a dense, cold system of equal numbers of u, d and s quarks can form a “color-flavor locked” superconducting phase. This regime is currently out of range of experimentation using accelerators, but such phenomena might be manifested in the dense cores of neutron stars and, therefore, might be open to study through astronomical observation. The possible connection of QCD and neutron stars has a long history (see, for example, [18, 19]).
The most useful experimental approach in the area of high temperature QCD matter is the detailed analysis of heavy ion collisions. In fact, the suggestion of the use of heavy ion collisions to create high density states of matter predates the full development of QCD [20]. The value of 1 GeV/fm3 is not much higher than the energy density inside nucleons (500 MeV/fm3) and nuclei (150 MeV/fm3), and it is also comparable to estimates of the initial energy density created in hadronic collisions at high energy accelerators. In heavy ion collisions at relativistic velocities, there is both compression of the baryonic matter in the nuclei and also the release of a large amount of energy within a small volume from the almost simultaneous collisions of many nucleons. One or the other, or both, of these consequences of the interactions have the potential to produce new forms or phases of QCD matter. This is one of the prime reasons why in the past few decades much effort has been spent studying collisions of heavy ions at higher and higher energies. Extensive information can be found in the proceedings of the Quark Matter series of conferences [21] and in recent reviews [22, 23, 24, 25]. The conditions created may be similar to those of the early universe at about 10 sec after the big bang. Another important aspect of such studies is the extraction of valuable information about the mechanisms of particle production in small and large systems at high energies.
The most recent experimental facility for the study of heavy ion collisions is the Relativistic Heavy Ion Collider (RHIC) at Brookhaven National Laboratory. Since the inception of the physics program in July, 2000, four experiments at RHIC, namely BRAHMS, PHENIX, PHOBOS, and STAR, have studied collisions of p+p, d+Au, and Au+Au at center-of-mass collision energies per incident nucleon pair, , from 19.6 to 200 GeV. Note that, for technical reasons discussed in Appendix B.1, for d+Au was actually larger by about 0.35% but, for simplicity, this tiny difference is omitted in the text and figure labels of this document. Data from all four detectors are being studied to get a better understanding of the physics of heavy ion collisions, and, in particular, to search for evidence of the creation of new forms of QCD matter [26]. To the best of our knowledge, where there is overlap, there are no major differences in the data and extracted results obtained by the four experiments at RHIC. The level of agreement is a testament to the quality of the detectors and the analyses performed by the collaborations and is a great strength of the whole RHIC research program. This paper summarizes the most important results obtained to date by the PHOBOS collaboration and the conclusions that can be drawn from PHOBOS results, augmented where necessary by data from other experiments.
One of the most important discoveries at RHIC is the evidence that, in central Au+Au collisions at ultra-relativistic energies, an extremely high energy density system is created, whose description in terms of simple hadronic degrees of freedom is inappropriate. Furthermore, the constituents of this system experience a significant level of interaction with each other inside the medium. These conclusions are based on very general and, to a large extent, model independent arguments.
It is not claimed that the observed phenomena are unique to RHIC energies. Nor is it claimed that there is direct evidence in the data analyzed so far for color deconfinement or chiral symmetry restoration. It should be noted that interpretations of the data which invoke a high density of gluons or other non-hadronic components are certainly consistent with, and could be construed to provide at least circumstantial evidence for, deconfinement. Also, the definition of the concept of deconfinement is not so clear when the particles in the medium interact significantly. No convincing evidence has been found for the creation at RHIC of the wQGP, in contrast to the expectations of a large part of the heavy ion community in the era before the start of the RHIC physics program. This expectation may have partly resulted from a misinterpretation of the lattice results. The calculations reveal that the pressure and energy density reach 70–80% of the Stefan-Boltzmann value (i.e. the value for a non-interacting gas) for temperatures above the critical temperature (see, as one recent example, [27]). This observation was typically assumed to imply the presence of a weakly interacting system although questions were occasionally raised (for one early example, see [28]). More recently, this conclusion has been seriously challenged (see, for example, [29, 30]). As an aside, some string theory models which have been shown to be related to QCD can be solved exactly in the strong-coupling limit and yield a result comparable to 75% of the Stefan-Boltzmann value [31, 32]. This recent reversal of opinion was to a large degree driven by the experimental results from RHIC. Recent lattice QCD studies have shown that the quarks do retain a degree of correlation above the critical temperature (see, for example, [33, 34]). However, at extremely high energy density (for example, the very early universe), the theoretical expectation remains that the system will become weakly interacting [35].
Another equally interesting result from RHIC arose from the studies of the mechanism of particle production in nuclear collisions. Specifically, it has been discovered that much of the data in this new regime can be expressed in terms of simple scaling behaviors. Some of these behaviors had been noted in data at lower energies or for simpler systems. These observations suggest either the existence of strong global constraints or some kind of universality in the mechanism of the production of hadrons in high energy collisions, possibly connected to ideas of parton saturation. The data strongly suggest that the initial geometry and very early evolution of the system establish conditions which determine the final values of many observables. The most concise formulation of this discovery is the statement that the overall properties of the data appear to be much simpler than any of the models invoked to explain them. A full exploration and detailed analysis of all aspects of the data will be required for a complete understanding of the properties of QCD physics in the interesting regime probed by heavy ion collisions at relativistic velocities.
Section 2 of this paper describes the derived properties of the state formed shortly after the collisions at RHIC, Sect. 3 describes the evidence that the constituents of this state interact significantly, and Sect. 4 discusses the broad range of scaling behaviors that have been discovered.
As a useful reference, the PHOBOS detector and its properties are briefly described in Appendix A. Variables used in the description of the data, in particular those relating to event characterization, are defined in Appendix B. The precise determination of the collision impact parameter or centrality is critical to heavy ion physics in general and the PHOBOS program in particular. Appendix C describes how centrality and the biases associated with triggering and various elements of the data analysis are derived from measurements and simulations for the various colliding systems and beam energies.
2 Properties of the initial state produced at RHIC
The primary goal of the RHIC accelerator was the study of QCD matter under extreme conditions. In particular, it was expected that the center-of-mass energies more than an order of magnitude higher than achieved at the SPS accelerator at CERN would lead to the creation of a system with significantly higher energy density. An additional consequence of the higher beam energy compared to the SPS was the displacement of the projectile baryons a factor of two farther apart in rapidity. This was expected to lead to a lower baryon chemical potential in the high energy density region at midrapidity. Although progress has been made recently in lattice calculations which include the effects of a non-zero baryon chemical potential (see, for example, [27, 36, 37, 38, 39, 40, 41] and references therein), the most extensively studied system remains one with a value close to zero (see, for example, [42, 43] and references therein). Therefore, creation of a system with a lower baryon chemical potential might offer the potential for more reliable comparisons of experimental data to the fundamental QCD predictions. This section describes the conclusions that can be drawn from PHOBOS data concerning these two critical properties of the state formed in collisions of heavy ions at RHIC.
2.1 Energy density
In very high energy heavy ion interactions, the maximum energy density occurs just as the two highly Lorentz contracted nuclei collide. Clearly this system is very far from being equilibrated and, as a result, the value of the energy density, although well defined, may not be very interesting. In any reference frame, the potentially more interesting quantity is the energy density carried by particles which are closer to equilibrium conditions, i.e. those particles which have, on average, comparable longitudinal and transverse momenta. These conditions are roughly equivalent to restricting the particles to a range of pseudorapidity 1. Unfortunately, there are no direct measures of energy density and, therefore, it must be inferred from the properties of the detected particles. PHOBOS data have been used to investigate what range of initial energy densities are consistent with the observations. Studies of pseudorapidity and transverse momentum distributions, as well as elliptic flow, have been combined to constrain assumptions about the energy in the system and the time evolution of the volume from which the particles emanate.
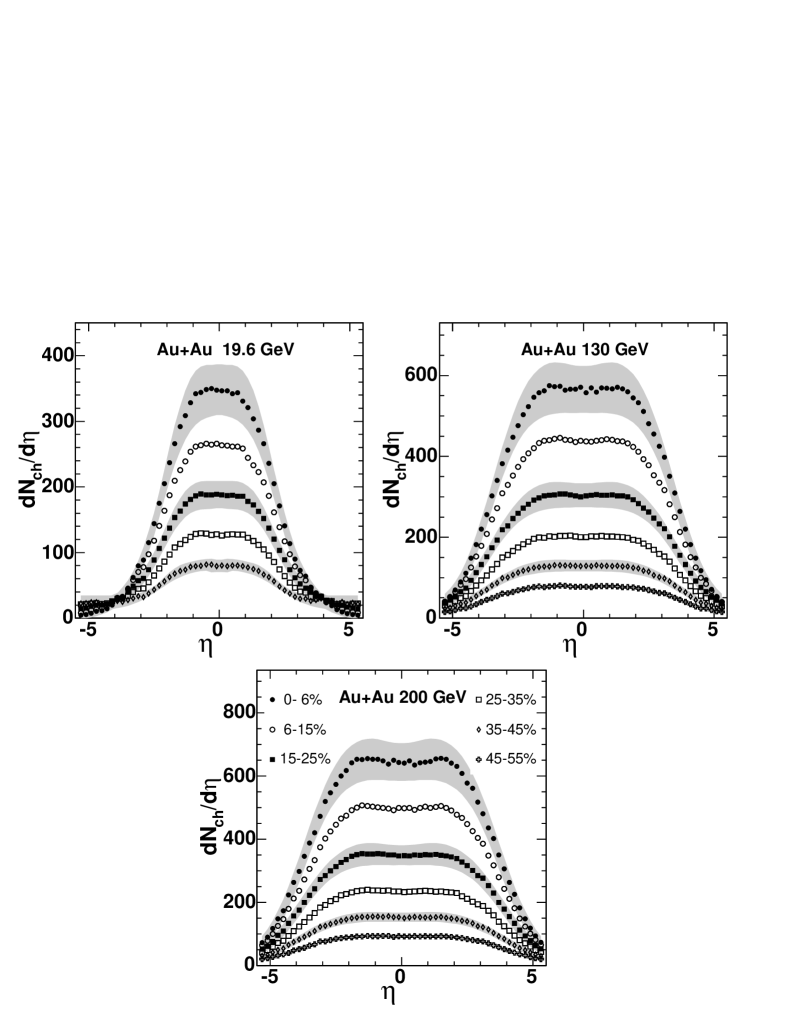
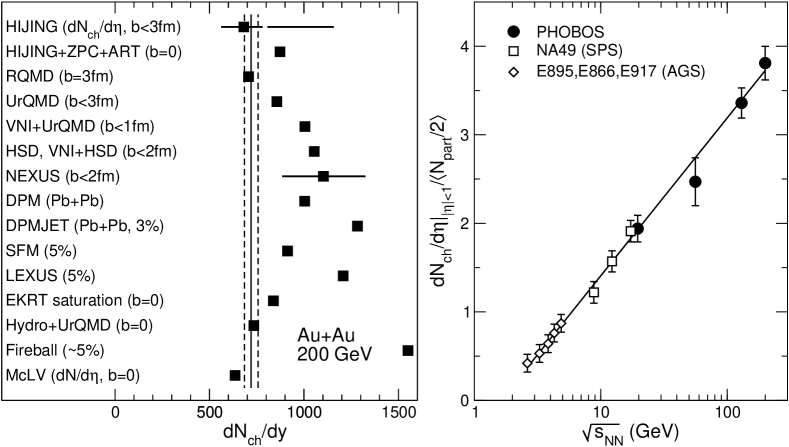
Figure 1 shows distributions of charged particle pseudorapidity densities, , for Au+Au collisions at =19.6, 130, and 200 GeV for various centralities [44]. The produced particle densities are at their maximum near midrapidity and increase with both collision energy and centrality. The right panel of Fig. 2 is a compilation of the evolution of the midrapidity charged particle density, , per participating nucleon pair, , as a function of collision energy from PHOBOS [44, 45, 46, 47, 48, 49] and lower energy heavy ion reactions at the SPS [50, 51] and AGS [52, 53, 54, 55, 56]. The PHOBOS data are for the 6% most central Au+Au interactions. For most of the SPS and AGS data, the values were obtained using sums of results for a variety of identified particles. The data follow a simple logarithmic extrapolation from lower energies as shown by the line drawn to guide the eye. The PHOBOS apparatus allows several independent techniques to be used to measure centrality and the number of particles emitted near midrapidity, all of which provide results that differ by no more than a small fraction of their separate systematic errors. The values of per participating nucleon pair, 1.940.15, 2.470.27, 3.360.17 and 3.810.19 for the 6% most central Au+Au collisions at 19.6, 56, 130, and 200 GeV, respectively, represent weighted averages of the published results. It is notable that multiplicity measurements were initially obtained by PHOBOS and later confirmed by the other experiments at every new beam energy and species provided during the first three RHIC runs, from the first Au+Au collisions [45] through the d+Au collisions [57].
It is interesting to note that the measured midrapidity charged particle density at RHIC is lower than the prediction of most models (see the left panel of Fig. 2, as well as [58, 59]. From top to bottom, the references for the models are [60, 61, 62, 63, 59, 64, 65, 66, 67, 68, 69, 70, 71, 72, 73]). The authors of [58] quoted a factor of 1.1 for converting to for comparison of data and theory. For consistency, the PHOBOS has been multiplied by the same factor to obtain the value shown in the figure.
Among the models which predicted a value close to that seen in the data were two which invoked the concept of saturation in either the initial state [73] or the produced partons [70]. Related concepts were used in more recent formulations which describe the formation of a Color Glass Condensate (CGC). This newer CGC model successfully related the pseudorapidity and energy dependences of charged particle production to the gluon structure function measured in e+p collisions [74]. It should be noted that this model also made predictions for the properties of particle production at high in d+Au collisions [75, 76] which agreed qualitatively with the pattern of hadron suppression in the d+Au data at middle to forward rapidities [77, 78, 79], but which cannot explain the excess of particle production at high for backward rapidities [80, 81]. The search for other evidence for possible parton saturation effects remains a topic of interest at RHIC but a more detailed discussion is beyond the scope of this paper.
Before attempting to make detailed estimates of the energy density, it is important to stress that the midrapidity particle density at the top RHIC energy is about a factor of two higher than the maximum value seen at the SPS [47] and there is evidence that the transverse energy per particle has not decreased [82, 83]. Thus, with little or no model dependence, it can be inferred that the energy density has increased by at least a factor of two from =17 to 200 GeV.
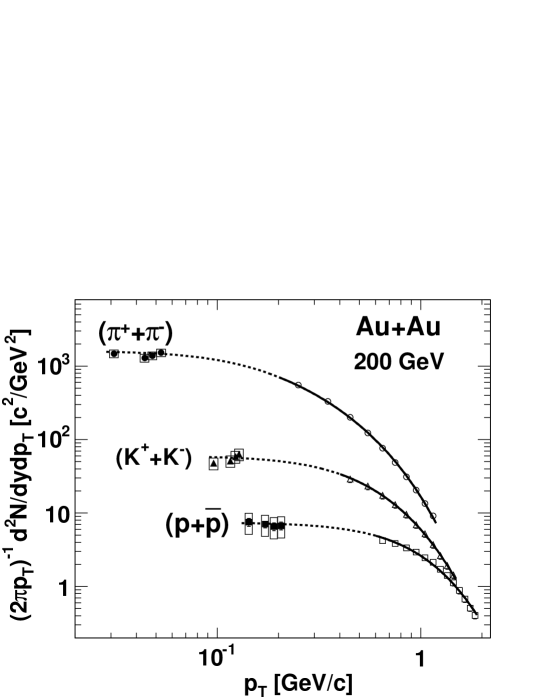
In addition to the measured particle multiplicities, estimating the energy density more precisely requires knowledge of the average energy per particle, as well as the volume from which they originate. PHOBOS data for the transverse momentum distribution of charged particles [84] can be used to find a mean transverse momentum but these data only extend down to a few hundred MeV/c. Alternatively, Fig. 3 compares identified particle yields at very low transverse momentum measured by PHOBOS [85] to PHENIX data [86] for higher momenta. Both data sets are for particles emitted near midrapidity in central Au+Au collisions at =200 GeV. The PHOBOS data clearly demonstrate that the fits shown hold over the full range of transverse momentum and that extrapolation should give a correct value for the average. The low momentum identified particle data shown in Fig. 3 are in non-overlapping regions of for the three different species. Thus, without additional assumptions it is not possible to merge them into a low charged particle value for comparison to PHOBOS spectra for charged particles at higher .
Accounting for the yields of the various particles, an average transverse momentum for all charged particles of 500 MeV/c can be derived. The value found from the PHOBOS unidentified charged particle distributions is the same to within 5%. Averaging over the pions, kaons, and nucleons, and assuming the yields for the unobserved neutral particles, an average transverse mass, , of 570 MeV/c2 can be extracted. Under the assumption of a spherically symmetric distribution in momentum space, which would have equal average transverse and longitudinal momenta, the average energy per particle is equal to the transverse mass () at midrapidity (i.e. ). Alternatively, assuming that transverse momentum is independent of pseudorapidity, the contribution due to the longitudinal momentum can be found by averaging . Over the range , this results in which is approximately 30–40% of and would, therefore, raise the average energy by about 10–15%. Since there are significant theoretical uncertainties in this and other elements of the calculation, and we are interested in a lower limit, a rounded estimate of 600 MeV per particle will be used.
The total energy in the system created near midrapidity in central Au+Au collisions at =200 GeV can be found from
where is the average energy per particle, =65535(syst) is the midrapidity charged particle density for the 6% most central collisions, fneut is a factor of 1.6 to roughly account for undetected neutral particles, and the factor of 2 integrates over 11. One further issue to consider is that there are particles with similar total momentum in the center-of-mass system but which are not traveling predominantly in the transverse direction. The correction for these additional particles, f4π, is trivially estimated from the fraction of solid angle outside – (i.e. outside ) and equals about 1.3. It should be stressed that this methodology does not suggest that the entire distribution of particles is isotropic; in fact, the data shown in Fig. 1 clearly contradict any such idea. Instead, the goal is to obtain the energy density for the component of the distribution which is consistent with isotropic emission from a source at midrapidity. Combining all of these terms, the total energy contained in all particles emitted near midrapidity, with transverse and longitudinal momenta consistent with emission from an equilibrated source, is about 1600 GeV. This is roughly 4% of the total energy of 39.4 TeV in the colliding system.
Converting this to a density in the rest frame of the system consisting of these particles requires knowledge of the volume within which this energy is contained at the earliest time of approximate equilibration. For central collisions, a transverse area equal to that of the Au nuclei (150 fm2) can be assumed, but which value to use for the longitudinal extent is not as clear. One extreme is to take the very first instant when the two Lorentz contracted nuclei overlap (longitudinal size 0.1 fm), which yields an upper limit on the energy density in excess of 100 GeV/fm3. There is, however, no reason to assume that at such an early instant the system is in any way close to equilibrium. A second commonly-used assumption is that proposed by Bjorken [87], namely a transverse size equal to the colliding nuclei and a longitudinal size of 2 fm (corresponding to a time of the order of 1 fm/c since the collision) which implies an energy density of about 5 GeV/fm3. 111The frequently-used Bjorken approximation for the energy density with the same information from the data used here would yield a value of about 4 GeV/fm3. Finally, the elliptic flow results discussed below suggest that an upper limit of the time for the system to reach approximate equilibrium is of the order of 1–2 fm/c. Using the upper range of this estimate and further conservatively assuming that the system expands during this time in both the longitudinal and transverse directions (with expansion velocities 1 and 0.6), one obtains a lower limit of the energy density produced when the system reaches approximate equilibrium at RHIC of 3 GeV/fm3. Even this very conservative estimate is about six times the energy density inside nucleons and about twenty times the energy density of nuclei. Therefore, this is a system whose description in terms of simple hadronic degrees of freedom is inappropriate.
2.2 Baryon chemical potential
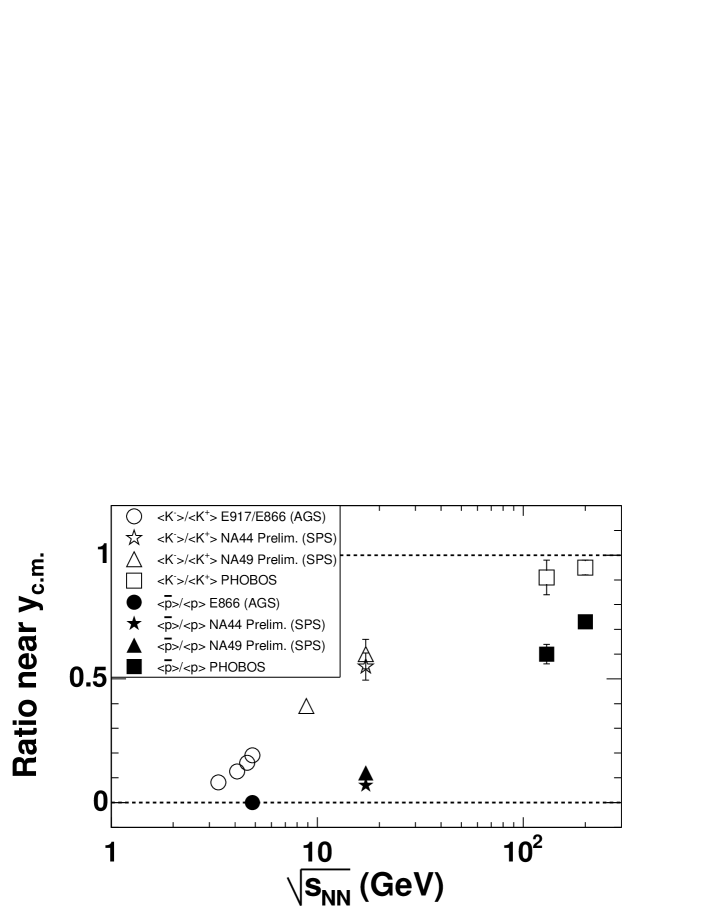
Turning to the baryon chemical potential, , early results regarding this property of the high energy density medium produced at RHIC came from the measurement of the ratios of charged antiparticles to particles near midrapidity for central collisions. In the simplest Boltzmann approximation, the ratio of antiprotons to protons is proportional to , where is the temperature at the time of chemical freezeout. Using particle yields to deduce properties of the system is a concept that long predates QCD and heavy ion collisions [88, 89, 90]. Figure 4 compares the antiparticle to particle ratios for both protons and kaons measured at RHIC by PHOBOS [91, 92] to the corresponding numbers found at lower energies [54, 93, 94, 95, 96]. Clearly, the systems formed at RHIC are much closer to having equal numbers of particles and antiparticles than was true at lower energies. The measured value of 0.730.02(stat)0.03(syst) for the antiproton to proton ratio near midrapidity for central Au+Au collisions at =200 GeV [92] indicates that these collisions are approaching a very low value of . Within the framework of thermal models, these ratios can be used to extract the baryon chemical potential [97]. Assuming a hadronization temperature of 165 MeV, a value of =27 MeV was found for central Au+Au at =200 GeV. This baryon chemical potential is an order of magnitude lower than was obtained for Pb+Pb data at =17.2 GeV from the SPS [98, 99]. Although the system created near midrapidity at RHIC cannot be described as completely free of net baryons, it is clearly approaching the environment treated in most lattice calculations.
2.2.1 Comparison of particle ratios in Au+Au and d+Au
In addition to the higher center-of-mass energies, a critical element of the design of RHIC was the ability to collide asymmetric systems. This capability was first exploited with the collision of deuterons with gold nuclei at =200 GeV. It is hoped that analysis of such simpler systems will serve as critical “control” experiments to aid in the understanding of the more complicated nucleus-nucleus data. As a first example, this section presents a study of the antiparticle to particle ratios.
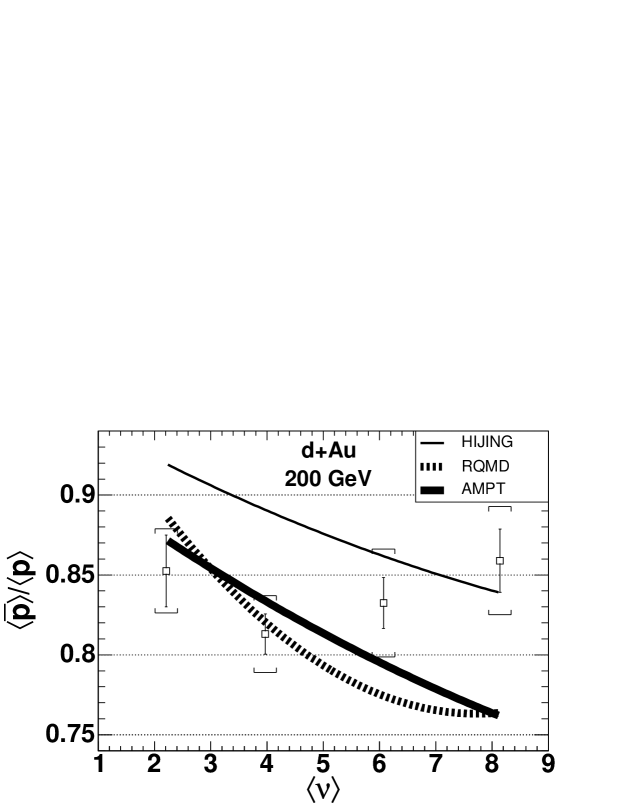
As described above, particle ratios can be used to extract information about the properties of the system, in particular the chemical potentials. The measured values of these parameters are established at the point of chemical freeze-out when inelastic interactions between the produced particles cease. However, the properties of the early evolution of the system can clearly influence final conditions. Of particular interest in this regard is the ratio of antiprotons to protons measured at midrapidity. This ratio can be interpreted as reflecting the interplay of two mechanisms, namely the transport of baryons from the two projectile nuclei to midrapidity and the production of antibaryon-baryon pairs in the interaction. By studying ratios as a function of centrality in d+Au, the effect of multiple collisions of the nucleons in the deuteron can be explored. The surprising result is shown in Fig. 5 [100].
The simple expectation, supported by various model calculations (HIJING [101], RQMD [102], and AMPT [103, 104]) was that the proportion of antiprotons near midrapidity would fall slowly with collision centrality as the deuteron participants suffered more collisions and, consequently, were effectively transported closer to the center-of-mass rapidity. In contrast, the data show a ratio which is consistent with being the same at all centralities. At present, no simple explanation or interpretation of the observed particle ratios is known.
The d+Au data at RHIC serve an important function as a control experiment since an extended volume of high density matter is presumably not formed in these collisions. Understanding the basic mechanisms of baryon transport and baryon pair production will clearly be critical to a full description of heavy ion interactions.
2.3 Nature of the transition to the high density regime
The transition to the high density state at RHIC has not been observed to create abrupt changes in any observable studied to date, including, among others, charged particle multiplicity, elliptic flow, HBT, as well as derived quantities such as energy density and freeze-out parameters. This lack of a dramatic change in character may make it more difficult to delineate the exact boundaries of the onset of significant influence from non-hadronic degrees of freedom. However, this observation may be consistent with the expectations concerning the nature of the phase transition from the most recent lattice QCD calculations [27, 36, 42, 105], which predict a rapid crossover in the region of the phase diagram believed to be relevant for the systems created near midrapidity at RHIC. It should be noted that the lack of dramatic shifts in observables does not necessarily rule out the presence of a phase transition with different characteristics (see, for example, the discussion in [24]).
It should be noted that indications of possible non-monotonic behavior in the energy evolution of some quantities were reported in the range =5–10 GeV at the CERN SPS (see, for example, [106] and references therein). The extracted properties of the environment created near midrapidity in these lower energy collisions are significantly different from those found near midrapidity at RHIC, with energy densities at least a factor of 3–4 smaller and baryon chemical potentials an order of magnitude or more larger. A discussion of these results at lower energy falls outside the scope of this paper but future work in this area might prove important to the full exploration of the QCD phase diagram.
3 Strength of interactions in the high energy density medium
In early discussions of the high density systems formed in RHIC collisions, the expectation was that a deconfined state of quarks and gluons would be weakly interacting. This interpretation arose at least partly from the naïve assumption that any matter that attained a large fraction of the Stefan-Boltzmann limit for the pressure would act like a gas [29]. One of the most dramatic early discoveries at RHIC is the clear indication that the nature of the systems formed is very far from weakly interacting. Evidence for this conclusion is found in the magnitude of elliptic flow and in the centrality dependence of particle production at high transverse momentum. The former provides information on the manner in which particle production depends on the shape of the incident system and the latter explores how the spectrum of the produced particles is impacted by the medium. Additional evidence is provided by the yields of particles at very low transverse momentum, a measurement unique to PHOBOS.
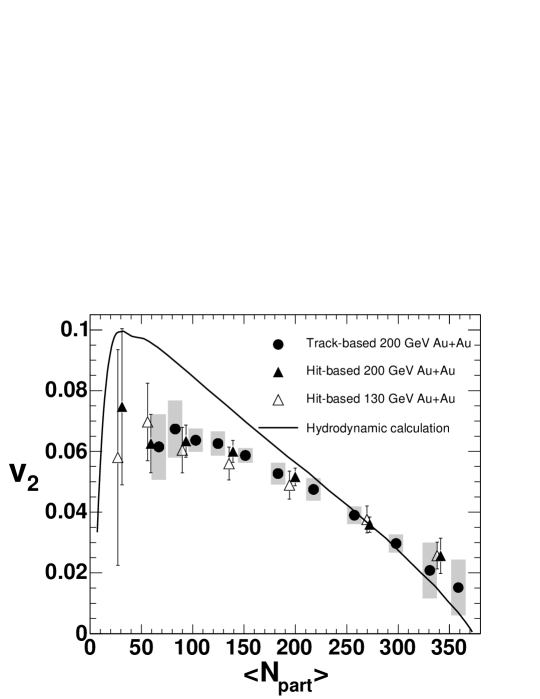
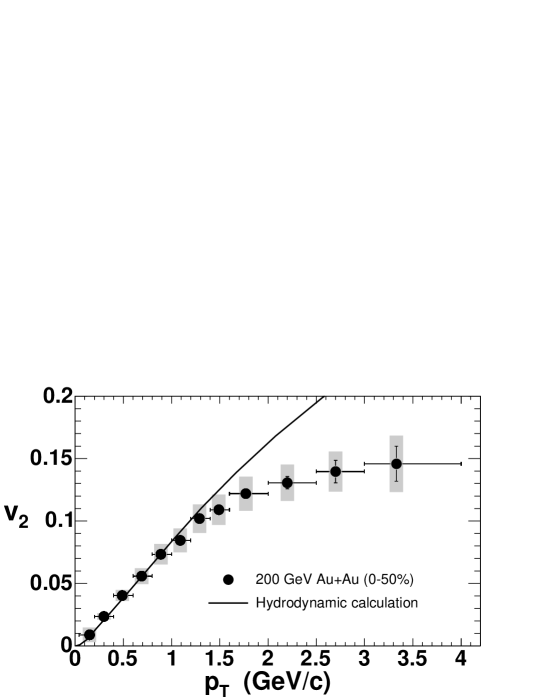
Figure 6 shows PHOBOS measurements of the magnitude of elliptic flow, , near midrapidity () in Au+Au collisions at =130 [107] and 200 GeV [108] as a function of centrality, denoted by N. Two different methods of determining the flow signal, one based on counting hits in the multiplicity detector and one based on counting tracks in the spectrometer [108], were used at the higher beam energy. Similar results were first shown for RHIC data by the STAR collaboration [109]. Figure 7 shows data from the track-based method in the rapidity interval for the 50% most central Au+Au collisions at =200 GeV as a function of transverse momentum, [108]. Data in both figures are compared to the predictions of a hydrodynamical calculation [110]. These results show that elliptic flow is unexpectedly large at RHIC energies. Over a wide range of centrality and transverse momentum, the value near midrapidity is as large as that calculated under the assumption that a boost-invariant relativistic hydrodynamic fluid was formed.
When two nuclei collide with non-zero impact parameter, the lenticular (or almond-shaped) overlap region has an azimuthal spatial asymmetry (see right panel of Fig. 35). However, if the particles do not interact after their initial production (presumably with azimuthally uniform momenta), the asymmetrical shape of the source region will have no impact on the azimuthal distribution of detected particles. Therefore, observation of azimuthal asymmetry in the outgoing particles is direct evidence of interactions between the produced particles. In addition, the interactions must have occurred at relatively early times, since expansion of the source, even if uniform, will gradually erase the magnitude of the spatial asymmetry.
Qualitatively, it is clear that an asymmetric system of interacting particles will have azimuthally varying pressure gradients which can alter the observed particle directions. Hydrodynamical models can be used to calculate a quantitative relationship between a specific initial source shape and the distribution of emitted particles (see, for example, [110]). Due to the ideal nature of the fluid assumed in these models (not to be confused with the non-interacting ideal gas), the resulting final asymmetry is generally assumed to be an upper limit for a specific starting condition. From the strength of the observed elliptic flow and from the known dimensions of the overlap region in Au+Au collisions, it can be conservatively estimated that the pressure build-up in the initially formed medium must have occurred in a time less than about 2 fm/c (with a best-fit value from flow and other data of 0.6 fm/c) [24]. Thus, the presence of a large flow signal carries several important implications, the first of which, a limit on the timescale for equilibration, has been used previously in the discussion of energy density. In addition, one can conclude that at these early times the initially produced particles must already be interacting significantly, corresponding more closely to the conditions in a fluid rather than a gas.
Additional indirect evidence that the constituents of the system produced in heavy ion collisions at RHIC are interacting significantly is provided by the observed yield of particles with very small transverse momentum (100 MeV/c) [85], shown previously in Fig. 3. Recall that the production of particles with as low as 30 MeV/c was consistent with extrapolations from a fit to the distribution in the range of a few hundred MeV/c to a few GeV/c. If, in RHIC collisions, a medium of weakly interacting particles was initially produced, one could expect an enhancement in the production of particles with wavelengths up to the overall size of the collision volume (i.e. coherent pion production) [111]. In essence, the observation that there is no such excess is another manifestation of the high pressure gradient and significant level of interaction present in the medium, which gives rise to the large magnitude of the elliptic flow signal seen at RHIC. These properties would also produce large radial flow so that any particles initially produced with low velocity would subsequently be accelerated by the interactions.
The study of the yield of particles with large transverse momentum can be used to more directly explore the level of interactions present in the medium produced in =200 GeV Au+Au collisions at RHIC. Presuming that high momentum transfer processes are induced via relatively short-range interactions, one may expect QCD factorization theorems, proven for simpler processes, to continue to hold and, therefore, a particular hard process can be induced by any binary collision in the overall nucleus-nucleus interaction [112, 113]. This is the motivation for the nuclear modification factor, , defined in Appendix B.3 and first studied at RHIC by PHENIX [114, 115], which measures how effective each particular binary collision is for inducing a hard scattering process. Strong deviations from unity indicate violations of factorization, which may be caused by initial or final state effects. In their pioneering work, the PHENIX collaboration showed that in central collisions of Au+Au at =130 GeV there was significant suppression of the yield of high transverse momentum particles compared to the p+p data scaled by the number of binary collisions, .
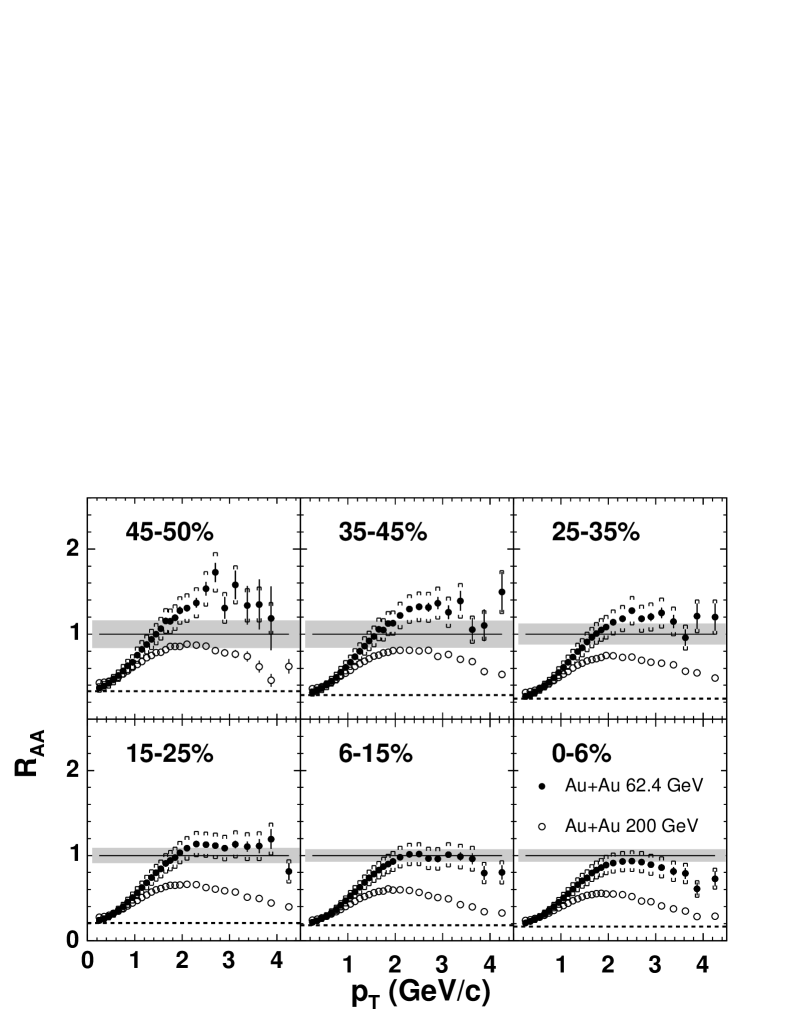
The PHOBOS collaboration has confirmed that a similar effect is present in Au+Au collisions at 200 GeV [84], and has also performed the first similar studies at =62.4 GeV [116], see Fig. 8. More importantly, as discussed later and shown in Fig. 31, the yields for Au+Au interactions at =200 GeV, which span a range of more than a factor of five in the number of participants, were found to scale with the number of participants, when compared with central Au+Au collisions, to within 25% at all transverse momenta. The fact that data up to of 4 GeV/c show much the same scaling as at low momentum clearly demonstrates that any scaling of the yield due to hard processes with the number of binary collisions is completely obliterated. Note the significant difference in the magnitudes and overall shapes of at the two energies shown in Fig. 8, as well as the fact that the difference is similar at all centralities. Additional discussion of this interesting observation, as well as other scaling properties of the data, can be found in Sect. 4.
It is important to note that, except where specifically mentioned, the reference p+p data in this and all other cases of comparison to RHIC data is for inelastic collisions. This choice is made for consistency rather than being strongly motivated by physics considerations. In most cases, the difference between the yield in non-single diffractive (NSD) and inelastic measurements is about 10% or less.
As mentioned above, the observed suppression of hard processes could result from some modification in the initial state (see, for example, [75]), as well as from interactions in the dense medium formed after the collision. To investigate this possibility, similar data were taken for d+Au collisions at the same energy. Figure 9 shows the nuclear modification factor, , measured by PHOBOS in d+Au at =200 GeV, in four different impact-parameter ranges [77] and the similar modification factor, , in central Au+Au collisions at the same energy [84]. Note the dramatic difference between the results for central d+Au and Au+Au collisions at higher transverse momentum shown in the lower right panel of the figure. For 2 GeV/c 6 GeV/c the yield of charged particles in d+Au is consistent with binary collision scaling of p+p data, whereas in Au+Au collisions the yield is clearly suppressed.
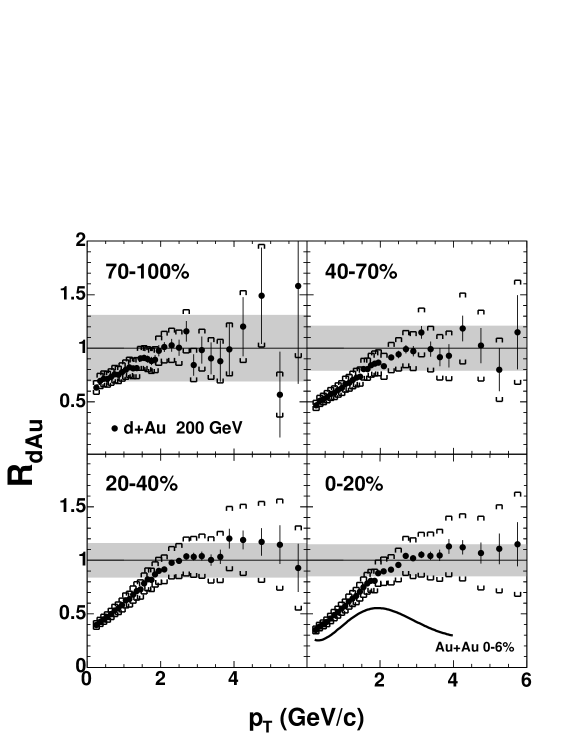
The observation that the data points at higher in Fig. 9 are similar at all centralities and all lie near unity may be evidence for binary collision scaling at higher in d+Au. However, this interpretation is unclear since the characteristics of the data may be a consequence of the interplay of an enhancement (similar to the so-called “Cronin effect” [81, 117, 118, 119, 120]), and some suppression, due to either energy loss in the final state or parton saturation effects in the initial state. Furthermore, several effects complicate the assumed connection between binary collision scaling and the magnitude and centrality independence of . First, it should be noted that the number of participants and the number of collisions do not deviate as much with centrality in d+Au as in Au+Au. Using the number of participant pairs as the scaling variable (i.e. using defined in Appendix B.3) would raise the values at all transverse momenta by an average factor of about 1.65. However, the factor would differ only by 29%, 14%, and 6% for centrality bins of 70–100%, 40–70%, and 20–40%, respectively, compared to the 0–20% data. These shifts are comparable to, or smaller than, the systematic uncertainties in the overall scale of the modification factors. Thus, the observation of similar values of at all centralities does not necessarily imply scaling with the number of collisions.
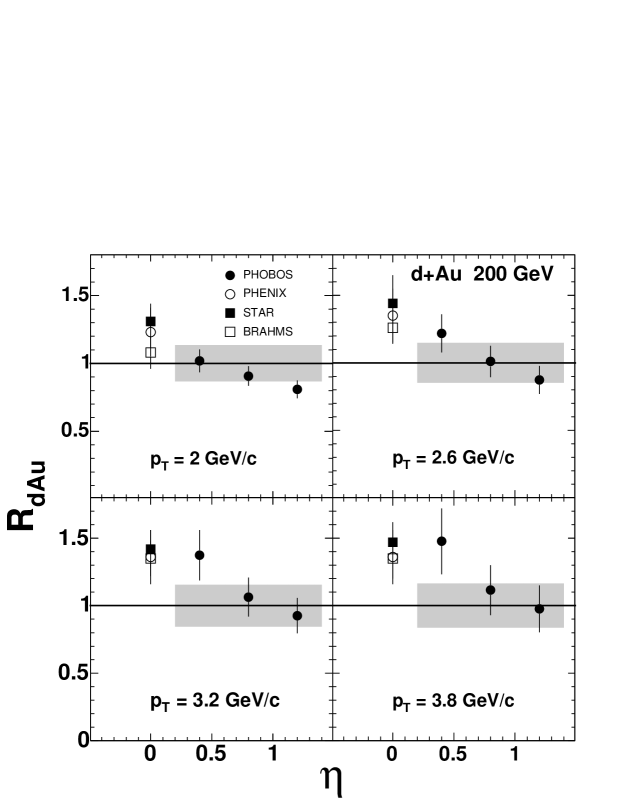
To further complicate the interpretation, the value of the nuclear modification factor was found to depend on the pseudorapidity of the emitted particles. This was first inferred from the comparison of the PHOBOS results [77] to those of the other experiments [121, 122, 123]. It can also be seen from PHOBOS results directly as shown in Fig. 10 [78]. Data from BRAHMS suggest that this trend may continue to higher positive pseudorapidity [79] while preliminary PHENIX data suggests that may even continue rising for negative pseudorapidity (i.e. towards the Au projectile rapidity) [80]. The trend seen in the PHOBOS and BRAHMS data has been interpreted as support for the CGC model, but this conclusion is far from clear and the PHENIX data at negative pseudorapidity remain even more poorly understood [81]. For this reason, the observation of the particular value of =1 at higher is a consequence of the PHOBOS acceptance and again does not necessarily imply scaling.
Therefore, the important feature is not the possible scaling of the particle yields in d+Au with times p+p yields, but instead the very significant difference between the transverse momentum dependence of the d+Au and Au+Au nuclear modification factors. The larger system appears to lead to a strong suppression while the smaller system does not. Very similar results were reported simultaneously by all four RHIC experiments [77, 121, 122, 123]. Part of the difference in the behavior of the two colliding systems may be attributed to initial state effects. However, it is difficult to avoid the conclusion that the majority of the difference in compared to results from the impact of the high energy density matter on the yield of particles with in this measured range. Clearly, the constituents of the medium produced in the central Au+Au collisions experience a significant level of interaction. Since, as discussed above, the system at this early stage cannot be primarily hadronic in nature, one can conclude that the high energy density matter created at RHIC interacts very significantly with high partons (or with whatever constituents comprise the dominant degrees of freedom at this early stage). It certainly does not appear to be a weakly interacting parton or hadron gas.
In related measurements, the STAR experiment has studied back-to-back correlations of high particles. Measuring the yield of particles as a function of the azimuthal angle relative to a very high trigger particle, a suppression was found in particles emitted on the opposite side [124]. This suppression was found to depend on the azimuthal angle of the trigger particles with respect to the reaction plane [125]. One strength of the correlation analysis is that it is essentially self-normalizing in the sense that the result does not depend on any assumptions about the scaling of the primary production of particles. One can interpret this as additional support for the conclusions that are being drawn from the single particle data.
Further evidence that the system may be both non-hadronic in nature and also characterized by a significant level of interaction comes from flow data for identified particles. PHENIX [126] and STAR [127] have measured the elliptic flow and its dependence on transverse momentum for a variety of mesons and baryons. These data appear to be consistent with an interpretation that the flow of produced particles results from the recombination of quarks which are themselves flowing [128]. The impact of this flow of quarks is that the parameter divided by the number of valence quarks scales as a function of the transverse momentum, also divided by the number of valence quarks. It should be noted that this recombination model only holds for elliptic flow at higher values of GeV/c. If this interpretation is correct, it lends support to the presumption that the system has a component of constituent quarks which experience significant interactions early in the evolution of the collision.
In conclusion, the data from RHIC collisions provide strong evidence for the creation of a very high energy density, low baryon chemical potential, medium which cannot simply be described in terms of hadrons and whose constituents experience significant interactions with each other.
4 Simple scaling behaviors of particle production
The wide range of systems and energies provided by the RHIC accelerator, combined with the unique capabilities of the PHOBOS detector, has allowed a study of the properties of particle production over a very broad range of pseudorapidity and transverse momentum for a wide variety of initial conditions. This work continues a long history of investigations to understand particle production under a variety of conditions. In the process of this study, a surprising result was discovered. It emerged that an enormous span of data for charged particles emitted in d+Au and Au+Au collisions at RHIC energies could, to a large extent, be described using only a few simple unifying features. Some of these scaling behaviors had been observed previously, either at lower energies or for less complicated systems than heavy ion collisions. Although a direct theoretical connection between these observed trends in the data and the nature of the systems created is not presently apparent, it is clear that the unifying features must reflect important aspects of the dynamics of the evolution starting from the earliest stages of the collision. In addition, these observations shed light on broader aspects of particle production under a variety of conditions. This section describes the extent to which these scaling behaviors and other unifying features apply to charged particle production at RHIC energies.
In order to achieve the broadest possible coverage in pseudorapidity and transverse momentum, most of these measurements rely on detection techniques which do not differentiate between the production of different species of particles. Therefore, it is generally not known at this time to what extent the production of any specific particle exhibits the scaling behaviors described in this section. However, the degree to which one particular species deviates from any of the observed dependencies must be compensated by the sum of all the other species, a correspondence between particle types that is interesting in itself. The occurrence of such balancing could contain important information about the global influences on the processes taking place during particle production.
In a wide variety of systems (hadron+A up to A+A), the total number of emitted charged particles is observed to have a very simple dependence on energy and centrality. In all cases, the total multiplicity appears to scale linearly with the number of participant pairs, /2. It should be noted that throughout this document the generic term “participant pairs” refers simply to the total number of participants divided by 2, i.e. a quantity that is unity in p+p, and does not imply a matched pair from the two colliding species. The total multiplicity of charged particles emitted in hadron+A (including p+A) and d+A is equal to /2 times the multiplicity observed in p+p. In contrast, for heavier nucleus-nucleus interactions, the constant of proportionality is the multiplicity produced in e++e- annihilations, which is approximately equal to that measured in p+p at twice the center-of-mass energy. This is suggestive of a universal energy dependence of charged particle multiplicities in strong interactions. Centrality, as reflected by the number of participants (both the total number and, for asymmetric systems, the number in each of the nuclei) appears to have a strong influence on the shape of the pseudorapidity distributions. In addition, the yield of high transverse momentum particles (4 GeV/c) shows a dependence on the number of participants that is surprisingly similar to that for low momentum particles when comparing Au+Au at different centralities.
Over a broad range of emission angles, the distributions of pseudorapidity density and the elliptic flow signal, when measured as a function of the variable (i.e. when shifted by and thereby effectively viewed in the approximate rest frame of one of the colliding particles), appear to be identical both in shape and magnitude at all beam energies over a large range of . The details of the shape of the distributions depend on the impact parameter, but again in an energy-independent way. In addition to this extended longitudinal scaling, no evidence is seen for a boost invariant central plateau in the pseudorapidity distributions of either particle multiplicity or elliptic flow.
Another aspect of the centrality dependence is the observation that many differences between data for Au+Au and p+p, for example in the multiplicity per participant or in the shape of the transverse momentum distributions, persist essentially unchanged over a centrality range corresponding to a number of participants that spans a factor of 5 or more. Finally, many properties of particle production exhibit separate dependences on the energy and centrality of the collisions which factorize to a surprising degree. In other words, the centrality dependence of data such as pseudorapidity density and transverse momentum spectra was found to be identical even at center-of-mass energies separated by up to an order of magnitude.
4.1 Energy dependence of total multiplicity
The most basic observable in the study of multiplicity is the total number of produced particles. Collisions at RHIC extend the center-of-mass energy range available in heavy ion interactions by more than an order of magnitude. Section 2.1 described the energy dependence of the midrapidity particle density. In this section, the total integrated particle yield is discussed. As is clearly shown in Fig. 1, the PHOBOS multiplicity detector extends over a uniquely broad range of pseudorapidity and, therefore, the extrapolation to account for missing regions of solid angle is small even at the highest RHIC energy. The total multiplicity of charged particles per participant pair in A+A collisions over a wide range of energies [44, 50, 129, 130] is shown in Fig. 11, along with data from d+Au [57], p()+p, and e++e- annihilation into hadrons (the latter two compiled from references in [131]). The d+Au value has also been divided by the number of participant pairs. The nucleus-nucleus data are for central collisions. However, this choice is inconsequential since, as will be discussed in the following section, the total multiplicity per participant pair appears to be approximately independent of centrality.
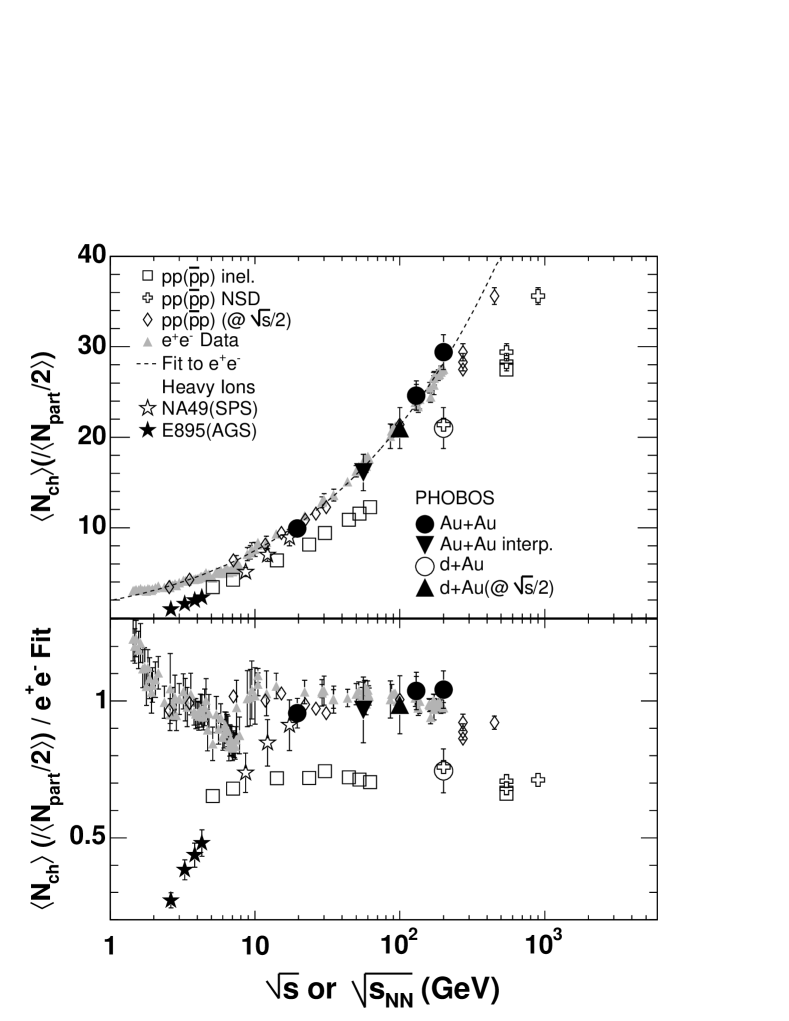
The various sets of data have very different trends. The p+p (open squares and crosses) and d+Au (open circle) data are consistently about 30% below the e++e- data, as shown in the lower panel where all of the data points are divided by a fit to the e++e- data. Starting at the lowest energies, the A+A data rise much faster than both p+p and e++e- but then the slope of the energy dependence changes and above 20–30 GeV, the A+A data follow the trend of the e++e- data. The lower panel of the figure shows that these two sets agree to within 10% over a span of an order of magnitude in center-of-mass energy.
One proposed explanation for the difference between the p+p and e++e- data is that one must properly account for the “leading particle effect” which is present in hadron-hadron collisions, but not in e++e- annihilation. The distribution of protons in (see Appendix B.2 for definition) for p+p collisions at different energies was found to be approximately flat (with a spike at =1 for elastic and diffractive events; a summary of these data can be found in [132]). One interpretation of these data is that a leading nucleon typically carries away half of the beam energy. In p+p collisions, the of the leading proton was found to directly anticorrelate with the particle multiplicity, as if the leading particle simply removed energy that would otherwise go into particle production [133, 134, 135]. By rescaling the center-of-mass energy for the p+p data by a factor of two (see open diamonds in Fig. 11), one observes that the multiplicities of p+p and e++e- reactions agree more closely over much of the energy range.
In contrast with the p+p data, which agree with the e++e- data over a large energy range only after rescaling, there is reasonable agreement of the total charged particle multiplicities between e++e- and A+A collisions over and of about 20 to 200 GeV with no rescaling. At lower energies, one sees an apparent “suppression” of the A+A multiplicity compared to both p+p and e++e-. This might be explained by reference to the substantial baryon excess found in the particle yields at these lower energies (e.g. the antiproton/proton ratio 1, see references in [92]). The relatively larger number of baryons compared to pions should tend to suppress the overall multiplicity, since the baryon chemical potential reduces the entropy. Essentially, the net baryons take up an increasing fraction of the available energy. Additionally, the overlap of the peak of the rapidity distributions of the net baryons and the produced pions [136] could result in increased pion absorption during the evolution of the system.
The arguments made here suggest that the total multiplicity per participant pair is a universal function of the available energy, irrespective of the colliding system [129]. All of the heavy ion data shown in Fig. 11 are for central collisions, but as shown in Sec. 4.2 the numbers remain constant over a broad range of impact parameter. This is a surprising result if p+p collisions are expected to be a “reference system”, while the enhanced multiplicity in A+A is related to more exotic physics. Moreover, the prediction of the energy dependence of the e++e- multiplicity is widely understood as a paradigmatic success of perturbative QCD [137], while a broader range of processes are expected to contribute in heavy ion collisions.
This interpretation of the comparison of p+p and Au+Au systems is validated by the =200 GeV d+Au results from PHOBOS [138] shown in Fig. 11 for the most central collisions. If it takes more than one collision in order for all of the energy to be available for particle production, then one would expect the participants in the deuteron to contribute approximately half the multiplicity of an e++e- collision (i.e. with effective energy of ), while the participants in the gold nucleus would contribute half a p+p collision. For a central d+Au collision, the ratio of gold to deuteron participants is approximately 8, so the “p+p-like” collisions should dominate, making the multiplicity closer to p+p, an expectation that is validated by the data.
It should be emphasized that this result applies mainly to the total multiplicity and not necessarily to other details of particle production. In other words, this argument does not imply that A+A collisions are merely scaled up e++e- annihilations. The presence of elliptic flow and strangeness enhancement, along with other observations, precludes this possibility. Furthermore, it is not argued that all observables in A+A collisions should be compared to similar data from p+p at twice the center-of-mass energy. Still, the similarities between the total charged particle multiplicities of these various systems raise the question of what are the decisive differences between the larger and smaller systems. Some insight may come from studying the role of the size and shape of the collision volume, which will be addressed in later sections.
While the physics scenario as stated is consistent with a broad range of multiplicity data, it is complicated somewhat by the recent BRAHMS result on the net baryon distribution, which is interpreted in terms of the net rapidity loss of the incoming baryons [139]. Although the measurements do not include the bulk of the net baryons, the data can constrain the shape of the distributions substantially. The BRAHMS analysis finds that the average rapidity loss of the net baryons in central Au+Au collisions at =200 GeV is 2 units [139], which is consistent with values extracted from p+A data at lower energy [140, 141]. When translated into “available” energy, i.e. the total incoming energy minus the energy of the net outgoing baryons, only about 75% of the energy is left for particle production in central A+A collisions. It should be noted that this value is a lower limit based on the assumption that the effects of longitudinal expansion can be ignored. If this reduced available energy is accounted for in the Au+Au data as was done for p+p, the resulting data points in the bottom panel of Fig. 11 would increase by about 15%. This would imply that Au+Au collisions are, in fact, able to convert the same amount of energy into a slightly larger number of particles than are produced in e++e- annihilations at the same center-of-mass energy. Given the systematic uncertainties in the various data sets, it is difficult to determine which of these interpretations is correct. Furthermore, given the current lack of understanding of the longitudinal dynamics in RHIC collisions (see Sect. 4.5), the validity of the assumption that all of the energy carried by the net baryons is “unavailable” for particle production is far from obvious. What is unambiguous is the surprisingly close correspondence of all systems despite the common assumption that somewhat different physics dominates in each case.
In summary, the data show that the systematics of the total charged-particle multiplicities are suggestive of a universal mechanism which affects “bulk” features of particle production in strongly-interacting systems. The dominant control variable in this picture appears to be the available or “effective” energy, per participant pair, which is apparently 50% of in a p+p or d+Au collision, but appears to be a significantly larger fraction of in A+A and presumably all of in e++e- reactions. This may simply be related to the fact that typical participants in an A+A collision are multiply struck when passing through the oncoming nucleus. A more complete description would involve a full explanation of the nature and origin of the outgoing baryons in both nucleon-nucleon and nucleus-nucleus collisions. All of these issues thus require a more comprehensive understanding of the early-time dynamics of the collision process, including both the dynamics of baryon-number transport and entropy production.
4.2 Centrality dependence of total multiplicity
One of the key tools for understanding particle production in high energy p+A and A+A collisions is the study of the system-size dependence, either by varying the size of the colliding nuclei or by classifying the collisions according to centrality. Variation of the collision centrality not only changes the volume of the particle production region, but also the number of binary collisions per participant (see Appendix B.3 for more discussion of this topic). In addition to changing the collision energy, varying centrality therefore provides another handle, in principle, for changing the balance of particle production between ‘soft’ low-momentum processes and point-like ‘hard’ processes with large momentum transfer.
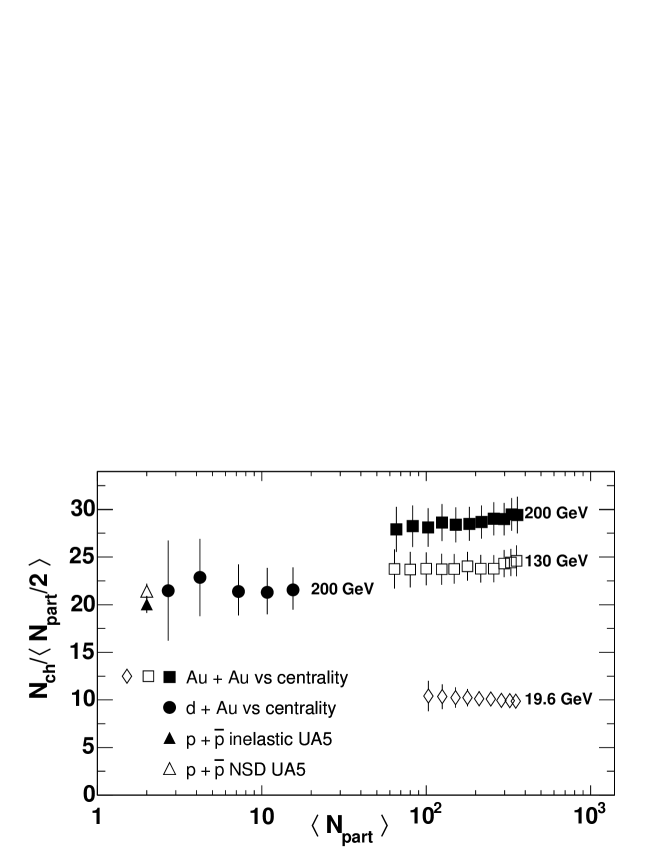
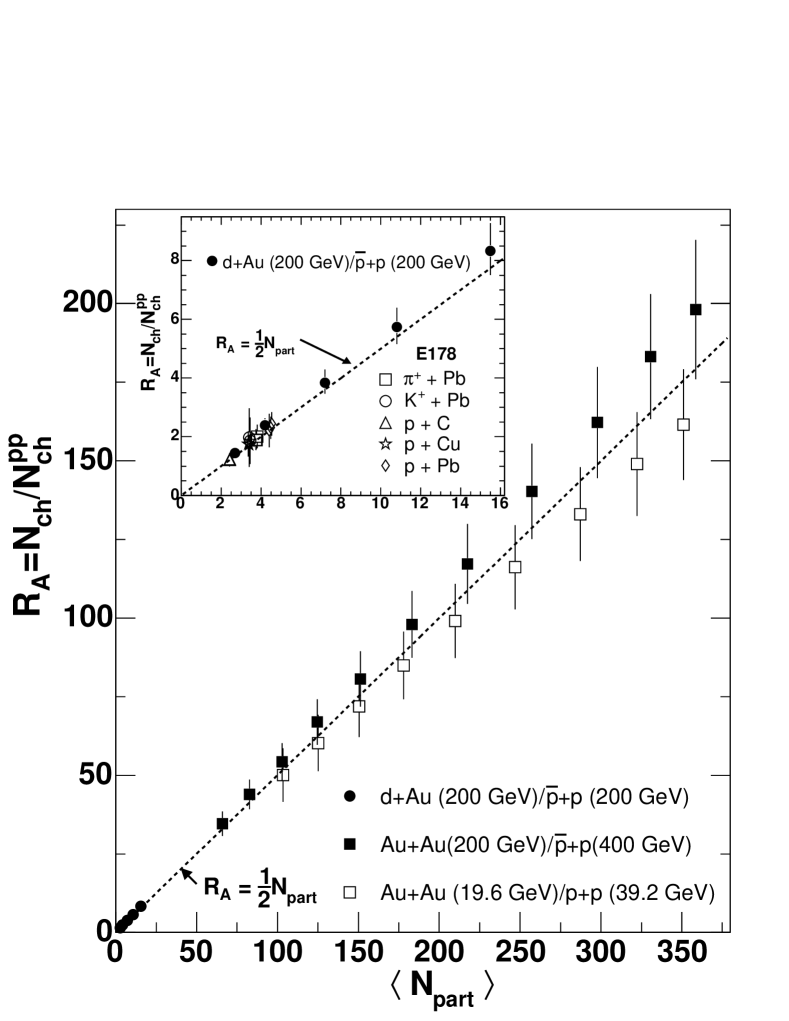
One of the more striking features of total particle production in Au+Au collisions at RHIC is the proportionality of the total charged-particle multiplicity to the number of participant pairs [129], as shown in Fig. 12 and compared to +p [142] and d+Au collisions [138]. The figure also shows that the total charged particle multiplicity is proportional to the number of participating nucleons in Au+Au collisions at all three energies from =19.6 to 200 GeV. The data suggest that the transition between p+p collisions and Au+Au is probably not controlled simply by the number of participants, as even very central d+Au collisions do not show any sign of trending up towards the level of the Au+Au data. As discussed in the preceding section, this aspect of the total multiplicity is expected in the “available energy” ansatz, since the Au participants, which dominate the total number of participants in d+Au, are expected to be more “p+p-like”.
This topic represents one area where data for collisions of lighter nuclei at RHIC could make an important contribution. Extrapolation of Au+Au analysis to very peripheral collisions inevitably suffers from considerable systematic uncertainty in the number of participants. Lessons learned from analysis of lower energies and smaller systems such as d+Au are currently being applied in an attempt to reduce those uncertainties. However, it is clear that data from lighter systems, currently being collected in Run V at RHIC, will provide vital input to the interpretation of these results.
Further information about the centrality dependence is shown in Fig. 13, the inset of which shows a detailed comparison of the PHOBOS d+Au results at =200 GeV [138] with +A, K+A, and p+A for 10–20 GeV [143]. In all cases in the inset, the total charged particle multiplicity in hadron-nucleus collisions is divided by the p+p multiplicity at the same collision energy. Within the experimental uncertainty, the ratios all fall on the indicated line, demonstrating that the total charged particle multiplicity scales with the number of participant pairs times the data for p+p at the same energy for all hadron-nucleus systems, as was first recognized in earlier work [144, 145]. This feature of the data led to the “wounded nucleon” model of Białas, Bleszyński and Czyż [146]. The range in over which this scaling is shown to apply is extended significantly by the PHOBOS charged particle multiplicity in d+Au collisions versus centrality.
A similar analysis of Au+Au data for collisions at =19.6 GeV and 200 GeV is shown in the main part of Fig. 13 [138]. As for the hadron-nucleus data, the points fall along the line, exhibiting scaling of the total multiplicity with the number of participant pairs, but in this case multiplied by p()+p data at twice the center-of-mass energy [142, 147, 148, 149]. A particularly striking feature, as discussed in Section 4.1, is the fact that, for all these systems and energies, the total number of charged particles is directly given by the number of participant pairs times the number seen in p+p after accounting correctly for the energy carried away by the leading baryon.
This continuation of the previously-observed approximate scaling, which is now seen to apply to all systems and over an expanded range of energies from below 10 GeV to the highest at RHIC, represents one of the more surprising features of particle production at RHIC.

4.3 Centrality dependence of pseudorapidity distributions
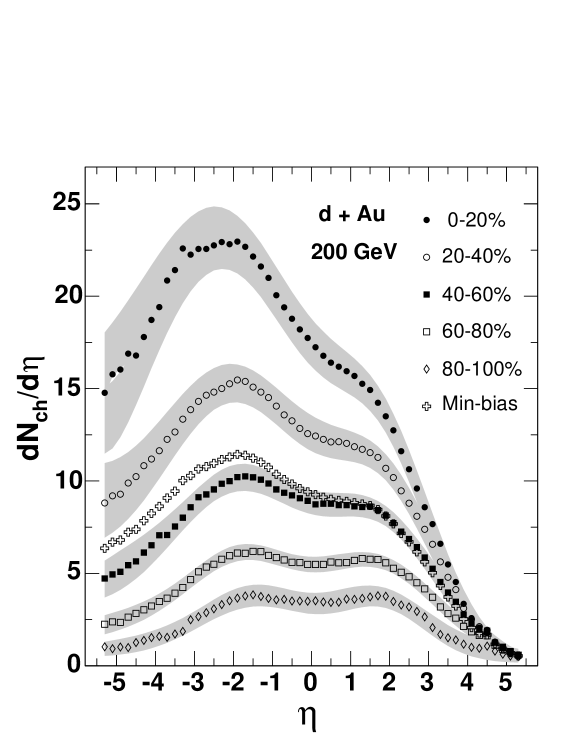
It should be stressed that the universal scaling of the total number of particles produced in Au+Au collisions does not result from rapidity distributions whose shape is independent of centrality, or . The rapidity distributions do depend on both centrality and on the nature of the colliding systems, as is evident from Fig. 14 for Au+Au [44] and Figs. 15 and 16 for d+Au [138]. However, the dependence of the shape on centrality, as first reported in [150], is very specific.
The Au+Au pseudorapidity distributions shown in Fig. 14 appear to exhibit a sort of incompressibility in rapidity space. Thus, a reduction in the number of particles at midrapidity is balanced by a similar increase of the number of particles at high rapidities, with the total number remaining constant. Obviously, moving particles around in rapidity changes the total longitudinal energy in the system. If the total energy available for produced particles depends only on the number of participants, energy must be conserved by changes in the distribution of transverse momentum.
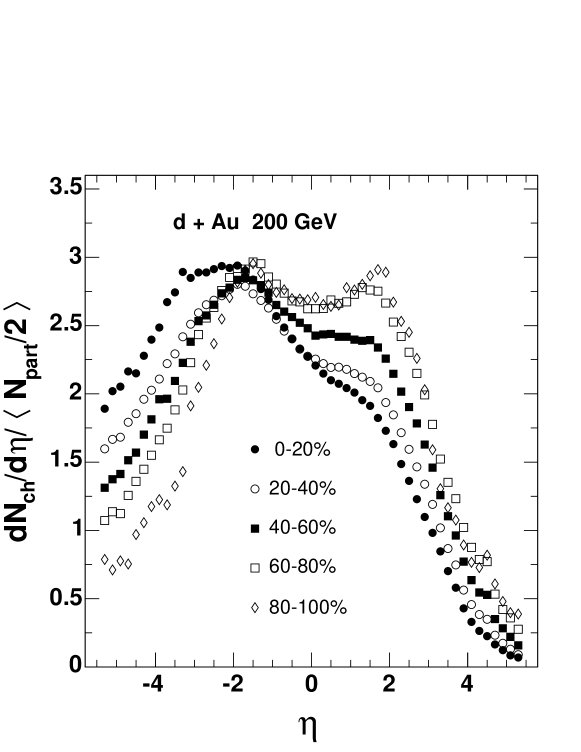
The centrality dependence of pseudorapidity distributions in asymmetric systems can be studied using PHOBOS data for d+Au collisions as shown in Figs. 15 and 16 [57, 138]. With increasing centrality, an increase in particle production (see Fig. 15) and a significant change in shape of the distributions (see Fig. 16) is observed. It should be stressed that the appearance of a “double-hump” structure in the d+Au distributions is primarily due to the effect of the Jacobian associated with the transformation to from (see related discussion in Section 4.5.3). Although the shape changes in a non-trivial way, the integral of these distributions, when extrapolated to full solid angle, is found to be proportional to the number of participating nucleons, as was shown for many systems and energies in Section 4.2.
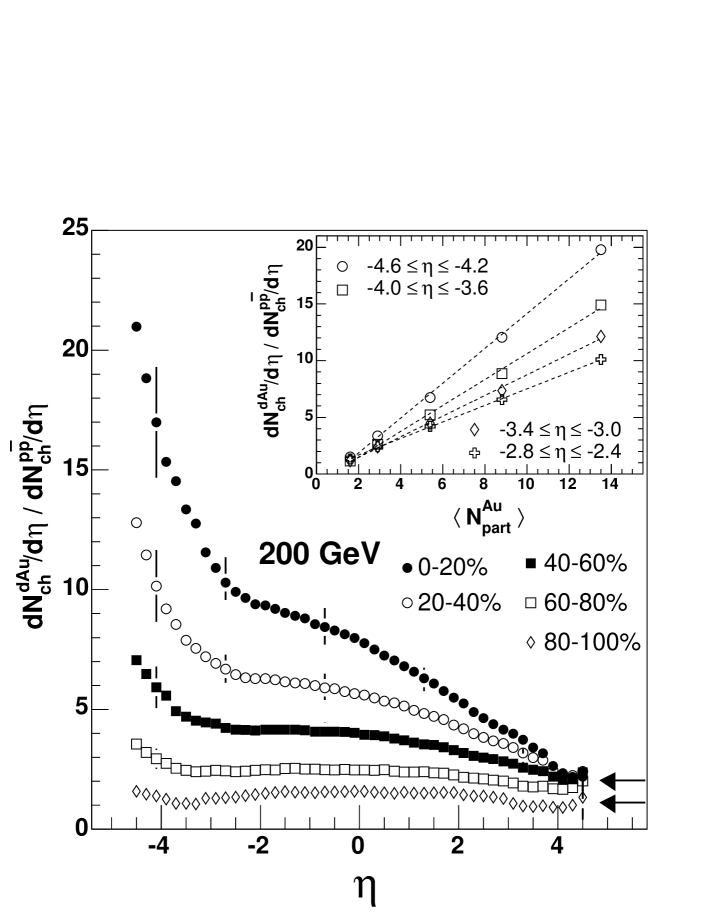
The comparison of total particle multiplicity in d+Au and p+p can be extended by studying the ratio (d+Au)/(p+p) as a function of pseudorapidity, as shown in Fig. 17 [138, 142]. The main panel of the figure shows this ratio for various d+Au centralities, as a function of pseudorapidity. The inset and the arrows at the lower right demonstrate that, as was seen in p+A at lower energy [143, 145, 151, 152, 153], the data are consistent with a picture in which the density of produced particles which have a rapidity in the vicinity of the incident deuteron (gold) is proportional to the number of deuteron (gold) participants. The data suggest that the overall rapidity distribution, not just the integral of the distribution, is strongly influenced by the collision geometry.
In light of the discussion of particle production as a function of available energy in Sect. 4.1, one might initially expect the ratio at positive rapidity in Fig. 17 to increase faster than the number of deuteron participants. This is because each deuteron participant interacts with multiple Au participants and is therefore “Au+Au-like”, while each Au participant suffers far fewer collisions and is therefore “p+p-like”. Recall that the normalized multiplicity per participant pair in Au+Au collisions was higher than that in p+p collisions at the same center-of-mass energy. However, it is important to keep in mind that the detailed shape of the distribution, not just the relative height at the two ends, is a complicated function of centrality. For example, it has long been known that in p+A collisions, the yield of all particles with rapidity within a unit or so of that of the proton falls with increasing target mass [154]. Thus, one should not expect conclusions from integrated yields to apply simply to narrow fixed regions of pseudorapidity.
The longitudinal properties of particle production, and in particular the dependence on center-of-mass energy, are discussed in more detail in Sect. 4.5.
4.4 Comparison of Au+Au and other systems
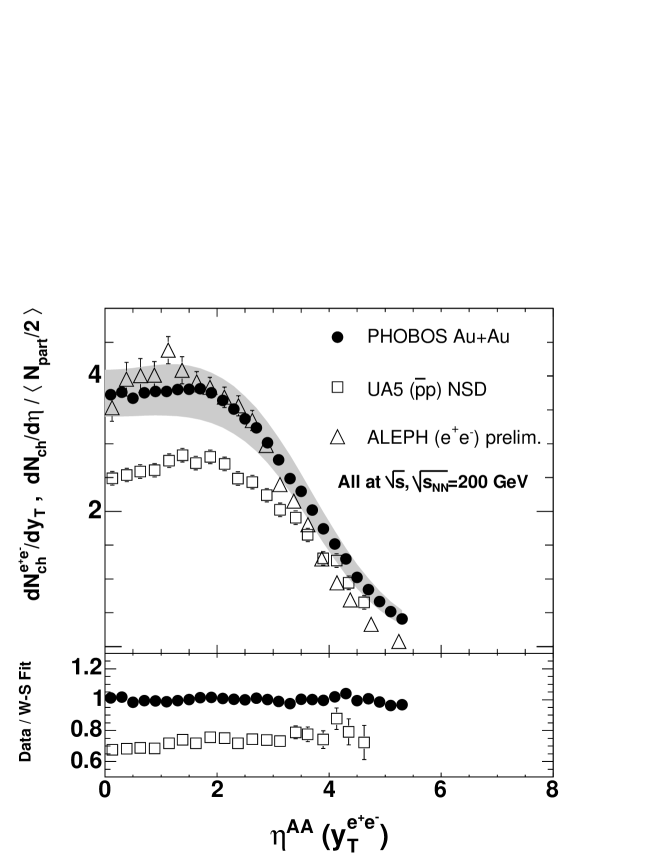
Figure 11 showed that the total charged particle multiplicities in the e++e- and A+A systems are very similar at a given center-of-mass energy, while those for p+p are somewhat smaller. To expand the comparison of these three very different systems, it is interesting to consider the full distributions in pseudorapidity. However, this study is complicated by the fact that the shapes of the Au+Au data vary dramatically with centrality (as is most clearly evident in Fig. 14). Figure 18 compares normalized by the number of participant pairs for the 3% most central Au+Au collisions [44] to inelastic data for +p [155] and the distribution of (see definition in Appendix B.2) in the e++e- data [156], all at a or of 200 GeV [129]. The bottom panel of the figure demonstrates that the lower total multiplicity seen in +p results from a pseudorapidity distribution that is suppressed by roughly a constant factor over all emission angles. The figure shows agreement in the overall rapidity distribution between A+A and e++e-. In comparing the two distributions, one should keep in mind the centrality dependence in the shape for Au+Au, as well as the difference between and . Studies using JETSET [157] show that, for this data, the extracted is about 10% larger than for 0 and about 10% smaller than for 4.
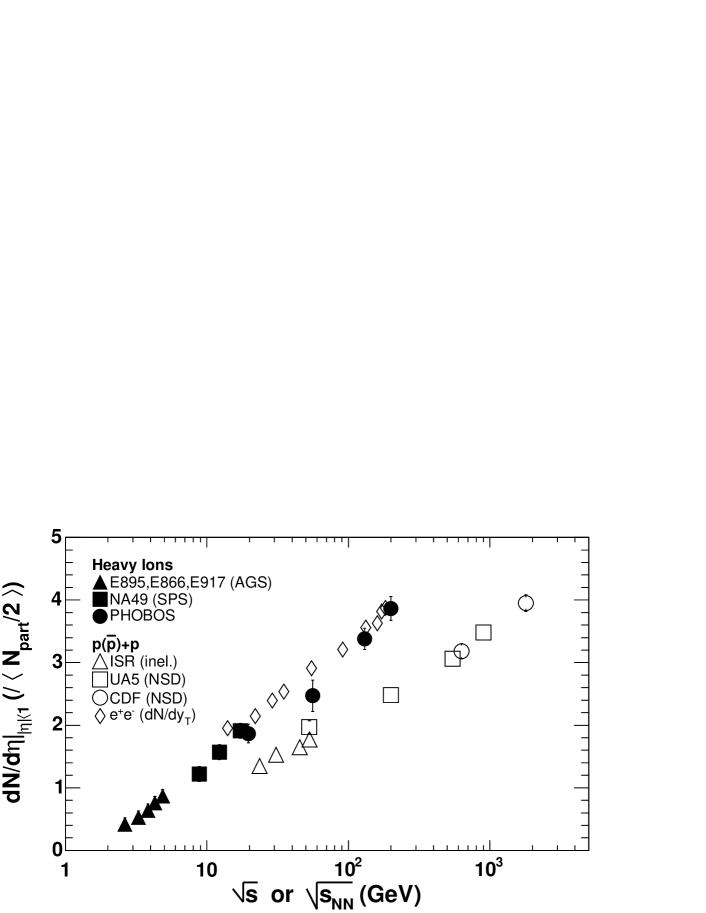
The similarity of the integrated multiplicity, as well as the shapes of the pseudorapidity distributions, for e++e- and the most central Au+Au data suggests that there should be a similarity in the evolution of the midrapidity density with collision energy, an expectation that is verified by the data. Figure 19 shows midrapidity particle density data from central heavy ion collisions [44, 45, 46, 47, 48, 49, 50, 51, 52, 53, 54, 55, 56] and from elementary collisions compiled from references in [131]. This additional close correspondence between the properties of central Au+Au and e++e- multiplicity data suggests that the agreement results from some underlying feature of particle production, as opposed to being an accidental coincidence. In particular, an understanding of why the shape of the pseudorapidity distribution for Au+Au collisions approaches that of e++e- for more central interactions might prove particularly enlightening.
The arguments presented in Sect. 4.1 concerning total charged particle multiplicities should not be interpreted to imply that all observables in A+A will match those in p+p at a factor of two higher . The midrapidity particle densities provide an instructive counterexample. Since the same total number of particles in p+p at a higher are distributed over a broader range of pseudorapidity (see, for example, the top panel of Fig. 21), a factor of two shift in the p+p center-of-mass energy obviously cannot result in midrapidity densities equal to those measured in A+A. An examination of Fig. 19 reveals that the data confirm this expectation.
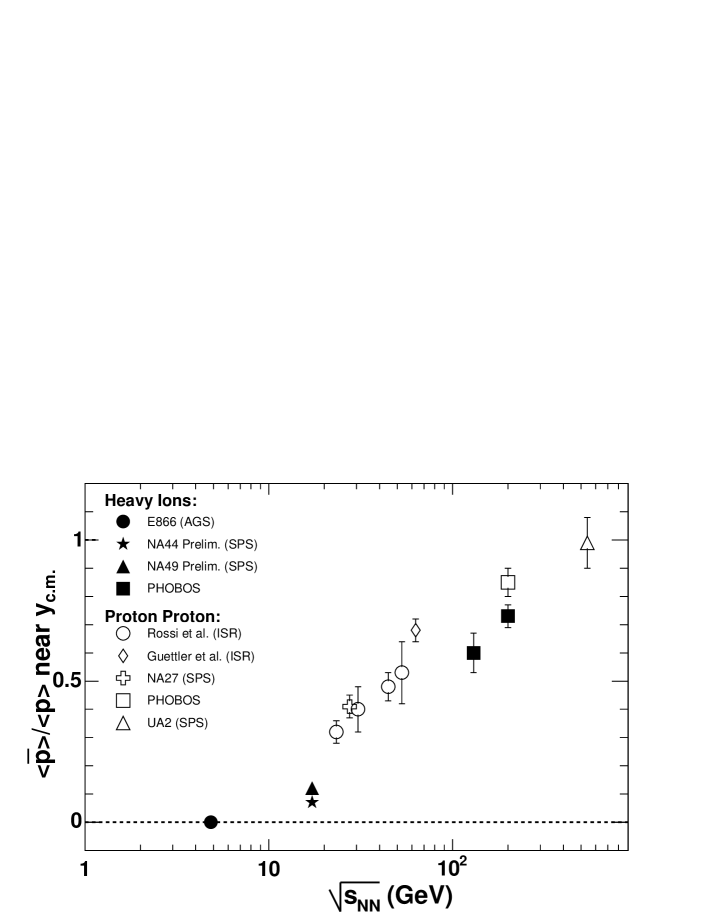
A less trivial counterexample is illustrated in Fig. 20 which shows ratios of the yields of antiprotons over protons emitted near midrapidity in p()+p, as measured by PHOBOS at RHIC [158] and experiments at other energies [159, 160, 161, 162], and in A+A collisions [54, 91, 92, 93, 94, 95, 96] as a function of . The ratios for d+Au at =200 GeV [100] (discussed in Sect. 2.2.1 and shown in Fig. 5) are consistent with the value shown on the figure for p+p. As discussed in Section 2.2, the relevant physics for understanding this ratio involves the interplay of baryon transport and antibaryon-baryon pair creation. In this case, in contrast to the situation for particle multiplicities, it is clear that the ratios for the nucleus-nucleus data are comparable to those in nucleon-nucleon collisions at significantly lower center-of-mass energies. Although this result may not be unexpected given the larger baryon rapidity loss in A+A as compared to p+p, it serves to illustrate the importance of a systematic study to unravel the dynamical differences between the simpler and more complicated systems.
Finally, the extraction of nuclear modification factors, , requires the explicit use of a p+p reference spectrum. The conventional choice is to use minimum bias data from inelastic interactions of p+p at the same collision energy, and all of the PHOBOS analyses have adhered to this standard. On the other hand, it was shown in Fig. 19 of this section and Fig. 11 of Sect. 4.1 that the charged particle multiplicity per participant (both at midrapidity and integrated over all solid angle) is larger in A+A than in p+p at the same energy. At values of 200 GeV and above, it is known that the spectra in p+p events with higher than average total multiplicity fall off less steeply than those for minimum bias events [163, 164, 165]. It should be stressed that we do not claim that an alternative p+p reference spectra is in any way inherently more appropriate. However, since the physics that determines the shapes of the transverse momentum spectra in p+p and A+A is not fully understood, such an alternative comparison could prove instructive. Therefore, one should keep these ambiguities in mind when interpreting data for the -factors, particularly the specific value of the factors at large transverse momentum.
It should be noted that, although the relative yield at low and high changes with multiplicity in p+p collisions, there is evidence that the change in shape is relatively small above 2 GeV/c [165]. In addition, the question of what p+p reference spectrum to use does not affect modification factors such as which directly compare A+A at different centralities. Therefore, any possible ambiguities in nuclear modification factors due to the variation of the distribution with multiplicity in p+p do not significantly impact any of the conclusions presented in this paper.
Of course, for very peripheral A+A collisions, all observables must evolve to match those in p+p (or, to be exact, the appropriate mix of p+p, p+n, n+p, and n+n) collisions at the same . The current PHOBOS analysis of Au+Au collisions typically spans a range of impact parameters corresponding to a variation in the average number of participants in each centrality bin of more than a factor of 5–6, i.e. from roughly 60 up to 350 or more. One remarkable aspect of this broad data set is that, over this range, the total particle multiplicity deviates very little from its central value when suitably normalized by the number of participants (see Fig. 12). The normalized pseudorapidity density near midrapidity does vary and is tending towards the p+p value but is still far above it for the most peripheral collisions studied to date (see discussion in Sect. 4.6). The shape and magnitude of the transverse momentum distributions also vary but only slightly and they show little sign of tending towards the p+p distribution (see Fig. 8). One can speculate that these deviations between peripheral Au+Au and p+p collisions might result from the fact that the number of collisions per participant (or the fraction of the participants that are multiply struck) rises extremely rapidly with decreasing impact parameter for these most grazing collisions (See Appendix B.1 and Fig. 36).
In summary, comparisons of data for A+A and more elementary systems reveal an intriguing array of similarities and differences. Clearly, it is not possible to describe A+A collisions as trivial combinations of any other simpler systems. Rather than assuming that a single data set, such as p+p data at the same , can serve as an ideal “reference” set for interpreting the complete dynamics of A+A interactions, the properties of a variety of systems should be studied over a range of energies and centralities to elucidate the similarities and differences among them. Such a study will lead to a more complete understanding of the salient features of the underlying physics, especially how the characteristics of the exciting regime of high energy density created in central Au+Au collisions at RHIC energies relate to those for other types of interactions.
4.5 Extended longitudinal scaling
This section describes several features of the pseudorapidity dependence of observables in a variety of systems. In particular, the distributions of particle yield and elliptic flow are found to be largely independent of center-of-mass energy over a broad region of pseudorapidity when shifted by and thereby effectively viewed in the rest frame of one of the colliding particles. In addition, no evidence is found for a broad region near midrapidity displaying the characteristic constant value of observables expected for a boost-invariant scenario.
4.5.1 Longitudinal dependence of particle production: Elementary systems
Before considering the energy dependence of pseudorapidity distributions in heavy ion collisions, it is instructive to review the extensive literature devoted to interpretations of, and expectations for, such distributions in simpler systems. A very general picture of elementary hadron-hadron collisions emerged in the late 1960’s, consisting of two sources of particle production. This concept led to the prediction of two types of scaling laws for the distributions of final state particles in the regions of the longitudinal momentum space which are either near to or far from the colliding partners.
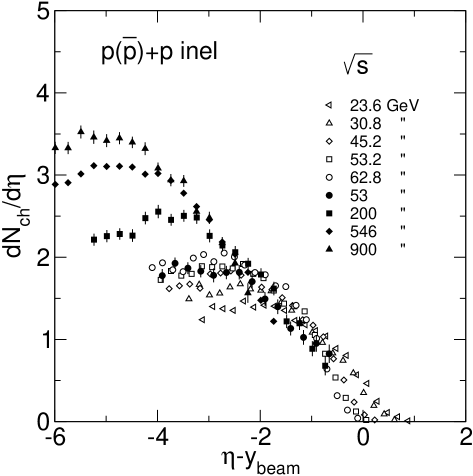
Particles near beam and target rapidity were thought to be governed by the “limiting fragmentation hypothesis” [166]. In this model, the momentum distribution of particles of species “i” in the rest frame of one of the original colliding hadrons (commonly denoted with a prime to distinguish it from the center-of-mass frame), , or equivalently , becomes energy-independent at high enough collision energy. The central concept is that the “projectile” hadron, when seen in the frame of the “target”, is Lorentz-contracted into a very narrow strongly-interacting pancake which passes through the target. This interaction leaves behind a complicated excited state whose properties do not depend in detail on the energy or even identity of the projectile, and which then “fragments” into a final state distribution of particles, . It was generally assumed that this process produced particles primarily in a restricted window of rapidity around =0, possibly even leading to a complete lack of particles at midrapidity in a very high energy hadron-hadron collision [167].
In contrast, particles near midrapidity in the center-of-mass frame were expected to form a rapidity plateau with a constant , independent of energy and the nature of the hadrons in the initial collision [168, 169]. Similarly, in heavy ion collisions, a boost-invariant central plateau where “the initial conditions …are invariant with respect to [longitudinal] Lorentz transformations” (i.e. observables are independent of ) was predicted [87]. Furthermore, the extent of this boost-invariant region was expected to grow with energy.
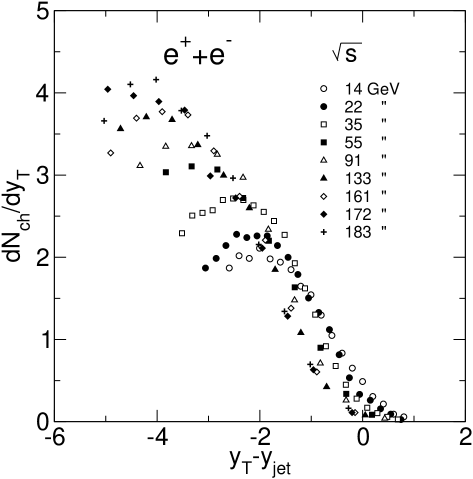
For elementary collisions such as p+p, and even e++e-, this general picture failed completely. Instead, the extended longitudinal scaling, seen in the form of scaling, pointed the way to the current view in terms of QCD, modeled for instance in the widely used Pythia code [170]. This formulation generalized the concept of “fragmentation”, which “describes the way the creation of new quark-antiquark pairs can break up a high-mass system into lower-mass ones, ultimately hadrons” [171]. It should be noted that energy independence, or scaling, in (i.e. full “limiting fragmentation”) implies scaling of both and .
Figure 21 shows for p()+p collisions [155, 172] and -yjet) for e++e- collisions [173] (see Appendix B.2 for definitions). Lorentz boosts of pseudorapidity, , are not as trivial as those of rapidity, but (or ) approximates . Furthermore, as noted above, the limiting fragmentation concept implies scaling in the full distribution, . Since is just a function of (, , ), scaling in is also implied directly. For these elementary systems, instead of a growing boost-invariant plateau, an extended version of limiting fragmentation is found, which leads to longitudinal scaling (energy independence) over more than four units of rapidity, extending nearly to midrapidity. The entire system can be described in terms of either string “fragmentation” or in terms of a parton cascade, leading naturally to extended longitudinal scaling.
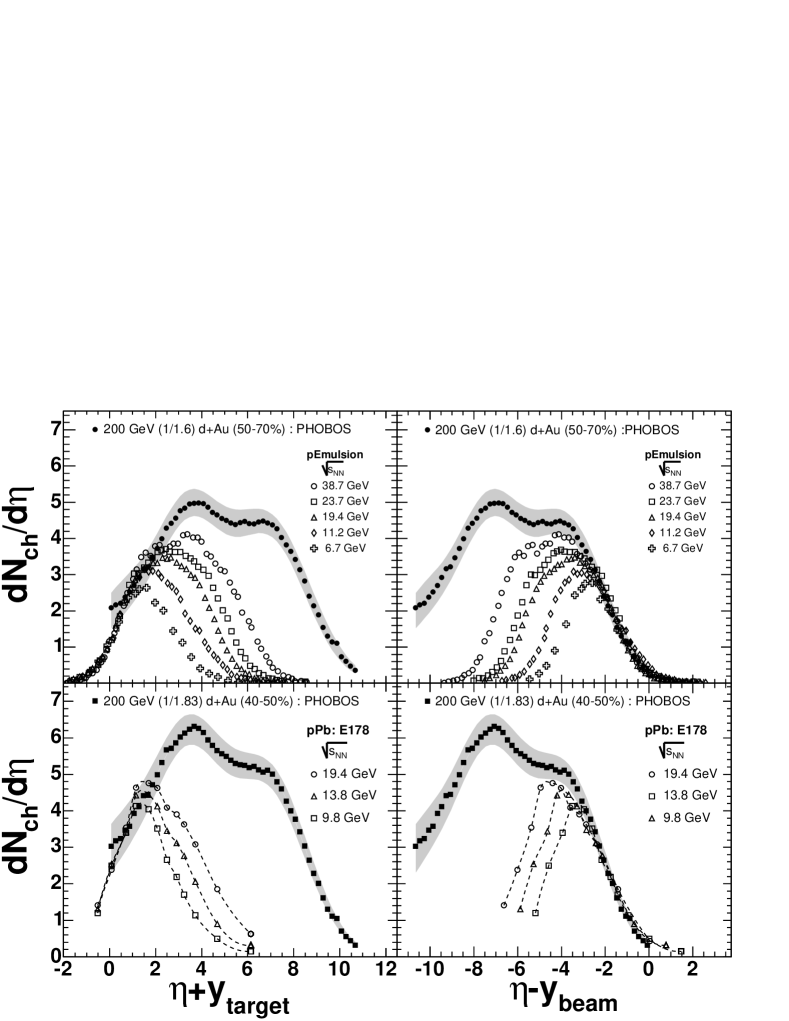
4.5.2 Longitudinal dependence of particle production: d+A and p+A
In the case of asymmetric systems, the concept of extended longitudinal scaling can be explored separately in the rest frame of the two projectiles. Such studies, applied to hadron-nucleus collisions, were of particular interest in the 1970’s [145]. The specific question was whether the region of rapidity in which the particle yield is A-dependent expands with increasing collision energy [174, 175, 176]. Many models predicted that an extended A-dependent region, indicative of long-range order, should not occur. Instead, only a localized region near the rapidity of the larger collision partner would be affected by the target mass, and further, the height and width of this region was expected to be independent of, or at most weakly dependent on, beam energy. One prediction of these expectations was that the integrated yield in p+A would approach the value observed in p+p at high beam energies, since the small A-dependent region would become increasingly unimportant [177]. Instead, to the surprise of many people, a broad A-dependent region was observed, displaying characteristics very similar to the extended longitudinal scaling observed in simpler systems [141, 143, 151, 153, 178, 179].
Pseudorapidity distributions from PHOBOS can be used to extend these studies to d+A collisions at RHIC energies. In Fig. 22, a compilation of pseudorapidity density data for proton+(nuclear emulsion) [178, 179] and p+Pb [143] at various energies is shown, together with PHOBOS data for d+Au at =200 GeV [138], with the centrality and normalization for the d+Au results chosen appropriately. To be more specific, the d+Au pseudorapidity densities are divided by the number of participating nucleons in the deuteron (by definition this would be unity for p+A). Furthermore, the d+Au centrality bin was selected such that the ratio of the number of participating nucleons in the Au nucleus to the number in the deuteron was equal to the number of participating nucleons from the lead or emulsion in p+A. This latter quantity is commonly denoted , the average number of collisions per participant in the smaller projectile (see definitions in Appendix B.1). Fig. 22 clearly demonstrates that extended longitudinal scaling also is manifested in d+A collisions at RHIC energies.
4.5.3 Longitudinal dependence of particle production: Au+Au at RHIC
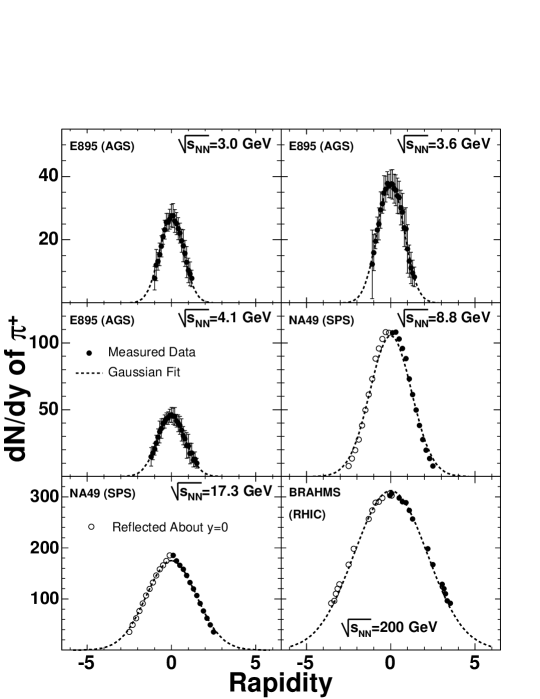
The uniquely broad pseudorapidity coverage of the PHOBOS detector allows similar studies to be performed for heavy ion collisions at RHIC energies. At first the pseudorapidity distributions themselves, shown in Fig. 1, suggest that may develop a small boost-invariant central plateau, but these plots are misleading for this purpose. Pseudorapidity is known to distort the rapidity distribution for production angles near and . Demonstrating this point, the rapidity distributions of positive pions measured by BRAHMS [180], as well as similar data at lower energies [50, 55], are all well represented by Gaussian fits, as shown in Fig. 23. In short, there are no indications of the existence of a broad boost-invariant central plateau in the final particle distributions.
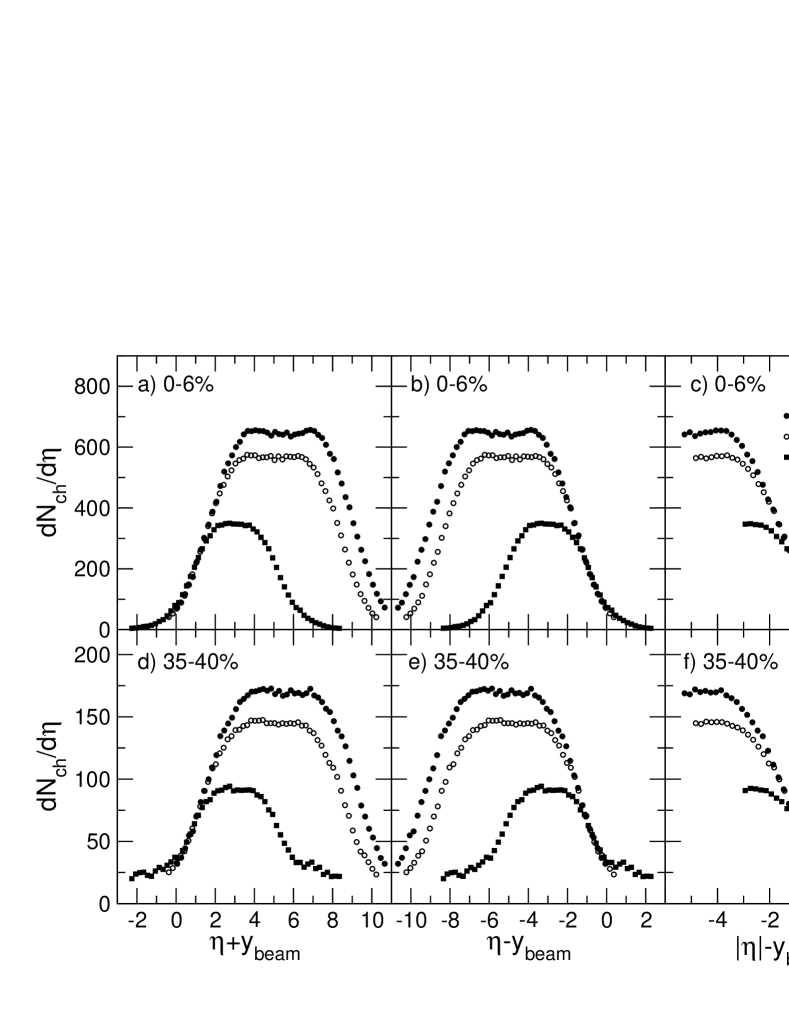
In Fig. 24, the data shown in Fig. 1 are effectively shifted to the rest frame of one of the gold nuclei [44]. The data at both centralities show an extended scaling with the longitudinal velocity in the rest frame of one of the projectiles, identical behavior to that seen in simpler systems (see, for example, [147, 148, 142, 153]). Similar behavior in nucleus-nucleus collisions over a narrower range in was first observed by BRAHMS [181, 182].
Figure 24 illustrates one example of how the scaling behaviors can be used to infer the properties of particle production which lie outside the experimental acceptance at large collision energies. If one accepts the assumption that the distributions at all energies are identical in the region corresponding to larger , the data from lower energies can be used to constrain the extrapolation of the higher energy data to the full solid angle. In addition, it should be noted that the corrections to the PHOBOS multiplicity data depend strongly on emission angle of the particles and also are significantly asymmetric between positive and negative pseudorapidities. The latter effect results primarily from the offset of the PHOBOS magnet from the center of the interaction region (see Fig. 33). The good agreement seen when comparing particles emitted at different angles and for both signs of pseudorapidity indicates the robustness of the analysis procedure, as well as providing interesting physics insight.
Fig. 24 illustrates the observation that longitudinal scaling holds over an even more extended range of pseudorapidity in these seemingly complex high energy A+A collisions at RHIC. Based on the pseudorapidity distribution (and, as will be discussed in following sections, elliptic flow and perhaps even HBT), no evidence is seen in any hadron-hadron or ion-ion collisions for two energy independent fragmentation regions separated by a boost invariant central plateau which grows in extent with increasing collision energy. Thus, the expectation from the boost-invariant description of the energy evolution of rapidity distributions is not valid for heavy ion collisions either. In fact, there is no boost invariant central plateau and, instead, the rapidity distribution appears to be dominated by two broad “fragmentation-like” regions, whose extent increases with energy. We call this effect “extended longitudinal scaling”.
4.5.4 Longitudinal dependence of elliptic flow: Au+Au at RHIC
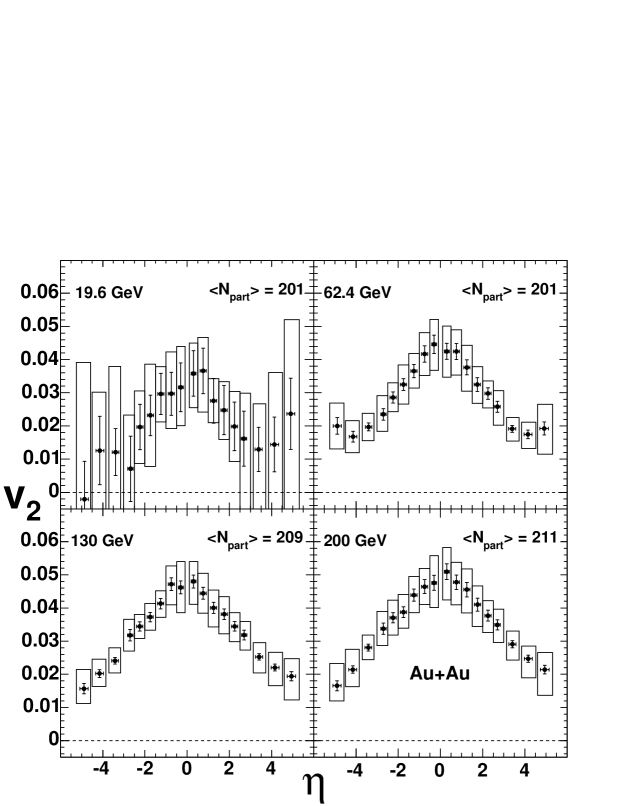
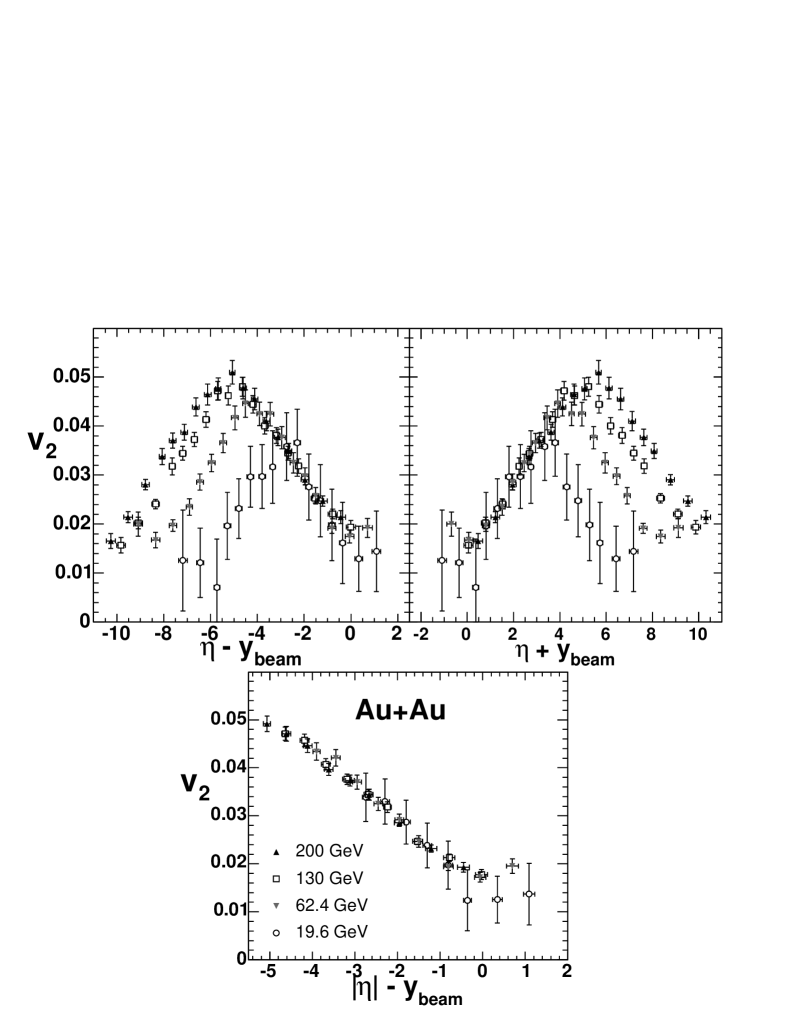
In addition to the pseudorapidity distributions of yields of produced particles, longitudinal scaling can also be seen in the elliptic flow of particles produced in heavy ion collisions. As discussed in Section 3, the elliptic flow parameter, , provides a sensitive probe of the properties in the early stages of the collision, one of which is the presence or absence of boost-invariance. Boost invariant “initial conditions” (i.e. right after the collision) should lead to a boost-invariant . Kinematic effects result in a difference between and , but the changes are small (10% at 200 GeV to 20% at 19.6 GeV)[183, 184]. The small magnitudes of these differences mean that they do not affect the conclusions discussed here and that a boost-invariant scenario (in rapidity) should also result in elliptic flow which is approximately flat over a large region of pseudorapidity. In Fig. 25, the pseudorapidity dependence of the elliptic flow parameter, , is shown for semi-central Au+Au events at various energies [184]. Clearly, no boost invariant central plateau is seen. Thus, there are no indications of the existence of a broad boost-invariant central plateau in the final particle distributions or in the state formed shortly after the collision, as reflected by .
In Fig. 26, the elliptic flow data from Fig. 25 are replotted effectively in the rest frame of one of the gold nuclei. Once again the phenomenon of extended longitudinal scaling is revealed, this time for [184]. As discussed above, there is a small modification of the shape if is plotted versus rapidity instead of but this change does not significantly impact the comparison of different energies. There appears to be a single universal curve governing the elliptic flow as a function of over a broad range down to midrapidity at each energy studied. This extended longitudinal scaling behavior of elliptic flow in Fig. 26 has further implications since elliptic flow builds up early in the collision. Therefore, the dependence on the location in space must reflect the conditions very shortly after the collision, and then these early conditions lead to the measured elliptic flow.
4.5.5 Longitudinal dependence: Lessons from HBT
Particle interferometry, in the form of Hanbury-Brown Twiss (HBT) correlations [185, 186], provides an extra, although much more indirect, test of the ideas of boost-invariance in heavy ion collisions. Since pions are bosons, they constructively interfere when they are near to each other in phase space. Correlation measurements in momentum space can therefore reveal the source size in position space. In particular, HBT correlations are sensitive to the spatiotemporal distributions of particles at thermal freeze-out (i.e. the point of the last elastic interactions). See [187] for a recent review. Appendix B.3 contains more details including a description of the source parameterizations. Most theoretical studies of HBT assume ideal (i.e. non-viscous) hydrodynamics and a boost-invariant source which exhibits longitudinal Hubble flow (, where and are the longitudinal position and velocity, respectively). These assumptions simplify the coupled differential equations and allow the use of 2D transverse expansion overlaid on the boost-invariant longitudinal expansion (a scenario often called 2+1D hydrodynamics). While this basic hydrodynamic picture was roughly successful in describing some aspects of the elliptic flow (see Figs. 6 and 7), these models have failed to describe the HBT data from RHIC [188, 189, 190].
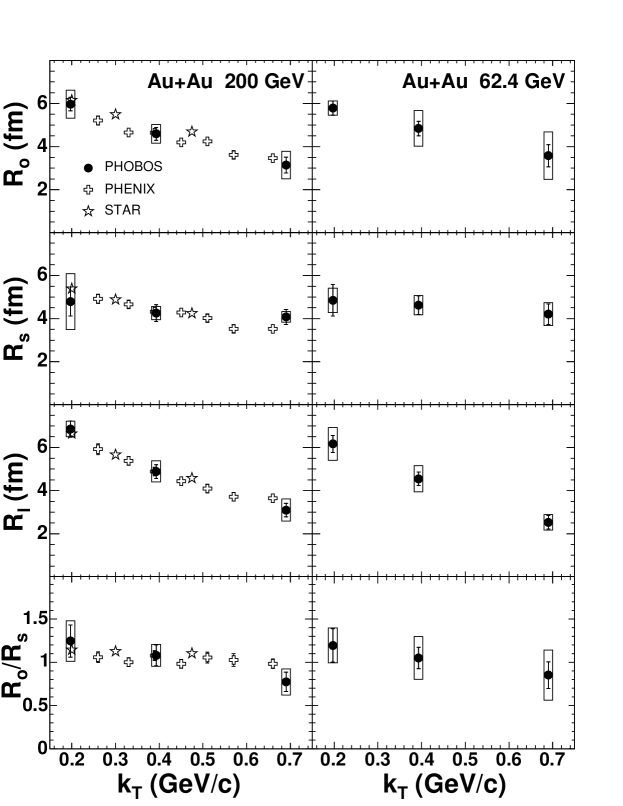
The influence of a possible new phase on HBT measurements has a long history [191]. Under the assumptions of boost-invariant hydrodynamics, the ratio should be large if a long-lived source is formed and should typically be larger than in any case. Figure 27 shows the results of fits using the Bertsch-Pratt parameterization, along with the ratio from =62.4 and 200 GeV Au+Au collisions [192] (see Appendix B.3 for definitions). The data at 200 GeV are compared to the results of other RHIC experiments [193, 194]. In contrast to expectations, the ratio of appears to be close to unity in heavy ion collisions. Similar results were found in heavy ion collisions at lower energies (see references in [192]). The smallness of both and has come to be known as the “HBT puzzle”. It has been postulated that relaxing the assumption of boost-invariance [195, 196], or allowing non-zero viscosity [197], may resolve this discrepancy.
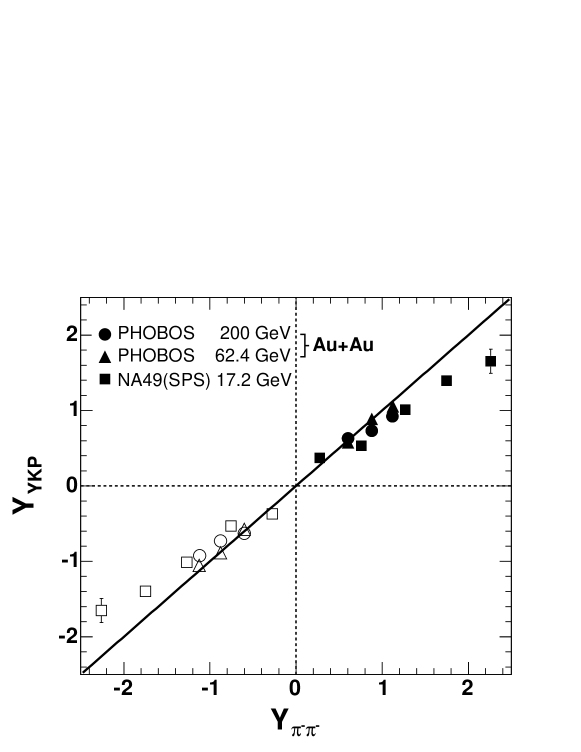
The detailed nature of the longitudinal properties of particle production can also be explored by HBT measurements, in this case in a very direct way as shown in Fig. 28. The data show the average rapidity of the source of the pions (derived from the source velocity in the Yano-Koonin-Podgoretskii parameterization) as a function of the rapidity of the pions themselves [192]. A clear systematic trend is observed, and again the results are very similar to what was found at the SPS [198]. Under the simple assumption of all pions being emitted from a single source located at the center of mass, the ordinate of all points would be equal to zero. If, instead, the system consisted of a series of independent sources at different rapidities (i.e. a strong longitudinal position-momentum correlation) the points would fall on the line. The “locality” revealed by HBT studies of pion correlations in rapidity space suggests that the longitudinal distribution of particle properties is established very early, with the subsequent evolution and freezeout having only short range correlations in rapidity.
4.5.6 Extended longitudinal scaling: Summary
To summarize this section, the data demonstrate that extended longitudinal scaling, reminiscent of “limiting fragmentation” over a broad region of longitudinal momentum, seems to be a dominant feature of particle production for all colliding systems. Based on all of the data, no evidence is seen in any hadron-hadron or ion-ion collisions for two energy independent fragmentation regions separated by a boost invariant central plateau which grows in extent with increasing collision energy. The lack of a broad boost-invariant central plateau is seen in both the final particle distributions and in the state formed shortly after the collision as reflected by . It is difficult to reconcile this with the common assumption that particle production at midrapidity results from different physics than that in the fragmentation region, particularly at the higher energies. Furthermore, the similarity of the longitudinal scaling of both particle densities and elliptic flow suggests the possibility of some direct connection between the two, implying that the final particle multiplicities also result from the properties of the very early evolution.
A good way to appreciate the significance of these results is to consider what would be observed in the detectors if a collider could operate its two beams at different energies. For simplicity, the conventional RHIC designation for the two counter-rotating beams, namely “blue” and “yellow”, will be used. If the energy of the blue beam was set to a rapidity of 2, for example, the results show that, as the rapidity of the yellow beam was increased up to a little beyond 2, the particle density and elliptic flow seen in the detectors covering the blue beam hemisphere would show a gradual increase and then reach a limiting value. With the blue beam fixed at a rapidity of 2, the particle density would not increase beyond this limiting value on the blue beam side even if the yellow beam was set to infinite rapidity. The only way to further increase the particle density or elliptic flow in the blue beam hemisphere would be to increase the energy of the blue beam.
In p+p collisions, extended longitudinal scaling was understood to be a consequence of scaling in string fragmentation (or, equivalently, in parton cascades). No similar, widely accepted, explanation exists for the observation of this behavior in the more complex p+A, d+A, and A+A collisions.
4.6 Factorization of energy and centrality dependence
The previous sections have described separately the dependencies of a variety of observables on energy and centrality. These independent discussions may have obscured the remarkable extent to which these two dependencies factorize. This section will describe several aspects of PHOBOS data which display this phenomenon.
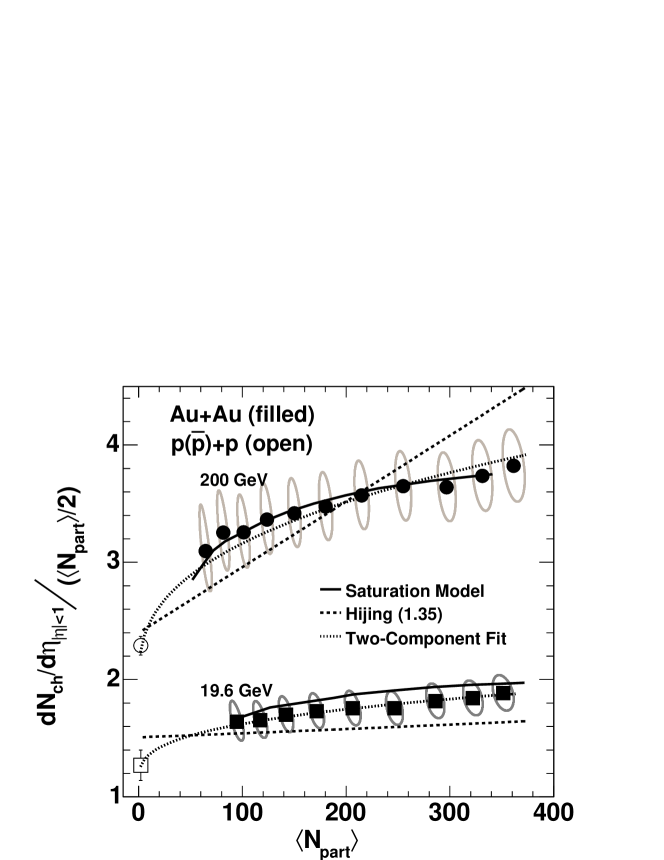
One simple example of factorization was revealed by the PHOBOS measurements of the total charged particle multiplicity divided by the number of pairs of participating nucleons in Au+Au collisions at three energies, from 19.6 to 200 GeV (see Fig. 12). The data for the different energies are separated by a factor that is constant as a function of centrality. In other words, the centrality and energy dependence of the yield per participant in Au+Au collisions factorize over the range of the two control variables. In this case, the factorization occurs trivially, as the total charged particle yield per participant is centrality-independent at all energies. Whether this factorization is a fundamental property of particle production in Au+Au collisions can be tested by studying the yields per participant more differentially in pseudorapidity and transverse momentum.
In Fig. 29, the pseudorapidity density of charged particles per participant pair near midrapidity is shown as a function of centrality for collision energies of 19.6 GeV and 200 GeV [49]. Data for +p collisions at 200 GeV and an interpolated value at 19.6 GeV are also plotted [155, 172, 199]. Over the centrality range shown here, the normalized yield at midrapidity increases by approximately 25% from mid-peripheral to central collisions. Early theoretical explanations attributed this increase to the contribution of the hard component of particle production, which would grow with the relative increase in the number of binary nucleon-nucleon collisions in more central events. As an example of such a superposition of soft and hard particle production, the results of a HIJING calculation [101] are shown as dashed lines. The model shows an increase in the yield per participant pair, although steeper than that seen in the higher energy data.
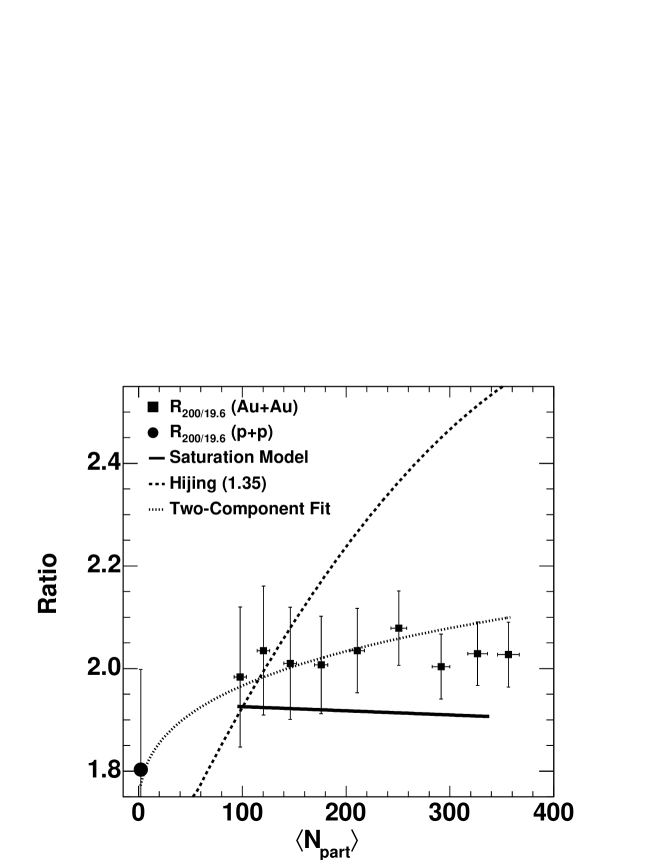
However, this explanation is challenged by the detailed study of the energy dependence of midrapidity particle yields shown in Fig. 30, where the centrality dependence of the ratio of the data for 200 over 19.6 GeV is plotted [49]. Within the experimental uncertainty, this ratio is independent of centrality, whereas the contribution from hard processes would be expected to show a large increase over this collision energy range. This is illustrated by the HIJING prediction for this ratio (shown as a dashed line), which completely fails to capture the factorization of energy and centrality dependence for the midrapidity yield per participant. A similar result was found earlier (over a smaller span in beam energy) using the centrality dependence of normalized midrapidity yields from Au+Au at =130 GeV [46, 48].
The results of an attempt to investigate the interplay of hard and soft scattering without invoking a complicated model are shown as dotted lines. In this case, a very simplistic two component fit [200] was performed to separately extract the fractions of the particle yield which scaled with the number of participants (soft scattering) and the number of collisions (hard scattering). A reasonably good fit to the data is found but the fitted parameters suggest that, within the uncertainties, there would be an identical contribution from hard scattering at both beam energies, a result which is totally unexpected for minijet dominated physics.
Also shown in Figs. 29 and 30 is the result of a saturation model calculation [74, 201]. This model, which, as mentioned in Section 2.1, yields a reasonably good match to the energy evolution of particle yields at RHIC energies, also does a much better job of describing the centrality evolution than the HIJING model.
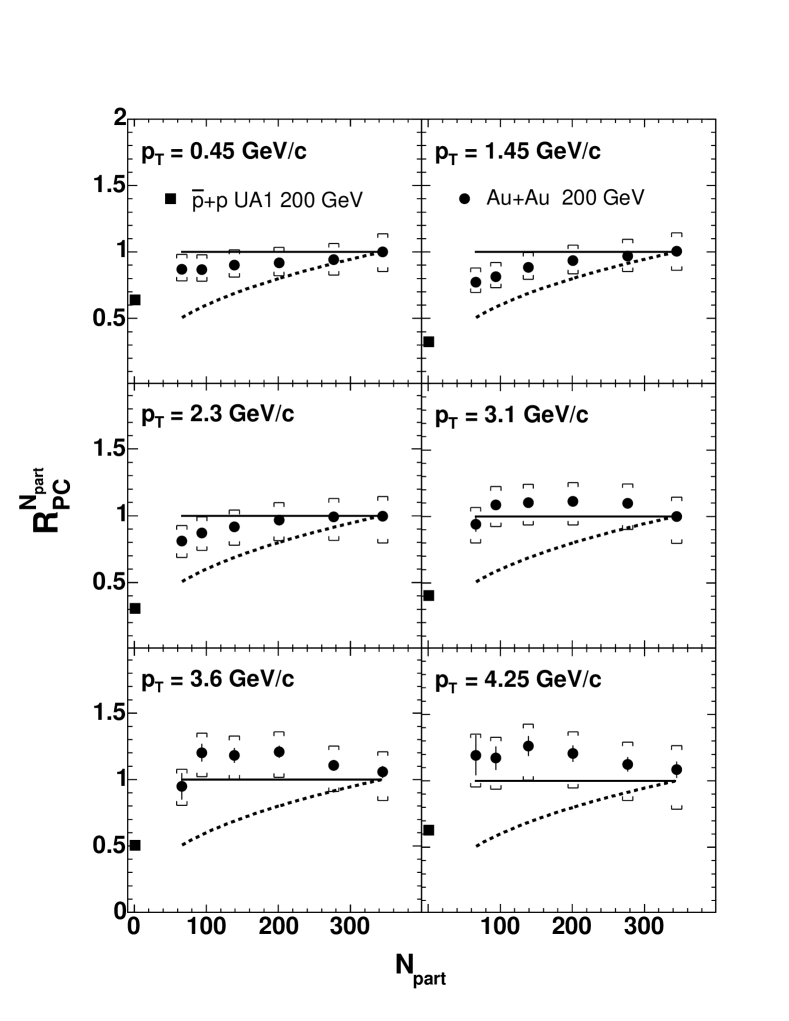
Another example of non-trivial centrality dependence that is energy independent was shown by the pseudorapidity distributions in Figs. 14 and 24. The former showed that the shape of the distributions differed significantly as a function of centrality. The latter demonstrated that the distributions at different beam energies were found to line up when plotted in the approximate rest frame of one of the incoming nuclei, i.e. using the variable . Thus, the shape evolution with centrality is independent of beam energy over a very broad range in .
Additional evidence for factorization is provided by the transverse momentum distributions briefly mentioned in Sect. 3. In the absence of medium effects, one would expect that the volume scaling (i.e. proportionality to ) observed for the bulk production of hadrons turns into scaling with the number of binary collisions () when measuring reaction products of point-like hard processes. This transition should be visible when studying particle production as a function of transverse momentum. However, as is now known (see Fig. 8), particle production at large transverse momenta seems to be significantly modified in the presence of the medium in heavy ion collisions. The strength of this modification is more clearly illustrated in Fig. 31 which shows the nuclear modification factor for charged hadrons in six bins of as a function of [84]. In the figure, yields at a given transverse momentum in collisions of varying centrality were normalized by the number of participant pairs and then divided by a fit to the same quantity in central data (see Appendix B.3 for definition). Data for p+p collisions from UA1 [164] are shown with the same normalization factor. It is striking to see that the medium modification results in charged particle yields that, over the centrality range studied here, more closely scale with than with the number of binary collisions, even for transverse momenta above 4 GeV/c.
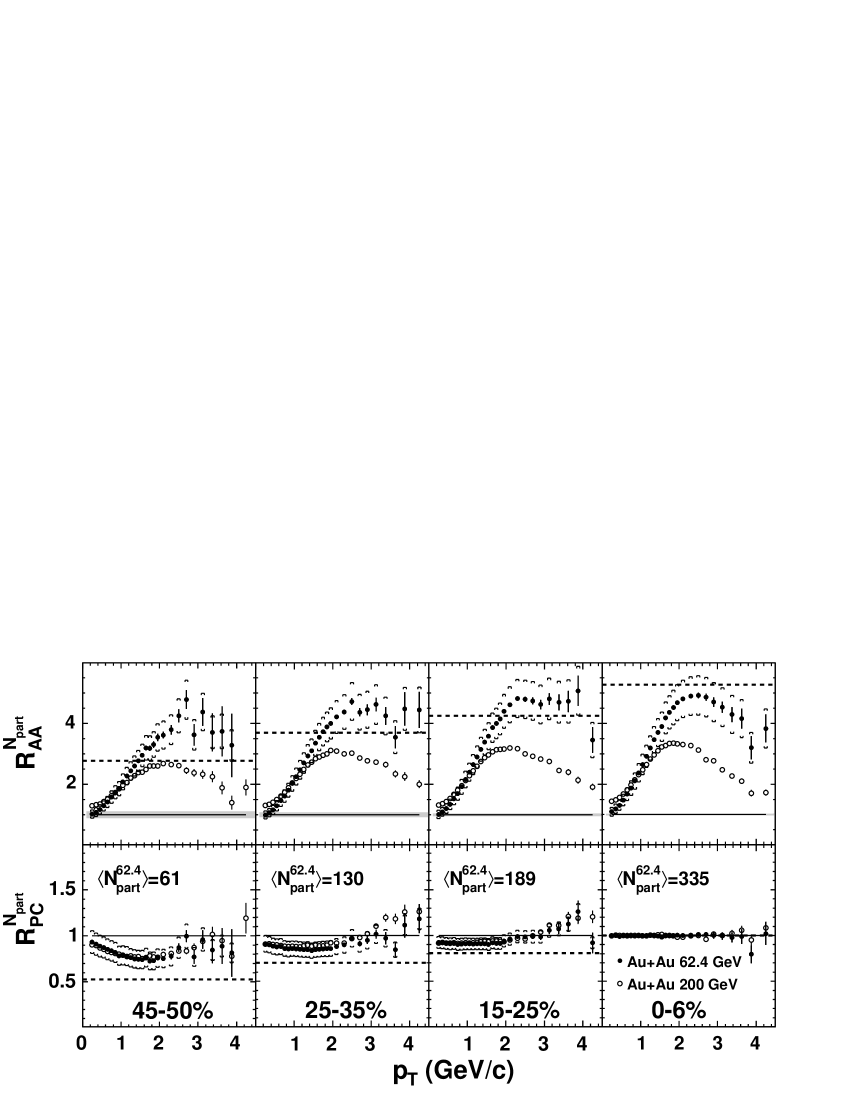
The observation of scaling at high transverse momentum suggests that the medium is almost completely “black” or “absorbing” to produced fast particles. This conclusion follows if one assumes scaling of the primary production throughout the entire volume of the collision zone followed by complete absorption except on the surface. The volume to surface ratio (proportional to the nuclear radius or equivalently ) has a centrality dependence that is similar to the dependence for the ratio of the number of collisions to the number of participants. However, since the centrality dependence of particle production is seen to be very similar at all transverse momenta, it is also possible that the usual simplistic assumption of participant dominance at low evolving into collision dominance at higher values needs to be reconsidered.
Data from the most recent RHIC run have been used to study the evolution of the transverse momentum distributions as a function of both collision centrality and energy. The measurements were performed near midrapidity at collision energies of 62.4 GeV and 200 GeV [116]. In Fig. 32, particle production as a function of centrality and is shown for these two energies in terms of and (Ref. [116] shows additional centrality bins). As defined in Appendix B.3, shows the variation in the yield per participant pair relative to p+p collisions [164, 202, 203] (upper row of Fig. 32) and shows the variation in yield per participant pair relative to central Au+Au collisions (bottom row).
As discussed earlier, the range in from a few hundred MeV/c to more than 4 GeV/c is assumed to cover very different regimes of particle production, from soft coherent processes to independent binary scattering. Over the collision energy range from 62.4 to 200 GeV, overall particle production in p+p increases by less than a factor 2, whereas the yield at =4 GeV/c increases by an order of magnitude. This clearly shows the change in the balance of lower and higher transverse momenta particles, which presumably reflects the different energy dependencies of soft and hard particle production in p+p collisions over this energy range. For central Au+Au collisions however, the ratio of the yields between 200 GeV and 62.4 GeV at =4 GeV/c is only about 4 (with a factor of 1.6 increase in the -integrated multiplicity), i.e. the huge increase in the yield of high particles in p+p is not reflected in Au+Au.
The top row of Fig. 32 clearly demonstrates that the overall shape and magnitude of depend strongly on beam energy and, to a lesser extent, also on centrality. In particular, at both energies the yield per participant at any given changes by less than 25% over the centrality range from 60 to 340 participants, with an even smaller variation at the highest . Even more surprisingly, the comparison in terms of in the bottom row of the figure shows that the remaining variation of the yield per participant pair is the same for both energies over the full and centrality range. This means that the energy and centrality dependences of particle production also factorize over this entire range in energy, centrality, and . This is particularly striking, as the factorization therefore covers both the bulk particle production at low , as well as rare particle production at intermediate and high , believed to be governed by different particle production mechanisms. In particular, at intermediate above 1 GeV, particle production is thought to be influenced by the effects of radial hydrodynamic flow, the broadening due to initial and final state multiple scattering (“Cronin effect”), the balance between ‘soft’ and ‘hard’ particle production, parton recombination and fragmentation, and the in-medium energy loss of fast partons. All of these contributions to the overall particle yields are expected to show distinctly different centrality and energy dependencies at different , yet the overall result is a factorization of energy and centrality dependence at all within the experimental uncertainty.
The observed factorization in the energy and centrality dependencies of transverse momentum spectra, combined with similar observations for total and midrapidity yields as well as the rapidity distributions, strongly suggests that the data reflect the dominant influence of yet-to-be-explained overall global constraints in the particle production mechanism in A+A collisions.
5 Conclusion
PHOBOS data and results from the other RHIC experiments, combined with very general arguments which are either model independent or depend on fairly simple model assumptions, lead to a number of significant conclusions.
In central Au+Au collisions at RHIC energies, a very high energy density medium is formed. Conservative estimates of the energy density at the time of first thermalization yield a number in excess of 3 GeV/fm3, and the actual density could be significantly larger. This is far greater than hadronic densities and so it is inappropriate to describe such a medium in terms of simple hadronic degrees of freedom. Unlike the weakly interacting QGP expected by a large part of the community before RHIC turn-on, the constituents of the produced medium were found to experience a significant level of interactions. If this medium is a new form of QCD matter, as one would expect from lattice gauge calculations for such a high energy density system, the transition to the new state does not appear to produce any signs of discontinuities in any of the observables that have been studied. To the precision of the measurements, all quantities evolve smoothly with energy, centrality, and rapidity. Although it does not provide strong evidence against other possibilities, this feature of the data is consistent with the results of recent lattice QCD calculations which suggest that the transition from this novel high energy density medium to a hadronic gas is a crossover.
An equally interesting result was the discovery that much of the data can be expressed in terms of simple scaling behaviors. In particular, the data clearly demonstrate that proportionality to the number of participating nucleons, , is a key concept which describes much of the phenomenology. Further, the total particle yields per participant from different systems are close to identical when compared at the same available energy; the longitudinal velocity dependences of elliptic flow and particle yield are energy independent over a very broad range, when effectively viewed in the rest frame of one of the colliding nuclei; and many characteristics of the produced particles factorize to a surprising degree into separate dependences on centrality and beam energy.
All of these observations point to the importance of the geometry of the initial state and the very early evolution of the colliding system in determining many of the properties of the final observables. Future data at RHIC, most especially collisions of lighter nuclei, as well as higher energy nucleus-nucleus data from the LHC, will help to further evaluate the range of validity of these scaling behaviors. It is possible that models which describe the initial state in terms of parton saturation will play a role in explaining some or all of these scaling properties, but such an identification is not yet clear. What is clear is that these simple scaling features will constitute an integral component or essential test of models which attempt to describe the heavy ion collision data at ultrarelativistic energies. These unifying features may, in fact, provide some of the most significant inputs to aid the understanding of QCD matter in the region of the phase diagram where a very high energy density medium is created.
Appendix A The PHOBOS detector
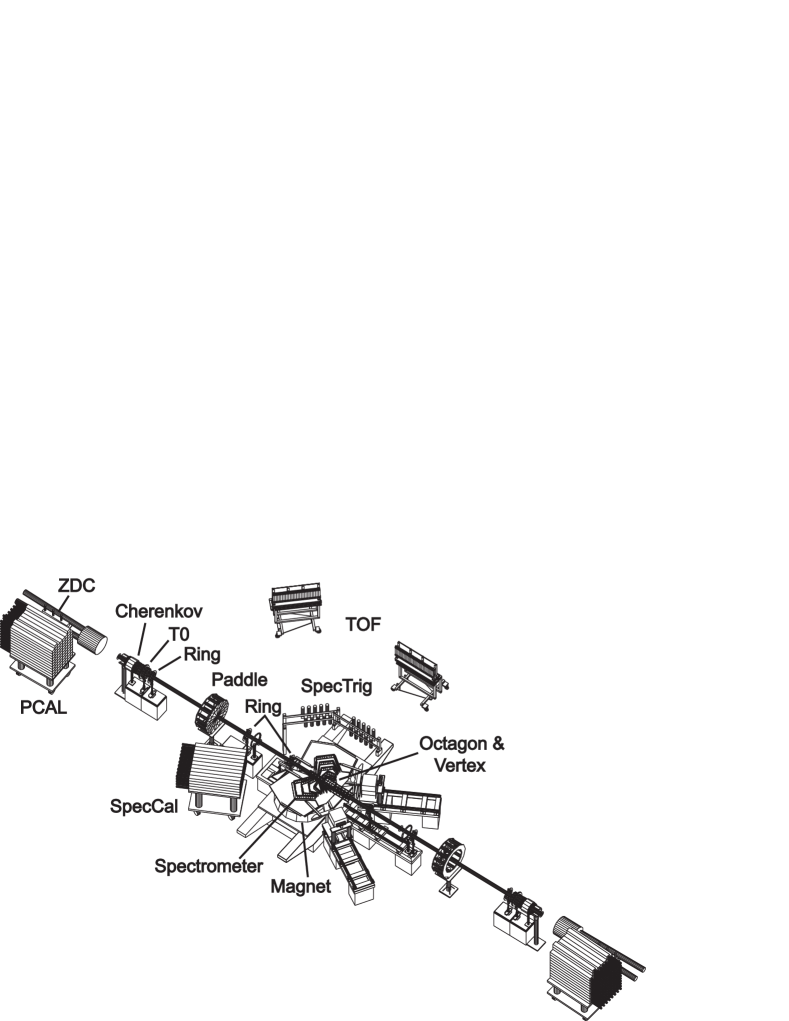
The PHOBOS experimental setup is composed of three major sub-systems: a charged particle multiplicity detector covering almost the entire solid angle, a two arm magnetic spectrometer with particle identification capability, and a suite of detectors used for triggering and centrality determination. More details can be found in [204]. The active elements of the multiplicity detector and tracking detectors in the spectrometer are constructed entirely of highly segmented Si wafers with individual readout of the energy deposited in each pad [205, 206, 207]. The layout of the experiment during the 2004 run is shown in Fig. 33. An enlarged view of the region around the beam collision point is shown in Fig. 34. Table 1 lists the colliding systems, center-of-mass energies, and data samples collected by PHOBOS during the first four RHIC runs.

| RHIC | Colliding | Beam | Dates of PHOBOS | Total | |
| Run | System | Rapidity | Data Taking | Events (M) | |
| Au+Au | 55.87 GeV | 4.094 | 6/13/00–6/16/00 | 1.8* | |
| 1 | Au+Au | 130.4 GeV | 4.942 | 8/15/00–9/4/00 | 4.3 |
| Au+Au | 130.4 GeV | 4.942 | 7/8/01 | 0.044 | |
| Au+Au | 200.0 GeV | 5.370 | 7/20/01–11/24/01 | 34 | |
| 2 | Au+Au | 19.59 GeV | 3.044 | 11/25/01–11/26/01 | 0.76* |
| p+p | 200.0 GeV | 5.362 | 12/28/01–1/25/02 | 23 | |
| d+Au | 200.7 GeV | 5.370 | 1/6/03–3/23/03 | 146 | |
| 3 | p+p | 200.0 GeV | 5.362 | 4/13/03–5/24/03 | 50 |
| Au+Au | 200.0 GeV | 5.370 | 1/5/04–3/24/04 | 215 | |
| 4 | Au+Au | 62.40 GeV | 4.205 | 3/24/04–4/2/04 | 22 |
| p+p | 200.0 GeV | 5.362 | 4/18/04–5/14/04 | 28 |
The Si pad detectors used to measure multiplicity consist of a single layer covering almost the entire solid angle. These detectors measure the total number of charged particles emitted in the collisions, as well as detailed information about their distribution in azimuthal and polar angle (or equivalently pseudorapidity, ). The Si modules are mounted onto a centrally located octagonal frame (Octagon) covering , as well as three annular frames (Rings) on either side of the collision vertex, extending the coverage out to .
The Si modules forming the arms of the spectrometer are mounted on eight frames. Depending on the trajectory, charged particles traverse between 13 and 16 layers of Si as they pass through the spectrometer. The first layer is only 10 cm from the nominal interaction vertex. The magnet pole tips are arranged to produce almost no magnetic field in the vicinity of the first six layers. The field then rises rapidly to a roughly constant value of 2 Tesla for the remaining layers. The Si wafers are finely segmented to provide 3-dimensional space points used in the track finding. The solid angle covered depends on the vertex location along the beam direction and extends over about 3/4 of a unit of for any given vertex location, with a total coverage of roughly . Each arm covers approximately 0.1 radians in azimuth for particles that traverse all of the layers. The momentum resolution is close to 1% for particles with momenta near 0.5 GeV/c and rises about 1% for each additional 3 GeV/c.
Particle identification is provided using two techniques. Charged particle energy loss is measured in each Si layer. Combining this information with the momentum from the tracking can separate pions from kaons out to about 700 MeV/c and pions from protons out to about 1.2 GeV/c. Additional particle identification is provided by two Time-of-Flight (TOF) walls, each consisting of 120 plastic scintillator slats. Before the start of the 2003 RHIC run, these walls were moved farther from the interaction point, extending particle identification capability out to momenta roughly 2-3 times that achievable using energy loss in the silicon detector. In their new locations, the TOF walls cover roughly half the azimuthal acceptance of the spectrometer.
Before the 2004 run, a small hadronic calorimeter (SpecCal) was installed behind one of the spectrometer arms. Consisting of 50 lead/scintillator modules, each 10 cm square by about 120 cm long, this detector can be used to measure the energy of high momentum particles traversing part of the spectrometer acceptance.
The primary event trigger for all colliding systems was provided by two sets of 16 plastic scintillator slats (Paddles) covering . Imposing an upper limit on the time difference between the signals in the two arrays eliminated most beam-gas interactions and provided a rough selection of collision vertex locations along the beam line. To enhance the data sample of useful events, a more precise measure of vertex location was generated using two arrays of 10 Čerenkov counters (T0s). This was necessary because the range of vertex positions for which the multiplicity and tracking detectors have reasonable acceptance is considerably shorter than that created by the overlap of the colliding beam bunches. For different colliding systems, the T0 detectors could be moved to different locations along the beam line in order to optimize the efficiency of the vertex determination while minimizing the number of events with multiple particles traversing a single counter. A more precise vertex location is found off-line using signals from the Vertex detector, which is composed of two sets of two layers each of Si modules. With high segmentation along the beam direction, correlating hits in the inner and outer layer can be used to determine the vertex along the beam line to an accuracy of better than 0.4 mm. This detector also determines the height of the beam but with limited resolution. The vertical position and horizontal position perpendicular to the beam can be found using tracks from the spectrometer.
Colliding systems such as p+p or d+Au, which produce smaller numbers of particles, have fewer events with tracks traversing the spectrometer. The spectrometer trigger uses an additional array of scintillator slats (SpecTrig) mounted between the tracking detectors and the TOF walls. Coincidences between the SpecTrig and TOF hit slats, combined with the vertex location from T0, were used online to select events containing a high momentum track in the acceptance of both the spectrometer and the TOF.
The Zero-Degree-Calorimeters (ZDC) have a cross-sectional area of 1012 cm2 centered on the direction of the beam and are located about 18 m from the nominal interaction point. Particles hitting these detectors must first traverse the initial RHIC accelerator magnet which separates the two counter-circulating beams. Therefore, the ZDC signal results almost exclusively from spectator neutrons which are not bound in nuclear fragments and whose transverse momentum remains close to zero after the interaction. Due to the response time of this detector, partly resulting from its long distance from the collision point, it was not possible to use ZDC signals in the primary event trigger for the bulk of the physics data. However, this device was used on-line in special runs to check triggering efficiency for the other detectors and also off-line in studies of centrality determination.
Similar to the ZDC, the Proton Calorimeters (PCAL) are located behind the first accelerator magnets, but in this case next to the outer edge of one of the beam pipes. The magnets bend spectator protons to an angle of more than twice that of the beam particles so these protons will exit the beam pipe and shower in the PCAL. As with the ZDC, only individual protons, as opposed to those bound in clusters, can be detected. The PCAL is particularly useful for studies of d+Au collisions. On the side of the outgoing deuteron, the combination of PCAL and ZDC signals can be used to divide the event sample into p+Au, n+Au, and d+Au subsets, i.e. events in which only one or both of the incoming nucleons interacted. On the side of the outgoing Au nucleus, the PCAL is primarily sensitive to protons knocked out of the Au, which is a measure of the total number of collisions suffered by the interacting nucleons in the deuteron.
Appendix B Definitions of terms
In this section, detailed definitions are given for the important event and particle characterization parameters, as well as a number of the critical observables used in the physics analysis.
B.1 Event characterization
In interpreting data from heavy ion collisions, the primary event characterization parameters are the energy of the collision and the overlap of the two nuclei at the moment when they interact, commonly referred to as centrality. In order to compare fixed target, colliding beam, symmetric, and asymmetric systems all on a common footing, the collision energy is defined using the center-of-mass energy available when a single nucleon from one projectile collides with a single nucleon from the other projectile, ignoring Fermi motion. The standard notation for this quantity is , referred to as the nucleon-nucleon center-of-mass energy. For symmetric colliding beams, each of which has the same energy per nucleon, is simply twice that value and the nucleon-nucleon frame is also the lab frame. When colliding deuterons and gold at RHIC, both beams were run at the same relativistic (and therefore the same rapidity) as the gold beams in the 200 GeV Au+Au collisions. The mass difference caused by the binding energy is responsible for the fact that the d+Au collisions are slightly asymmetric in the lab frame. The deuteron has a total energy of 100.7 GeV/nucleon, only 0.7% larger than the gold beam value of 100.0 GeV/nucleon. Consequently, the nucleon-nucleon frame does not coincide with the lab frame, but the shift in rapidity is only +0.004 units. For collisions of p+p, in contrast, the relativistic (and hence the rapidity) were adjusted in order to compensate for the small mass difference and, thereby, to achieve the same of 200 GeV as for the highest energy Au+Au collisions. At RHIC, data have been taken for a wide range of (see Table 1) ranging from a value close to the maximum achieved at the SPS up to a value more than 10 times larger.
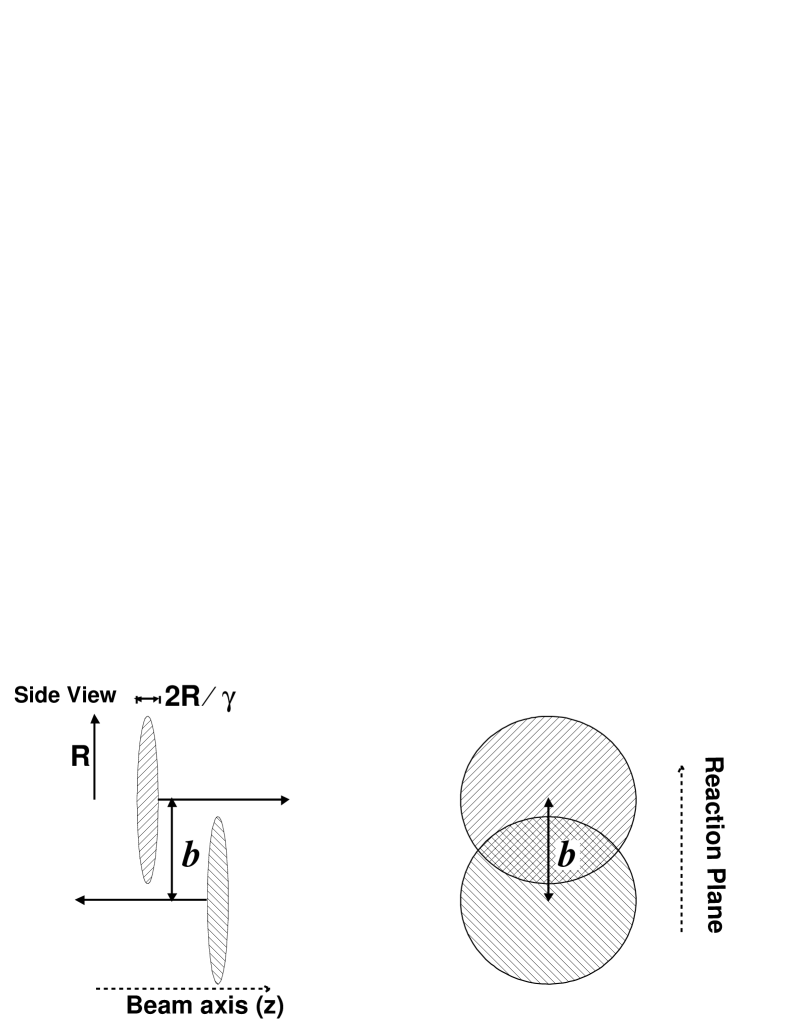
A direct measure of the collision geometry is given by the impact parameter, , which is the transverse distance between the centers of the colliding heavy ions. It is defined such that for central collisions, see Fig. 35.
In most physics analyses of heavy ion collision data at highly relativistic energies, the impact parameter is not considered particularly useful in characterizing the important influence of geometry on the outcome of a given interaction. Instead, two parameters which quantify the critical distinctions are used: namely the number of participating nucleons, , and the number of binary nucleon-nucleon collisions, . In defining these variables, two important assumptions are made. First, since the collision duration at such high energies is very short compared to the typical time-scale for nuclear rearrangement or movement of nucleons within the nucleus, it is assumed that only the nucleons in the overlap region (the cross-hatched area in the right panel of Fig. 35) experience any substantial interactions (i.e. participate) in the collision. Second, the collisions suffered by a given nucleon as it traverses the other nucleus may not be distinct sequential events, and thus it may be most meaningful to simply count the total number of collisions. For observables such as elliptic flow which are sensitive to the shape of the initial overlap region, a third parameter, namely the spatial asymmetry of this region derived from the impact parameter and the radii of the colliding nuclei, can be used.
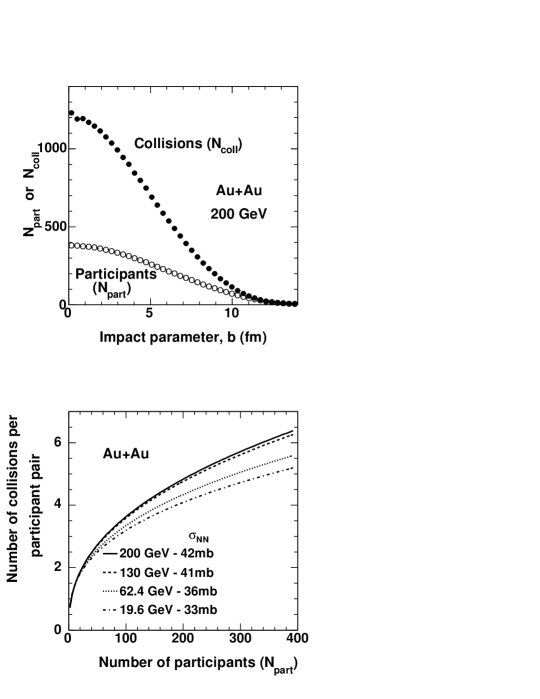
In determining the number of participating nucleons, or equivalently the number of nucleons which interact, only those which are struck by nucleons from the other nucleus (as opposed to ones which were hit only in secondary scatterings) are counted. This is the same quantity as “wounded nucleons” introduced by Białas, Bleszyński and Czyż [146]. In some publications, the notation is used for what is herein referred to as and the notation includes nucleons suffering secondary scatterings. When comparing PHOBOS data with results from other experiments, care has been taken to use the appropriate values. depends on the collision geometry and is typically calculated using a Glauber model of the collision. The key ingredients in this calculation are (1) nucleons are distributed according to a nucleon density function (e.g. Woods-Saxon), (2) nucleons in each nucleus travel in straight lines through the colliding system, and (3) nucleons interact according to the inelastic cross section, , as measured in proton-proton collisions. For the energies at RHIC, the values assumed for were 33, 36, 41, and 42 mb for =19.6, 62.4, 130, and 200 GeV, respectively. In all cases, the nucleons were assumed to be hard spheres distributed according to a Wood-Saxon functional form of
where =6.38 fm and =0.535 fm for all energies. The open circles in the top panel of Fig. 36 show an example of the results of such a model calculation relating and impact parameter for Au+Au collisions at one of the RHIC energies. The number of participants is usually assumed to have a strong influence on the bulk properties of particle production but it is shown in the physics sections of this paper that (or ) provides a convenient benchmark to study the effects of the collision geometry on many measured experimental quantities.
As introduced above, denotes the number of binary nucleon-nucleon collisions in a heavy ion reaction. As in the calculation of , only primary collisions, i.e. those occurring along the straight-line trajectory of nucleons through the opposing nucleus, are counted. This quantity can also be calculated in a Glauber model, with typical results being shown as closed circles in the top panel of Fig. 36. The yield from hard scattering (i.e. large momentum transfer) processes is expected to scale as . For symmetric A+A collisions, simple geometrical arguments imply that would scale as roughly . Thus, for collisions of more than two participants, the number of binary nucleon-nucleon collisions is larger than the number of participants, with the difference increasing dramatically for smaller impact parameters.
One possibly important aspect of centrality in heavy ion collisions which goes beyond the simple increase in the number of participants or collisions is shown in the bottom panel of Fig. 36. There, the number of collisions is divided by the number of participating pairs to derive the average number of collisions suffered by each participant. A similar parameter, typically denoted and calculated from where the ’s are inelastic cross sections, is commonly used to characterize centrality or target dependences of observables in p+A collisions [145]. In nucleus-nucleus collisions, the calculated average number of collisions per participant varies by a large factor as a function of centrality and also has some dependence on energy due to the varying nucleon-nucleon cross section.
B.2 Particle characterization
In describing the trajectories of particles emitted in heavy ion collisions, a distinction is typically made between longitudinal (i.e. along the beam direction) and transverse motion. The former may reflect some remnant of the original motion of the beam while the latter is largely generated in the interaction. The physics variable typically associated with the longitudinal motion is rapidity, denoted and defined as with and being the total energy and the component of the particle’s momentum along the beam, respectively, and being the transverse mass defined below. Rapidity has the important property of being additive in Lorentz transformations from one reference frame to another which differ by velocity along the beam. Thus, the shape of the distribution of any quantity plotted versus rapidity is the same in any such frame. Unfortunately, it is frequently difficult to experimentally determine the particle identification, or in some cases even the momentum itself, necessary to calculate rapidity. In such instances, it is common to replace rapidity with pseudorapidity, denoted and defined as , where is the polar angle to the beam axis. For particles whose total momentum is large compared to their mass, i.e. for particles whose velocity is close to the speed of light (1), the two measures are close to identical, except for polar angles very close to zero. Since the produced particles are typically dominated by pions whose transverse momentum alone averages a few hundred MeV/c or more, the use of pseudorapidity is a quite reasonable approximation. A variable frequently used in elementary collisions is the Feynman variable given by the ratio of the momentum along the beam to the maximum possible value, .
Another aspect of the distributions as a function of longitudinal velocity that proves to be very interesting is the comparison of distributions at a variety of beam energies but viewed in the rest frame of one of the projectile particles. For distributions as a function of rapidity, this can be done exactly and trivially by simply subtracting the rapidity of the beam from the rapidity of each particle. In the case of pseudorapidity distributions, the transformation is not exact but a reasonably close approximation is found using the shifted pseudorapidity, denoted and defined as , where is the pseudorapidity of a particle and is the beam rapidity. The quantity , which is given by with , , and being the energy, momentum, and mass of the beam, respectively, is given in Table 1 for the various colliding systems and energies. Fermi motion of 300 MeV/c would spread the nucleons out by typically 0.3 units in rapidity.
The transverse motion is most often characterized using simply the component of the momentum, denoted , that is perpendicular to the beam axis. Occasionally, the so-called transverse mass, , is used where is the rest mass of the particle. The use of this more complicated variable is motivated by its appearance as the natural scaling parameter for particles emitted by a thermal source. It can also be used to combine energy, transverse momentum, and rapidity of a particle via the identity .
The various particle characterization variables can be related using the following identities:
For relativistic beam energies, and for larger than about 1–2, so that:
where is the nucleon mass.
In the case of jets emitted in e++e- annihilation, the motions of individual particles along and transverse to the beam are not the most interesting quantities. Instead, distributions are characterized by the trajectories of particles relative to the jet direction, the so-called thrust axis. Since data exist most frequently in the form of unidentified charged particles, the motion along the thrust axis is traditionally defined using , the rapidity calculated using the momentum parallel to the jet direction and assuming the pion mass. The required shift to compare different beam energies in a common frame, as was done for or , is not intuitively obvious. In this paper, the somewhat arbitrary choice was made to replace in the formulas above with which is the rapidity calculated using the center-of-mass energy combined with the assumption of the proton mass. Therefore, the same shift was used in both e++e- and p+p at the same .
B.3 Notation for observables
The most basic observable characterizing particle production is the total number of particles emitted. Two experimental hurdles complicate the extraction of this number from the data. The first is that only charged particles are easily detected. Although assumptions can be made concerning the ratio of charged and neutral particles, the multiplicity data is almost always presented in terms of the number of charged particles. Adjustments for the number of unobserved neutrals is typically only done when needed in a specific calculation, for example in the discussion of the energy density presented in Sect. 2.1. The notation (A+B) is used to denote the total charged particle yield, integrated over all solid angle, in collisions of species A with species B. To date, PHOBOS has measured (d+Au) at a variety of centralities for one center-of-mass energy and (Au+Au) over a broad range of both centrality and beam energy. Note that in all cases the multiplicity is defined to be “primary”, i.e. those particles emitted in the initial interaction. Corrections are applied to the data to remove all other “secondary” particles, which are created in weak or electromagnetic decays of primary particles and interactions of primary particles with material in the detector. The second complication in extracting total numbers is that no detector can be fully hermetic, i.e. capable of detecting every single particle emitted. As a result, it is always necessary to measure distributions of particles and extrapolate into the unmeasured regions.
Because the PHOBOS multiplicity detector measures only the emission angle of charged particles, the extracted distribution is the number of charged particles per unit pseudorapidity, denoted . The experimental layout is designed to minimize the amount of material between the collision vertex and the active elements and, therefore, the cut-off in transverse momentum is low and the losses of particles with low are small. The correction for secondary particles which are added to the total by decays or interactions in the material is typically much larger than the correction for particles that are lost. In addition, the very broad coverage in provided by the PHOBOS setup results in a relatively small extrapolation for particles emitted at small angles with respect to the beam. Thus, PHOBOS can provide information about and which are unique at RHIC. As mentioned above, it is also interesting to study particle distributions shifted into the rest frame of one of the projectiles. The shifted distribution, , can be used as a measure of the charged particle pseudorapidity density as effectively viewed in the rest frame of one of the colliding nuclei, although one should keep in mind that such a shift is, in principle, associated with a small distortion of the distributions.
As discussed in the main body of this paper, the particle density is highest near or of zero and, therefore, it is generally assumed that the potential for creation of any new state of matter is also highest in that region. As a result, the properties of observables “near midrapidity” are of particular interest. For the midrapidity multiplicity distribution, the range chosen is 1 unit in so the pseudorapidity distribution is averaged over this range to generate .
In cases where the momentum and angle of the particles are measured, distributions in both transverse momentum and rapidity (or pseudorapidity in cases without particle identification) can be generated. The transverse distributions are commonly presented in a form which is Lorentz invariant given by , with and being the total energy and vector momentum of the particle, respectively. Since the interesting quantity is typically the number of particles in a given event, i.e. the distribution that integrates to give multiplicity, this is more commonly expressed as invariant yield . When integrating over all orientations of the reaction plane, azimuthal symmetry can be assumed and the differential momentum volume can be expressed in cylindrical coordinates as . Furthermore, the component of the momentum parallel to the beam can be transformed using where is the rapidity, resulting in the final form . When using transverse mass, the transformation is trivial since and only the horizontal axis changes in the distributions. In cases without particle identification, rapidity is approximated by pseudorapidity, yielding .
When comparing transverse momentum distributions for more complicated systems to data from proton-proton collisions, one could simply take the ratio of the two distributions as a function of to study the change in magnitude or shape. This ratio is called the nuclear modification factor since it is a measure of the modification of the properties of the emitted particles resulting from the presence of the nucleus in the interaction. In order to test specific theories of how the yield should scale, the standard procedure is to normalize the A+A (or, equivalently, scale the p+p) data by some factor. The resulting ratio comparing collisions of species A with species B to p+p is typically denoted defined as
The most common normalization, and the one usually indicated by the simple notations , , etc., is as shown in the rightmost formula above. This arises from the interest in studying the behavior of high transverse momentum particles and the belief that the yield from such “hard” processes should scale with the number of binary nucleon-nucleon collisions. Analysis by the PHOBOS collaboration has demonstrated that the number of pairs of participating nucleons is often the more appropriate scaling variable. To avoid confusion, ratios using this latter normalization are denoted
Note that a p+p collision has one pair of participants. This normalization will be generically referred to as the number of participant pairs even in asymmetric collisions.
It is frequently of interest to study the evolution of the shape and magnitude of these distributions as a function of centrality for nucleus-nucleus collisions. The most direct display of this evolution involves dividing data from one centrality bin by that from a different bin. In this case, both distributions need to be suitably normalized. The notation PC (CP) is used for ratios where peripheral (central) data is divided by central (peripheral). The PHOBOS collaboration has recently advocated the use of since different experiments have different reach in centrality and the central data typically have significantly smaller statistical and systematic errors. In keeping with the convention described above, the definitions with the different normalizations are
and
Note that the practical application of these definitions typically uses a fit to the distribution that appears in the denominator in order to avoid propagating statistical point-to-point fluctuations.
In the case of pure scaling, and would be unity while and would be unity for perfect scaling. The variation of for scaling (see, for example, Fig. 8) or the variation of and for scaling (see Figs. 31 and 32) depends on the ratio of to . Careful examination of the numbers in Tables 3 and 4 in Appendix C.1 reveals that, for a given centrality, this ratio depends slightly on beam energy. When comparing data at 62.4 and 200 GeV, the difference is never more than 15%. For clarity, the dashed lines in Figs. 8 and 32 show only the value for the lower beam energy.
Using an event-by-event measurement of the orientation of the two colliding nuclei, the study of particle distributions can be extended to include a third coordinate, namely the azimuthal angle. In relativistic heavy ion collisions, the generic terms “directed flow” and “elliptic flow” are used for the measurement of anisotropy in the azimuthal distributions of particles relative to the reaction plane. The reaction plane for a particular collision is the plane defined by the impact parameter and the beam axis ( and in Fig. 35). In flow analyses, the distribution of particles in the azimuthal angle, , (always taken relative to the reaction plane for a particular collision) is measured and expressed in terms of a Fourier expansion, . The amplitude of the first -dependent term, , is called directed flow. Elliptic flow is the name given to the amplitude of the second term of the Fourier expansion, . This latter anisotropy in the form of a variation in particle yield in momentum space results primarily from the non-spherical shape in position space of the initial collision volume (see the cross-hatched region in the right panel of Fig. 35).
Moving beyond single particle distributions, additional information can be obtained by studying the correlations of particles. In heavy ion collisions, the most common multi-particle observable studied is the HBT correlation, named for Hanbury-Brown and Twiss who pioneered an analogous technique for studying the size of objects in astronomy [185, 186]. The procedure is most often applied to pairs of like-sign pions and depends on the quantum mechanical connection between separation in coordinate and momentum space for identical particles. The data are presented as the ratio of the distribution of pairs in some relative-momentum variable divided by a distribution which matches the correct occupancy of the two-particle phase space but which does not contain the effects of the two-particle correlation. This normalization is obtained by pairing particles found in different events which have been matched for centrality and other event-characterization variables. The resulting correlation functions can be fit using a variety of parameterizations of the source distributions. From such parameterizations, information about the spatiotemporal extent of the emission source can be extracted. One commonly used system is the so-called Bertsch-Pratt coordinates [191, 208, 209]. For a given pair of identical particles with average momentum , the coordinates are: longitudinal () along the beam direction (), outwards () in the (, ) plane perpendicular to , and sidewards () perpendicular to the other two directions. The Yano-Koonin-Podgoretskii parameterization also includes spatial parameters for the longitudinal and transverse sizes of the source, as well as parameters describing the duration and longitudinal velocity of the source [210, 211].
Appendix C Techniques for determining centrality
As briefly discussed in Appendix B, determining the centrality of a heavy ion collision is extremely important for event characterization. Knowing the centrality provides a geometrical scale for use in any studies of the underlying collision dynamics and affords the possibility of a more meaningful comparison to “baseline” data from elementary proton or electron collisions. The primary event centrality in PHOBOS is determined by utilization of signals from the Paddle scintillator counters, as well as the Octagon and Ring silicon detectors, all of which are sensitive to charged particle multiplicities in various regions of pseudorapidity. These signals, through bins in the percentage of total cross section, provide a measure of centrality. The validity of this technique is based on the experimental observation of a strong correlation between the charged particle multiplicity signals in, for example, the Paddle scintillator counters and neutral beam “remnants” (spectator neutrons) as measured in the Zero-Degree-Calorimeters (ZDCs). This correlation is shown in Fig. 37 for =200 GeV Au+Au collisions at PHOBOS.
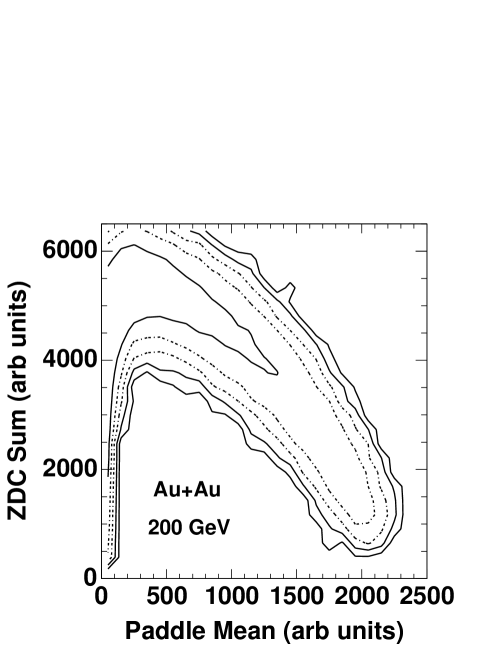
The specific methods developed within PHOBOS to determine centrality depend on both the collision species (Au+Au versus d+Au) and the collision energy. The technique is to associate an experimentally measured signal to a well-defined centrality related variable, such as the number of participating nucleons, . For this technique to be meaningful, a monotonic relation must exist between the multiplicity signals in the chosen region of pseudorapidity and . This assumption is justified by the experimental correlation shown in Fig. 37 (the remnant neutrons are anti-correlated with for the 50% most central collisions). Additional evidence for the validity of this technique has been obtained using extensive Monte Carlo (MC) studies using event generators (such as HIJING, AMPT, RQMD, and Venus) and a full GEANT simulation of the PHOBOS detector. An outline of some of these techniques follows.
C.1 Centrality determination in Au+Au collisions
There are four main considerations that must be addressed in the course of determining the event centrality: the event selection, detection efficiency, choice of pseudorapidity region to utilize, and the event generator simulations to extract .
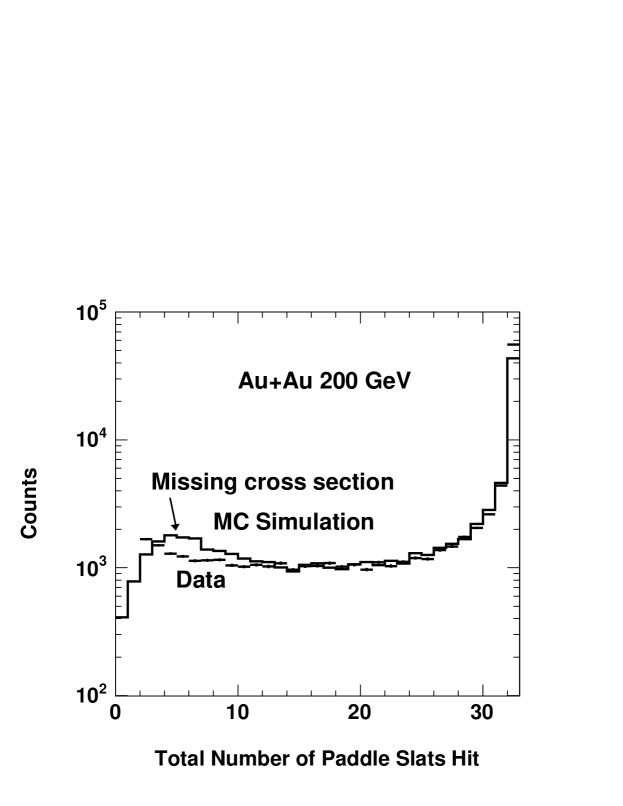
The initial event selection must cleanly identify and separate true Au+Au collisions from numerous background sources, such as beam-gas interactions, while simultaneously providing the smallest possible bias on the resulting data set. In PHOBOS this was accomplished by using a combination of energy and time signals from the Paddle counters and the ZDCs. A selection of events with less than 4 ns time-difference between the two Paddle signals was combined with cuts on the ZDC individual and summed timing signals. Additional logic ensured no loss of very central events that have a high Paddle signal and correspondingly few numbers of spectator neutrons available to hit the ZDCs. This selection provided a basic “valid collision” definition for Au+Au collisions at =62.4, 130 and 200 GeV. For the lowest energy Au+Au collision of =19.6 GeV, the ZDC timing requirement had to be modified due to the substantially reduced efficiency for detection of the lower energy neutrons.
The detector efficiency was determined for two “minimum-bias” trigger configurations of at least one (two) hits in each scintillator Paddle counter array. For both configurations, a loss of peripheral events had to be accounted for before bins in percentage of total cross section could be correctly fashioned. The fraction of lost peripheral events was determined using comparisons of the total number of Paddle slats hit in both data and the full MC simulations (see Fig. 38). This analysis yielded a total detection efficiency of 97% and 88% for the two trigger configurations, respectively, for Au+Au collisions at =200 GeV.
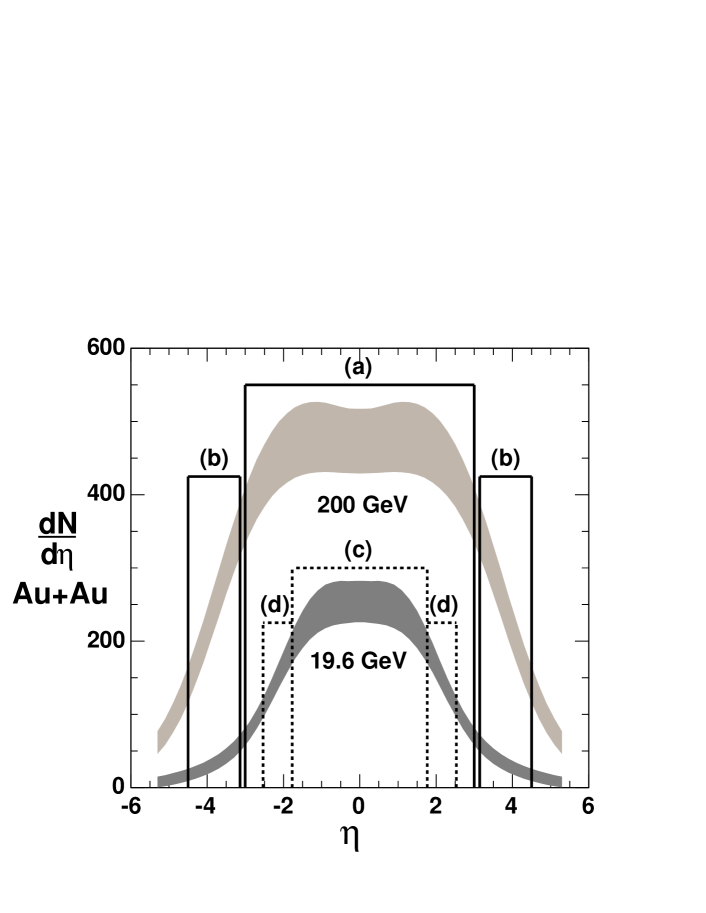
Using the collision event selection criteria outlined above and the deduced trigger detection efficiency, the next task is to find an appropriate experimental quantity for use in determining the event centrality. For Au+Au collisions, a consistent centrality determination was found to be relatively independent of the choice of detector (and hence the pseudorapidity limits), as long as the chosen region contained substantial particle multiplicity. The signal from the Paddle counters, with a pseudorapidity coverage of (region (b) of Fig. 39), worked well as a centrality measure for collision energies of =62.4, 130 and 200 GeV.
For the lowest energy of 19.6 GeV, new pseudorapidity regions had to be chosen due to a reduction in the monotonicity between the multiplicity signals in the Paddle counters and both the number of spectator neutrons seen in the ZDCs and , as determined from MC simulations. In addition, the Paddles are traversed by significantly fewer particles at 19.6 than 200 GeV (see dark grey band in Fig. 39 or the bottom panel of Fig. 1) and, consequently, a different pseudorapidity region had to be chosen. In order to create a centrality measure at 19.6 GeV similar to that obtained from the Paddles at 200 GeV, the Paddle pseudorapidity range was scaled down to a smaller region by the ratio of beam rapidities (region (d) of Fig. 39). The resulting region, , lies wholly within the Octagon silicon detector coverage of for collisions which occur within 10 cm of the nominal vertex position. Thus, the charged particle multiplicity measured in the region (d) was used as a centrality measure for 19.6 GeV and allowed for a direct centrality comparison to the original Paddle-based method at 200 GeV. Additional centrality measures were developed at both energies, in pseudorapidity regions close to midrapidity, which used the multiplicity signals of charged particles traversing the Octagon in the pseudorapidity regions (a) and (c), where region (c) is scaled by a factor of 0.563 compared to region (a). This technique of matching centrality regions allowed direct comparisons of midrapidity and away from midrapidity centrality determinations across a factor of ten in collision energy. Also, both pseudorapidity regions have been found to have very different rates of particle production and intrinsic dependences on . By utilizing these two independent regions, the assumption that the centrality measure and have to be only monotonic and not necessarily linear can be explicitly tested. An insignificant difference was found when analyzing data with both methods, at both energies [49].
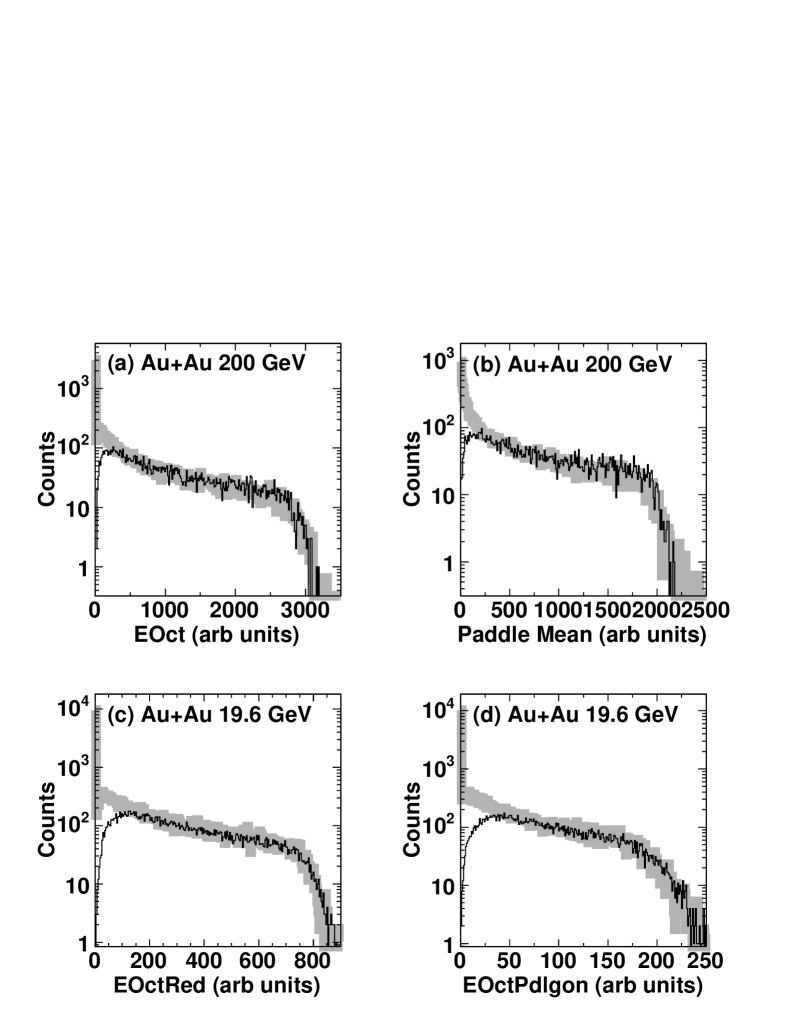

Use of the Octagon silicon detector signals as a centrality measure introduces an additional complication not present for the Paddle counters. The precise vertex position of each event is required for the merging and angle correction of valid hits in the Octagon. PHOBOS has developed several techniques to determine the primary collision vertex, including use of the Vertex detector and straight-line tracks in the first six planes of the Spectrometer. However, due to the requirement of any of these valid vertices, the resulting data set is not only biased by the intrinsic trigger efficiency, but also by the vertex reconstruction efficiency. Additional inefficiencies are introduced for low multiplicity events and this fact is the primary reason that PHOBOS has, thus far, only published data for the top 50% of cross section for Au+Au data, where there are no such inefficiencies. Despite these additional complications, exploiting the Octagon detector signals as a centrality measure greatly expands the available solid angle for centrality determination. As shown in Fig. 40, a good match between the data and MC simulations in all regions of pseudorapidity shown in Fig. 39 gives confidence in the validity of the procedure.
Once the choice of pseudorapidity region for the centrality determination is made and the corresponding efficiency is determined, the resulting multiplicity related distribution can be divided into percentile of total cross section bins, as illustrated in Fig. 41, panels (a) and (b). Comprehensive MC simulations of these signals, that include Glauber model calculations of the collision geometry, allow the estimation of for a cross section bin, as illustrated in Fig. 41, panels (c) and (d). The most central collisions (b0, see Fig. 35) will have the largest number of participants with the obvious upper limit of =394 for a “perfectly central” Au+Au collision, where all nucleons interact.
Systematic uncertainties on the extracted values of were determined with MC simulations that included possible errors in the overall detection efficiency and also utilized different types of event generators. The uncertainty on the deduced increased from 3% for central collisions to 9% for mid-peripheral.
| Energy | A | syst | stat | B | syst | stat | |
|---|---|---|---|---|---|---|---|
| 19.6 | 33 | 0.310 | 0.013 | 0.001 | 1.356 | 0.007 | 0.001 |
| 62.4 | 36 | 0.296 | 0.012 | 0.001 | 1.376 | 0.007 | 0.001 |
| 130 | 41 | 0.274 | 0.016 | 0.001 | 1.408 | 0.010 | 0.001 |
| 200 | 42 | 0.271 | 0.016 | 0.001 | 1.413 | 0.010 | 0.001 |
In principle, could be extracted from the same elaborate simulation procedure used for . In practice, however, three issues arise. First, the ratio of over varies dramatically with centrality (see bottom panel of Fig. 36), but the experimental observables used in the centrality determination, when normalized by , depend only weakly on centrality (see, for example, Figs. 12 and 29). Secondly, while the relationship between and is very sensitive to the assumed nucleon-nucleon cross-section, the correspondence between the observables and is relatively insensitive to such changes. In contrast, factors which strongly impact the extraction of , such as the overall detection efficiency and the detailed properties of the produced particles, have no influence on the correspondence between and . For these reasons, it was found more effective to determine the values and systematic uncertainties for from the derived values of by using a parameterization of the results of a Glauber calculation (see Appendix B.1 and Fig. 36). Specifically, the results of the simulation are fit to a power law of the form with the parameters given in Table 2. The systematic errors of the fit procedure are determined by fitting different ranges of the data. Since the two parameters are highly anti-correlated (the normalized correlation coefficient ranges from -0.997 to -0.998), the changes observed in the different fits, and hence the deduced systematic errors, are highly correlated. This functional form works well down to values of but begins to deviate by 10–20% for smaller values. Tables 3 and 4 summarize the values of and and their systematic uncertainties for the centrality bins used for Au+Au at =62.4 and 200 GeV.
It should be noted that additional physics considerations may impact the extracted value of . As one example, the results of a straightforward Glauber simulation can be compared to the output of the HIJING code for Au+Au at =200 GeV. At all impact parameters, the numbers for are equal in the two cases to within 10 particles or less (with the HIJING value consistently higher). In contrast, from HIJING is found to be lower by roughly 10% (resulting from the particular implementation of nuclear shadowing in the code [101]), with a slight increase in the difference for more central collisions.
| Bin | syst | syst 1 | syst 2 | syst 3 | syst T | ||
|---|---|---|---|---|---|---|---|
| 45-50% | 61 | 7 | 85 | 13 | 3 | 4 | 14 |
| 35-45% | 86 | 9 | 136 | 20 | 4 | 7 | 22 |
| 25-35% | 130 | 10 | 240 | 26 | 7 | 12 | 29 |
| 15-25% | 189 | 9 | 402 | 27 | 12 | 20 | 36 |
| 6-15% | 266 | 9 | 643 | 30 | 19 | 32 | 48 |
| 0-6% | 335 | 11 | 883 | 40 | 26 | 44 | 65 |
| Bin | syst | syst 1 | syst 2 | syst 3 | syst T | ||
|---|---|---|---|---|---|---|---|
| 45-50% | 65 | 4 | 99 | 9 | 3 | 5 | 11 |
| 35-45% | 93 | 5 | 164 | 12 | 5 | 8 | 15 |
| 25-35% | 138 | 6 | 286 | 18 | 9 | 14 | 25 |
| 15-25% | 200 | 8 | 483 | 28 | 15 | 24 | 40 |
| 6-15% | 276 | 9 | 762 | 35 | 23 | 38 | 57 |
| 0-6% | 344 | 11 | 1040 | 47 | 31 | 52 | 77 |
C.2 Centrality determination in d+Au collisions
The centrality determination for d+Au collisions at =200 GeV incorporates the same considerations necessary for Au+Au collisions, however the details of the analysis techniques differ.
The initial definition of a ‘valid collision’ took on a different form, as the most basic event selection could not be defined cleanly from the timing signals of the Paddles. The asymmetric nature of the collision system resulted in very different particle multiplicities impinging on the two symmetrically located Paddle trigger counters, which caused an overall reduction in the timing resolution compared to that of the Au+Au collision system. Previous requirements of a ZDC detector timing coincidence were also no longer possible due to the unacceptable bias that would be imposed on the dataset. To ensure that the events analyzed were real collisions occurring in a usable proximity to the detector, a reconstructed collision vertex was required.
Lower total multiplicities precluded the high resolution track-based vertex reconstruction algorithms developed for Au+Au collisions (0.04 cm for central collisions) as it became increasingly inefficient. A more efficient, but less accurate (0.8 cm for central collisions) vertex reconstruction method based on global averaging techniques across the entire Octagon was created. This selection coupled with the intrinsic triggering of the system was estimated to have an overall efficiency of 83% for d+Au collisions at 200 GeV. This high efficiency data set was used for more global physics analyses, such as the centrality dependence of the distribution.
In addition to the Octagon-based vertex determination, a new on-line fast vertex position derived from the T0 Čerenkov counters (see Appendix A) was developed for the d+Au collision data. This T0 time-difference-based method was utilized as a primary trigger for some of the data sets. In addition, the fully calibrated T0 signals were used in an off-line vertex-finding algorithm which, combined with the new Octagon-based algorithm discussed above, provided a very clean event selection. An additional benefit of on-line vertex triggering from the T0 detectors was the enhancement of the fraction of data occurring near the center of the detector ( cm). A Paddle-triggered dataset in d+Au allowed data to be written for collisions occurring within approximately 2 m of the center of the interaction region. The additional (T0) requirement forced a larger bias on the data than the Paddles and Octagon vertices alone and further reduced the overall trigger+vertex efficiency to 49%, but resulted in a much higher fraction of usable data that provided significantly improved statistics necessary for many Spectrometer-based analyses.
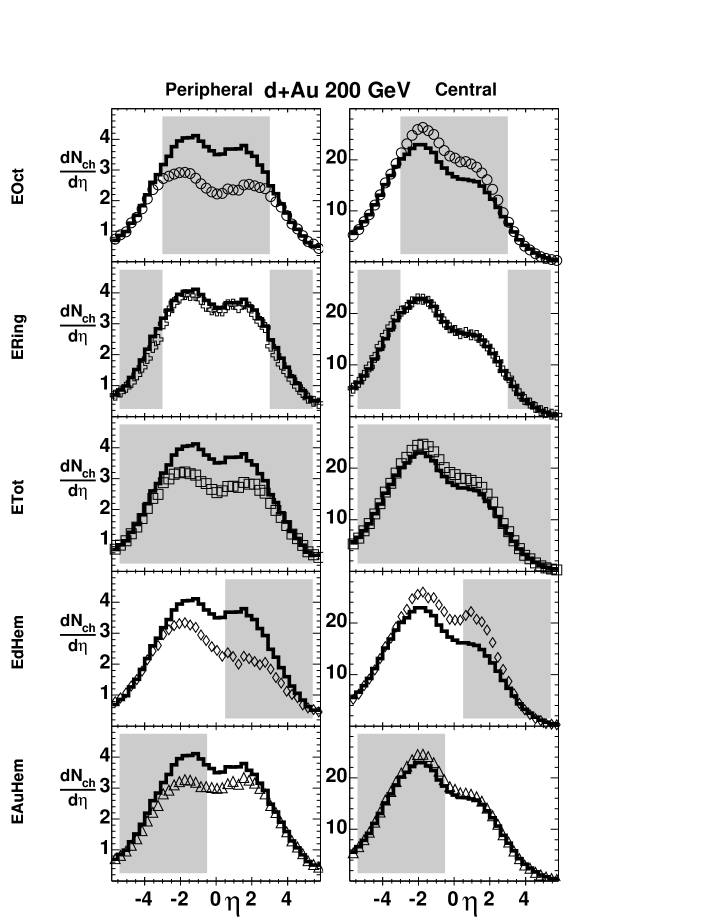
The more significant challenge in the d+Au data analysis was to extract the centrality dependence of various physics analyses without the centrality measure itself directly influencing the outcome as a result of strong auto-correlations. This issue is not a major factor when measuring quantities for a minimum-bias configuration [57], but it becomes a significant consideration for any detailed studies requiring a centrality definition. In these cases, unlike Au+Au collisions, the centrality determination for d+Au collisions was found to be strongly dependent on the choice of pseudorapidity region utilized in the analysis. This fact is illustrated with MC simulated data in Fig. 42, where strong auto-correlation biases are seen in the reconstructed pseudorapidity distributions for four of the five different centrality methods explored. Specifically a suppression of midrapidity yields () in the reconstructed spectrum for peripheral collisions is observed (left column of Fig. 42). The opposite effect is observed for central collisions, i.e. enhancement at midrapidity (right column of Fig. 42). This study utilized five different centrality definitions that each covered different regions of pseudorapidity: the Octagon detector (), the Ring detectors (), the combined coverage of Octagon and Rings (), the deuteron direction () and the gold direction (). Both HIJING and AMPT based MC simulations indicated that a centrality measure based on the signals in the Ring counters provided the least bias on the measurement.
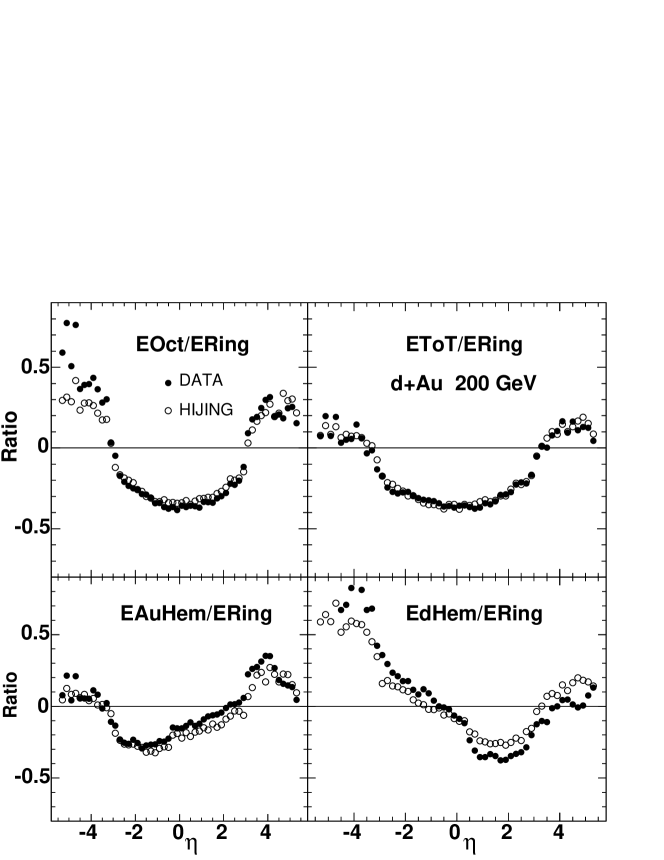
Additional support for using the MC based simulations to select the best centrality measure is given in Fig. 43. Ratios of the reconstructed distributions obtained from four centrality measures relative to that obtained using the variable are shown for both MC simulations and data. These ratios are found to be in very good agreement. This information, which is based on data and MC simulation independently, provides the necessary confidence that using the Ring detectors for the centrality measure will provide the most accurate experimental result. It is important to point out that this study only provided guidance as to the choice of the Rings for the experimental centrality measure, and the final experimentally measured distributions do not rely on the details of the MC simulation.
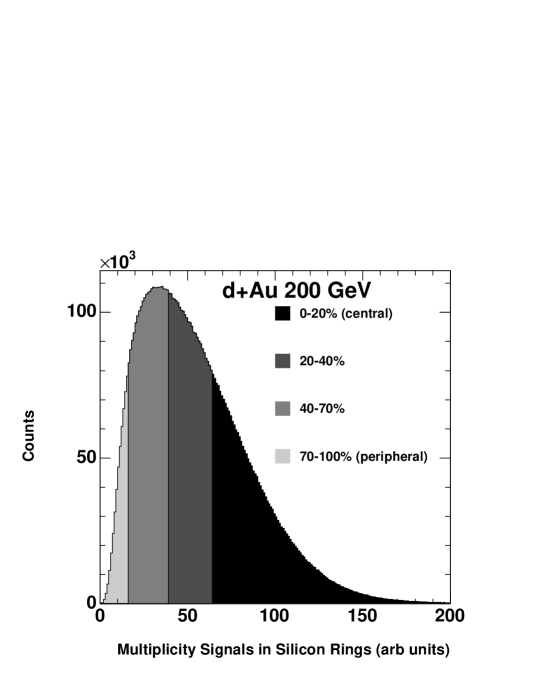
The choice of the Ring detectors for use in the centrality determination for d+Au collisions, along with the extracted efficiency, allows for the creation of centrality bins based on percentage of cross section. For d+Au, a centrality determination is desired over the entire range of peripheral to central collisions. Thus, corrections must be made to both the location of the bins and the extracted values to properly account for the inefficiencies in detecting peripheral collisions. These corrections were made based on extensive MC simulations using both the HIJING and AMPT event generators. For the case of the T0 triggered dataset, the centrality determination was reanalyzed in terms of the efficiency associated with each cross section bin and the associated . The additional requirement of hits (particles) in the T0 detectors serves to push the average higher, with the largest shifts for lower centrality classes. An example of the resulting centrality bins on the Ring signal distributions for four-bins of cross section are shown in Fig. 44. The decreasing efficiency for more peripheral collisions is immediately evident.
Systematic uncertainties on the deduced average values for each percentile bin of cross section were determined with additional simulations. In these studies, the distribution taken directly from Glauber model calculations was matched to the measured centrality related variable, i.e. , distribution from data, and the average corresponding was extracted for each centrality bin. Many different effects, including various types of detector resolution smearing, possible non-linear dependencies of the measured centrality variable on , and different deuteron wave functions, were included and the analysis repeated. These studies showed that the mean value of estimated from the full HIJING (or AMPT) + GEANT detector simulation was reasonable and the systematic error on reaches 30% for the most peripheral centrality bin, where the overall bias is greatest.
References
- [1] H. Kastrup, P. Zerwas, eds., QCD 20 Years Later (World Scientific, Singapore, 1993).
- [2] S. Eidelman, et al., (Particle Data Group), Phys. Lett. B 592 (2004) 1.
- [3] D. J. Gross, F. Wilczek, Phys. Rev. Lett. 30 (1973) 1343.
- [4] H. Politzer, Phys. Rev. Lett. 30 (1973) 1346.
- [5] The work in references [3] and [4] was recognized by the 2004 Nobel Prize in Physics; http://nobelprize.org/physics/laureates/2004/.
- [6] J. C. Collins, M. J. Perry, Phys. Rev. Lett. 34 (1975) 1353.
- [7] E. V. Shuryak, Phys. Reports 61 (1980) 71.
- [8] H. Satz, ed., Statistical Mechanics of Quarks and Hadrons, (North-Holland, 1981).
- [9] D. J. Gross, R. D. Pisarski, L. G. Yaffe, Rev. Mod. Phys. 53 (1981) 43.
- [10] H. Pagels, Phys. Reports 16 (1975) 219.
- [11] W. Marciano, H. Pagels, Phys. Reports 36 (1978) 137.
- [12] R.D. Pisarski, F. Wilczek, Phys. Rev. D 29 (1984) 338.
- [13] K. Rajagopal, Acta Phys. Pol. B 31 (2000) 3021; arXiv:hep-ph/0009058 (2000).
- [14] F. Karsch, Nucl. Phys. A 698 (2002) 199.
- [15] T. Schäfer, arXiv:hep-ph/0304281 (2003).
- [16] M. G. Alford, Ann. Rev. Nucl. Part. Sci. 51 (2001) 131.
- [17] K. Rajagopal, F. Wilczek, arXiv:hep-ph/0011333 (2000).
- [18] G. Baym, S. A. Chin, Phys. Lett. B 62 (1976) 241.
- [19] G. Chapline, M. Nauenberg, Phys. Rev. D 16 (1977) 450.
- [20] G. F. Chapline, M. H. Johnson, E. Teller, M. S. Weiss, Phys. Rev. D 8 (1973) 4302.
- [21] See Proceedings of the International Conference on Ultra-Relativistic Nucleus-Nucleus Collisions:Quark Matter; J. Phys. G 30 (2004) S633; Nucl. Phys. A 715 (2003) 1c; ibid. A 698 (2002) 1c; ibid. A 661 (1999) 1c; ibid. A 638 (1998) 1c; ibid. A 610 (1996) 1c; ibid. A 590 (1995) 1c; ibid. A 566 (1994) 1c; ibid. A 544 (1992) 1c; ibid. A 525 (1991) 1c; ibid. A 498 (1989) 1c; Z. Phys. C 38 (1988) 1; Nucl. Phys. A 461 (1987) 1c; “Quark Matter ’84”, K. Kajantie, ed. (Springer Verlag, 1985); Nucl. Phys. A 418 (1984) 1c; Quark Matter Formation and Heavy Ion Collisions, Proceedings of the Bielefeld Workshop 1982, M. Jacob, H. Satz, eds. (WSPC, Singapore, 1983); Phys. Reports 88 (1982) 321; Workshop on future relativistic heavy ion experiments, R. Bock, R. Stock, eds., (Darmstadt, 1980).
- [22] P. M. Jacobs, X. -N. Wang, Prog. Part. Nucl. Phys. 54 (2005) 443; arXiv:hep-ph/0405125 (2004).
- [23] R. C. Hwa, X. -N. Wang, eds., Quark Gluon Plasma 3 (World Scientific, Singapore, 2003).
- [24] P. F. Kolb, U. Heinz, in Quark-Gluon Plasma 3 (World Scientific, Singapore, 2003); arXiv:nucl-th/0305084 (2003).
- [25] D. H. Rischke, Prog. Part. Nucl. Phys. 52 (2004) 197.
- [26] White Papers from BRAHMS, PHENIX, and STAR, submitted to Nucl. Phys. A.
- [27] K. Kanaya, Nucl. Phys. A 715 (2003) 233c.
- [28] M. Plümer, S. Raha, R. M. Weiner, Nucl. Phys. A 418 (1984) 549c.
- [29] E. V. Shuryak, Nucl. Phys. A 750 (2005) 64.
- [30] E. V. Shuryak, Prog. Part. Nucl. Phys. 53 (2004) 273.
- [31] G. T. Horowitz, A. Strominger, Nucl. Phys. B 360 (1991) 197.
- [32] S. S. Gubser, I. R. Klebanov, A. A. Tseytlin, Nucl. Phys. B 534 (1998) 202.
- [33] F. Karsch, S. Datta, E. Laermann, P. Petreczky, S. Stickan, I. Wetzorke, Nucl. Phys. A 715 (2003) 701.
- [34] E. V. Shuryak, I. Zahed, Phys. Rev. C 70 (2004) 021901R.
- [35] K. Kajantie, M. Laine, K. Rummukainen, Y. Schröder, Phys. Rev. D 67 (2003) 105008.
- [36] F. Karsch, J. Phys. G 30 (2004) S887.
- [37] M. D’Elia, M. P. Lombardo, arXiv:hep-lat/0409010 (2004).
- [38] S. Ejiri, C. R. Allton, M. Doering, S. J. Hands, O. Kaczmarek, F. Karsch, E. Laermann, K. Redlich, arXiv:hep-lat/0408046 (2004).
- [39] Z. Fodor, S. D. Katz, Jour. High Ener. Phys. 0404 (2004) 50; arXiv:hep-lat/0402006 (2004).
- [40] P. de Forcrand, O. Philipsen, Prog. Theor. Phys. Suppl. 153 (2004) 127.
- [41] C. T. H. Davies, et al., (HPQCD and UKQCD), Phys. Rev. Lett. 92 (2004) 022001.
- [42] E. Laermann, O. Philipsen, Ann. Rev. Nucl. Part. Sci. 53 (2003) 163.
- [43] F. Karsch, Lect. Notes Phys. 583 (2002) 209.
- [44] B. B. Back, et al., (PHOBOS), Phys. Rev. Lett. 91 (2003) 052303.
- [45] B. B. Back, et al., (PHOBOS), Phys. Rev. Lett. 85 (2000) 3100.
- [46] B. B. Back, et al., (PHOBOS), Phys. Rev. C 65 (2002) 031901R.
- [47] B. B. Back, et al., (PHOBOS), Phys. Rev. Lett. 88 (2002) 022302.
- [48] B. B. Back, et al., (PHOBOS), Phys. Rev. C 65 (2002) 061901R.
- [49] B. B. Back, et al., (PHOBOS), Phys. Rev. C 70 (2004) 021902R.
- [50] S. V. Afanasiev, et al., (NA49), Phys. Rev. C 66 (2002) 054902.
- [51] T. Anticic, et al., (NA49), Phys. Rev. C 69 (2004) 024902.
- [52] L. Ahle, et al., (E866), Phys. Rev. C 57 (1998) 466R.
- [53] B. B. Back, et al., (E917), Phys. Rev. C 66 (2002) 054901.
- [54] L. Ahle, et al., (E866), Phys. Lett. B 490 (2000) 53.
- [55] J. L. Klay, et al., (E895), Phys. Rev. C 68 (2003) 054905.
- [56] J. Dunlop, Mass. Inst. of Tech. PhD. Thesis (1999).
- [57] B. B. Back, et al., (PHOBOS), Phys. Rev. Lett. 93 (2004) 082301.
- [58] K. J. Eskola, Nucl. Phys. A 698 (2002) 78c.
- [59] S. A. Bass, et al., Nucl. Phys. A 661 (1999) 205c.
- [60] X.-N. Wang, in [59], 210c (1999).
- [61] B. Zhang, in [59], 220c (1999).
- [62] H. Sorge, in [59], 217c (1999); arXiv:nucl-th/9905008 (1999).
- [63] M. Bleicher, in [59], 218c (1999).
- [64] W. Cassing, in [59], 222c (1999).
- [65] H. J. Drescher, in [59], 216c (1999).
- [66] A. Capella, A. Kaidalov, J. Tran Thanh Van, Heavy Ion Phys. 9 (1999) 169; arXiv:hep-ph/9903244 (1999).
- [67] J. Ranft, arXiv:hep-ph/9911213 (1999).
- [68] N. Armesto, C. Pajares, Int. J. Mod. Phys. A 15 (2000) 2019; arXiv:hep-ph/0002163 (2000).
- [69] S. Jeon, J. Kapusta, Contest on the RHIC predictions, June 2000.
- [70] K. J. Eskola, K. Kajantie, P. V. Ruuskanen, K. Tuominen, Nucl. Phys. B 570 (2000) 379.
- [71] S. A. Bass, et al., Phys. Rev. C 60 (1999) 021902.
- [72] J. Stachel, in [59], 226c (1999).
- [73] A. Krasnitz, R. Venugopalan, Phys. Rev. Lett 86 (2001) 1717.
- [74] D. Kharzeev, E. Levin, Phys. Lett. B 523 (2001) 79.
- [75] D. Kharzeev, E. Levin, L. McLerran, Phys. Lett. B 561 (2003) 93.
- [76] D. Kharzeev, Y.V. Kovchegov, K. Tuchin, Phys. Lett. B 599 (2004) 23.
- [77] B. B. Back, et al., (PHOBOS), Phys. Rev. Lett. 91 (2003) 072302.
- [78] B. B. Back, et al., (PHOBOS), Phys. Rev. C 70 (2004) 061901(R).
- [79] I. Arsene, et al., (BRAHMS), Phys. Rev. Lett. 93 (2004) 242303.
- [80] M.X. Liu, et al., (PHENIX), J. Phys. G 30 (2004) S1193.
- [81] A. Accardi, arXiv:nucl-th/0405046 (2004).
- [82] K. Adcox, et al., (PHENIX), Phys. Rev. Lett. 87 (2001) 052301.
- [83] J. Adams, et al., (STAR), Phys. Rev. C 70 (2004) 054907.
- [84] B. B. Back, et al., (PHOBOS), Phys. Lett. B 578 (2004) 297.
- [85] B. B. Back, et al., (PHOBOS), Phys. Rev. C 70 (2004) 051901(R).
- [86] S. S. Adler, et al., (PHENIX), Phys. Rev. C 69 (2004) 034909.
- [87] J. D. Bjorken, Phys. Rev. D 27 (1983) 140.
- [88] E. Fermi, Prog. Theor. Phys. 5 (1950) 570.
- [89] R. Hagedorn, Nuovo Cim. Suppl. 3 (1965) 147.
- [90] R. Hagedorn, J. Ranft, Nuovo Cim. Suppl. 6 (1968) 169.
- [91] B. B. Back, et al., (PHOBOS), Phys. Rev. Lett. 87 (2001) 102301.
- [92] B. B. Back, et al., (PHOBOS), Phys. Rev. C 67 (2003) 021901R.
- [93] I. G. Bearden, et al., (NA44), Phys. Lett. B 388 (1996) 431.
- [94] J. Bächler, et al., (NA49), Nucl. Phys. A 661 (1999) 45.
- [95] L. Ahle, et al., (E866), Phys. Rev. C 60 (1999) 064901.
- [96] L. Ahle, et al., (E866), Phys. Rev. Lett. 81 (1998) 2650.
- [97] F. Becattini, J. Cleymans, A. Keränen, E. Suhonen, K. Redlich, Phys. Rev. C 64 (2001) 024901.
- [98] F. Becattini, Z. Phys. C 69 (1996) 485.
- [99] P. Braun-Munzinger, I. Heppe, J. Stachel, Phys. Lett. B 465 (1999) 15.
- [100] B. B. Back, et al., (PHOBOS), Phys. Rev. C 70 (2004) 011901R.
- [101] M. Gyulassy, X. N. Wang, Comput. Phys. Commun. 83 (1994) 307; HIJING v1.383 used for d+Au, and v1.35 used for Au+Au.
- [102] H. Sorge, Phys. Rev. C 52 (1995) 3291; version 2.4 including rope formation was used.
- [103] Z. W. Lin, S. Pal, C. M. Ko, B. A. Li, B. Zhang, Phys. Rev. C 64 (2001) 011902.
- [104] B. Zhang, C. M. Ko, B. A. Li, Z. Lin, Phys. Rev. C 61 (2000) 067901.
- [105] C. Bernard, et al., (MILC), Phys. Rev. D 71 (2005) 034504.
- [106] F. Becattini, M. Gazdzicki, A. Keränen, J. Manninen and R. Stock, Phys. Rev. C 69 (2004) 024905.
- [107] B. B. Back, et al., (PHOBOS), Phys. Rev. Lett. 89 (2002) 222301.
- [108] B. B. Back, et al., (PHOBOS), submitted to Phys. Rev. C (RC); arXiv:nucl-ex/0407012 (2004).
- [109] K. H. Ackermann, et al., (STAR), Phys. Rev. Lett. 86 (2001) 402.
- [110] P. Huovinen, private communication of a calculation using the results of P. F. Kolb, P. Huovinen, U. W. Heinz, H. Heiselberg, Phys. Lett. B 500 (2001) 232.
- [111] W. Busza, in Particle Production in Highly Excited Matter, H. H. Gutbrod, J. Rafelski, eds., (Plenum Press, Proceedings of a NATO Advanced Study Institute on Particle Production in Highly Excited Matter, 1993) p. 149.
- [112] J. C. Collins, D. E. Soper, G. Sterman, Nucl. Phys. B 261 (1985) 104.
- [113] J. C. Collins, D. E. Soper, G. Sterman, in Perturbative QCD, A.H. Mueller, ed., (World Scientific, 1988); Adv. Ser. Direct. High Energy Phys. 5 (1988) 1.
- [114] K. Adcox, et al., (PHENIX), Phys. Rev. Lett. 88 (2002) 022301.
- [115] K. Adcox, et al., (PHENIX), Phys. Lett. B 561 (2003) 82.
- [116] B. B. Back, et al., (PHOBOS), Phys. Rev. Lett. 94 (2005) 082304.
- [117] J. W. Cronin, H. J. Frisch, M. J. Shochet, J. P. Boymond, P. A. Piroué, R. L. Sumner, Phys. Rev. D 11 (1975) 3105.
- [118] D. Antreasyan, J. W. Cronin, H. J. Frisch, M. J. Shochet, L. Kluberg, P. A. Piroué, R. L. Sumner, Phys. Rev. D 19 (1979) 764.
- [119] A. Accardi, arXiv:hep-ph/0212148 (2002).
- [120] I. Vitev. Phys. Lett. B 562 (2003) 36.
- [121] I. Arsene, et al., (BRAHMS), Phys. Rev. Lett. 91 (2003) 072305.
- [122] S. S. Adler, et al., (PHENIX), Phys. Rev. Lett. 91 (2003) 072303.
- [123] J. Adams, et al., (STAR), Phys. Rev. Lett. 91 (2003) 072304.
- [124] C. Adler, et al., (STAR), Phys. Rev. Lett. 90 (2003) 082302.
- [125] J. Adams, et al., (STAR), Phys. Rev. Lett. 93 (2004) 252301.
- [126] S. S. Adler, et al., (PHENIX), Phys. Rev. Lett. 91 (2003) 182301.
- [127] J. Adams, et al., (STAR), Phys. Rev. Lett. 92 (2004) 052302.
- [128] D. Molnar, S. A. Voloshin, Phys. Rev. Lett. 91 (2003) 092301.
- [129] B. B. Back, et al., (PHOBOS), submitted to Phys. Rev. C(RC); arXiv:nucl-ex/0301017 (2003).
- [130] J. Klay, U.C. Davis PhD. Thesis (2001).
- [131] S. Eidelman, et al., (Particle Data Group), Phys. Lett. B 592 (2004) 1.
-
[132]
G. I. Veres, Eötvös Loránd University PhD. Thesis,
http://na49info.cern.ch/cgi-bin/wwwd-util/NA49/NOTE?292 (2002). - [133] A. E. Brenner, et al., Phys Rev D 26 (1982) 1497.
- [134] M. Basile, et al., Phys. Lett. B 92 (1980) 367.
- [135] M. Basile, et al., Phys. Lett. B 95 (1980) 311.
- [136] B. B. Back, et al., (E917), Phys. Rev. Lett. 86 (2001) 1970.
- [137] A. H. Mueller, Nucl. Phys. B 213 (1983) 85.
- [138] B. B. Back, et al., (PHOBOS), submitted to Phys. Rev. Lett.; arXiv:nucl-ex/0409021 (2004).
- [139] I. G. Bearden, et al., (BRAHMS), Phys. Rev. Lett. 93 (2004) 102301.
- [140] W. Busza, A. S. Goldhaber, Phys. Lett. B 139 (1984) 235.
- [141] W. Busza, R. Ledoux, Ann. Rev. Nucl. Part. Sci. 38 (1988) 119.
- [142] G. J. Alner, et al., (UA5), Phys. Rep. 154 (1987) 247.
- [143] J. E. Elias, et al., (E178), Phys. Rev. D 22 (1980) 13.
- [144] W. Busza, et al., (E178), Phys. Rev. Lett. 34 (1975) 836.
- [145] W. Busza, Acta Phys. Pol. B 8 (1977) 333.
- [146] A. Białas, M. Bleszyński, W. Czyż, Nucl. Phys. B 111 (1976) 461.
- [147] J. Whitmore, Phys. Rep. 10 (1974) 273.
- [148] J. Whitmore, Phys. Rep. 27 (1976) 187.
- [149] H. Bøggild, T. Ferbel, Ann. Rev. Nucl. Sci. 24 (1974) 247.
- [150] B. B. Back, et al., (PHOBOS), Phys. Rev. Lett. 87 (2001) 102303.
- [151] D. H. Brick, et al., (E565/570), Phys. Rev. D 41 (1990) 765.
- [152] C. DeMarzo, et al., (NA5), Phys. Rev. D 29 (1984) 2476.
- [153] C. Halliwell, et al., (E178), Phys. Rev. Lett. 39 (1977) 1499.
- [154] D. S. Barton, et al., (E451), Phys. Rev. D 27 (1983) 2580.
- [155] G. J. Alner, et al., (UA5), Z. Phys. C 33 (1986) 1.
- [156] H. Stenzel, (ALEPH), Contributed paper to ICHEP2000 (2000).
- [157] PYTHIA manual, T. Sjöstrand, Comp. Phys. Comm. 82 (1994) 74. JETSET 7.4 is currently part of the PYTHIA code.
- [158] B. B. Back, et al., (PHOBOS), Phys. Rev. C 71 (2005) 021901(R).
- [159] A. M. Rossi, G. Vannini, A. Bussi re, E. Albini, D. D’Alessandro, and G. Giacomelli, Nucl. Phys. B 84 (1975) 269.
- [160] K. Guettler, et al., Nucl. Phys. B 116 (1976) 77.
- [161] M. Banner, et al., (UA2), Phys. Lett. B 122 (1983) 322.
- [162] M. Aguilar-Benitez, et al., Z. Phys. C 50 (1991) 405.
- [163] G. Arnison, et al., (UA1), Phys. Lett. B 118 (1982) 167.
- [164] C. Albajar, et al., (UA1), Nucl. Phys. B 335 (1990) 261.
- [165] G. Bocquet, et al., (UA1), Phys. Lett. B 366 (1996) 434.
- [166] J. Benecke, T. T. Chou, C. N. Yang, E. Yen, Phys. Rev. 188 (1969) 2159.
- [167] T. T. Chou, C.-N. Yang, Phys. Rev. Lett. 25 (1970) 1072.
- [168] R. P. Feynman, Phys. Rev. Lett. 23 (1969) 1415.
- [169] R. P. Feynman, Photon-Hadron Interactions (W.A. Benjamin Inc., 1972) p. 237-249.
- [170] T. Sjöstrand, P. Edén, C. Friberg, L. Lönnblad, G. Miu, S. Mrenna, E. Norrbin, Comp. Phys. Comm. 135 (2001) 238.
- [171] T. Sjöstrand, L. Lönnblad, S. Mrenna, P. Skands, arXiv:hep-ph/0308153 (2003).
- [172] W. Thomé, et al., Nucl. Phys. B 129 (1977) 365.
- [173] P. Abreu, et al., (DELPHI), Phys. Lett. B 459 (1999) 397.
- [174] B. Andersson, in Proceedings VII International Colloquium on Multiparticle Reactions, Tutzing, 1976, and references therein.
- [175] K. Gottfried, in Proceedings V International Colloquium on Multiparticle Reactions, Uppsala, 1974.
- [176] N. N. Nikolaev, Sov. J. Part. Nucl. 12 (1981) 63, and references therein.
- [177] L. Stodolsky, in Proceedings VI International Colloquium on Multiparticle Reactions, Oxford, 1975.
- [178] I. Otterlund, et al., Nucl. Phys. B 142 (1978) 445, and references therein.
- [179] S. Fredriksson, et al., Phys. Rep. 144 (1987) 187, and references therein.
- [180] I. G. Bearden, et al., (BRAHMS), arXiv:nucl-ex/0403050 (2004).
- [181] I. G. Bearden, et al., (BRAHMS), Phys. Lett. B 523 (2001) 227.
- [182] I. G. Bearden, et al., (BRAHMS), Phys. Rev. Lett. 88 (2002) 202301.
- [183] P. F. Kolb, Proceedings of the 17th Winter Workshop on Nuclear Dynamics, Park City Utah 2001. Acta Phys. Hung. New Ser. Heavy Ion Phys. 15 (2002) 279; arXiv:nucl-th/0104089 (2001).
- [184] B. B. Back, et al., (PHOBOS), accepted for publication in Phys. Rev. Lett.; arXiv:nucl-ex/0406021 (2004).
- [185] R. Hanbury-Brown, R. Q. Twiss, Phil. Mag. Ser. 7, Vol. 45, No. 366 (1954) 663.
- [186] R. Hanbury-Brown, R. Q. Twiss, Nature 178 (1956) 1046.
- [187] B. Tomasik, U. A. Wiedemann, in Quark-Gluon Plasma 3 (World Scientific, Singapore, 2003); arXiv:hep-ph/0210250.
- [188] D. Rischke, M. Gyulassy, Nucl. Phys. A 597 (1996) 701.
- [189] T. Hirano, K. Tsuda, Phys. Rev. C 66 (2002) 054905.
- [190] S. Soff, arXiv:hep-ph/0202240 (2002).
- [191] S. Pratt, Phys. Rev. D 33 (1986) 1314.
- [192] B. B. Back, et al., (PHOBOS), submitted to Phys. Rev. C (RC); arXiv:nucl-ex/0409001 (2004).
- [193] J. Adams, et al., (STAR), Phys. Rev. Lett. 93 (2004) 012301.
- [194] S. S. Adler, et al., (PHENIX), Phys. Rev. Lett. 93 (2004) 152302.
- [195] M. D. Baker, Proc. of the Eighteenth Lake Louise Winter Institute; arXiv:nucl-ex/0309002 (2003).
- [196] T. Renk, Phys. Rev. C 70 (2004) 021903R.
- [197] D. Teaney, arXiv:nucl-th/0301099 (2003).
- [198] H. Appelshäuser, et al., (NA49), Eur. Phys. J. C 2 (1998) 661.
- [199] R. E. Ansorge, et al., Z. Phys. C 43 (1989) 357.
- [200] D. Kharzeev, M Nardi, Phys. Lett. B 507 (2001) 121.
- [201] D. Kharzeev, E. Levin, M. Nardi, arXiv:hep-ph/0111315 (2001).
- [202] A. Breakstone, et al., Z. Phys. C 69 (1995) 55.
- [203] D. Drijard, et al., Nucl. Phys. B 208 (1982) 1.
- [204] B. B. Back, et al., (PHOBOS), Nucl. Inst. Meth. A 499 (2003) 603.
- [205] B. B. Back, et al., (PHOBOS), Nucl. Inst. Meth. A 447 (2000) 257.
- [206] B. B. Back, et al., (PHOBOS), Nucl. Phys. B Proc. Sup. 78 (1999) 245.
- [207] B. B. Back, et al., (PHOBOS), Nucl. Inst. Meth. A 419 (1998) 549.
- [208] G. F. Bertsch, Nucl. Phys. A 498 (1989) 173.
- [209] U. Heinz, Nucl. Phys. A 610 (1996) 264.
- [210] F. Yano, S. Koonin, Phys. Lett. B 78 (1978) 556.
- [211] M. Podgoretskii, Sov. J. Nucl. Phys. 37 (1983) 272.