PHENIX Collaboration
Systematic Studies of the Centrality and Dependence of the and in Heavy Ion Collisions at Mid-rapidity
Abstract
The PHENIX experiment at RHIC has measured transverse energy and charged particle multiplicity at mid-rapidity in collisions at = 19.6, 130 and 200 GeV as a function of centrality. The presented results are compared to measurements from other RHIC experiments, and experiments at lower energies. The dependence of and per pair of participants is consistent with logarithmic scaling for the most central events. The centrality dependence of and is similar at all measured incident energies. At RHIC energies the ratio of transverse energy per charged particle was found independent of centrality and growing slowly with . A survey of comparisons between the data and available theoretical models is also presented.
pacs:
25.75.DwI Introduction
The PHENIX experiment at the Relativistic Heavy Ion Collider (RHIC) at Brookhaven National Laboratory was designed to measure the properties of matter at extremely high temperatures and densities. Under such conditions, the possibility exists to produce states of matter that have not been observed and studied in the laboratory. Perhaps the best known of these is the quark-gluon plasma (QGP), matter in which the quarks are not confined within individual baryons but exist as some form of plasma of individual quarks and gluons. It should be emphasized that the exact properties of this matter are not known and that the characterization of the deconfined state, if such a state is produced, will form an essential part of the RHIC program.
One fundamental element of the study of ultrarelativistic collisions is the characterization of the interaction in terms of variables such as the energy produced transverse to the beam direction or the number of charged particles. These variables are closely related to the collision geometry and are important in understanding global properties of the system during the collision.
This paper describes a systematic study of and at mid-rapidity by the PHENIX experiment at center-of-mass energies =19.6 GeV, 130 GeV and 200 GeV. The centrality dependence of and is characterized by the number of participants, determined with a Glauber model, and is studied as function of the incident energy. and results for all four RHIC experiments are included as part of this study. The data taken at 19.6 GeV are particularly interesting because a close comparison to the lower energies of the CERN SPS program can be made. Comparisons are also made to previous experiments at the Brookhaven AGS and CERN SPS at center-of-mass energies of 4.8 GeV, 8.7 GeV, and 17.2 GeV. Finally, an extensive set of collision models describing the and distributions are compared to the existing data.
II PHENIX detector
PHENIX is one of four experiments located at RHIC rhic . The PHENIX detector consists of two central spectrometer arms, designated east and west for their location relative to the interaction region, and two muon spectrometers, similarly called north and south. Each central spectrometer arm covers a rapidity range of and subtends in azimuth. The muon spectrometers both have full azimuthal coverage with a rapidity range of (south) and (north). Additional global detectors are used as input to the trigger and for global event characterization such as vertex, time of event and centrality determination. A detailed description of the PHENIX detector can be found in phenix . The PHENIX detector subsystems relevant for the physics analysis presented in this paper are listed below.
Charged particle multiplicity was measured with two MWPC layers of the Pad Chambers (PC) pc called PC1, and PC3. These are located in both central arms at the radii of 2.5 and 5.0 from the beam axis. The PCs cover the full central arm acceptance and have an efficiency for minimum ionizing particles greater than 99.5%. The position resolution of PC1 was measured to be 1.7 by 3 and twice that for PC3. PC1 and PC3 can distinguish between two particle tracks if they strike the detector with a separation greater than 4 and 8 , respectively.
For the transverse energy measurements, a PbSc sampling calorimeter (EMCal) emcal from the PHENIX central spectrometers was used. The front face of EMCal is located 5.1 m from the beam axis. Scintillation light produced in the PbSc EMCal towers is read out through wavelength shifting fibers which penetrate the module. The depth of the PbSc calorimeter is radiation lengths () which corresponds to nuclear interaction lengths. The PbSc calorimeter has an energy resolution of 8.1%/ % for test beam electrons, with a measured response proportional to the incident electron energy that is within % over the range GeV emcal .
Two identical Beam-Beam Counters (BBC) bbc-zdc consisting of 64 individual Cherenkov counters with 2 quartz glass radiators each cover the full azimuthal angle in the pseudorapidity range . These detectors provide a minimum biased (MB) event trigger and timing and are also used for event vertex determination. The vertex position resolution for central events was 6 along the beam axis.
The Zero Degree Calorimeters (ZDC) zdc are hadronic calorimeters located on both sides of the PHENIX detector. They cover a rapidity region of and measure the energy of the spectator neutrons with approximately 20% energy resolution.
The BBC and ZDC were used for the centrality determination.
III Data Analysis
The analysis procedures for the and measured at =130 GeV are described in phenix_et and phenix_nch respectively. In this paper the analysis was improved including:
-
Inflow and outflow corrections done based on the identified particle data, as opposed to HIJING.
-
Corrected trigger efficiency of % instead of %.
-
Modified definition of the as discussed below.
The results presented here for =130 GeV are consistent with results previously published.
The same data samples with zero magnetic field were used for both and measurements at each beam energy. The analyzed numbers of events are approximately , and for =19.6 GeV, 130 GeV and 200 GeV respectively.
The main steps of the analysis procedure are discussed below in connection to the systematic errors associated with them. Some additional details can be found in phenix_milov ; phenix_bazik ; david_thesis ; sasha_thesis .
III.1 analysis
The transverse energy () is defined as:
| (1) |
where is the polar angle. The sum is taken over all particles emitted into a fixed solid angle in an event. By convention, is taken to be for baryons, for antibaryons and for all other particles, where is the total energy of the particle and is the nucleon mass 111The definition of in our earlier publication phenix_et is different for antibaryons contribution: was used instead of . The current definition increases the value of by about 4%, independent of centrality..
The measurement presented in this paper was performed using the PHENIX PbSc EMCal. The EMCal absolute energy scale was set using the mass peak reconstructed from pairs of EMCal clusters. The value was checked against a measurement of the minimum ionizing peak for charged particles penetrating along the tower axis and the energy/momentum () peak of identified electrons and positrons. The uncertainty in the absolute energy scale is 3% in the =19.6 GeV data and 1.5% in the 130 GeV and 200 GeV data.
The EMCal acts as a thin but effective hadronic calorimeter at mid-rapidity at a collider phenix_et . The mean hadron momenta in the EMCal acceptance are approximately 0.4, 0.55 and 0.9 GeV/c for pion, kaons and (anti)protons respectively julia . Most hadrons stop in the EMCal, depositing all their kinetic energy (at less than 0.35 GeV/c for pions, 0.64 GeV/c for kaons and 0.94 GeV/c for protons).
The average EMCal response to the different particle species was obtained with a GEANT-based geant Monte Carlo (MC) simulation of the PHENIX detector using the HIJING hijing_sim event generator. The HIJING particle composition and spectra were tuned to the identified charged particle spectra and yields in collisions measured by PHENIX julia ; tatsuja at =200 GeV and 130 GeV. The NA49 results na49_1 ; na49_2 ; na49_3 were used for EMCal response studies for =19.6 GeV data. The “deposited” was about 75% of the total “striking” the EMCal. This value varied in the 1.5% range for different centralities and beam energies.
The uncertainty in the EMCal response to hadrons gave a 3% error to the total . This uncertainty was estimated using a comparison between the simulated energy deposited by hadrons with different momenta and from the test beam data emcal . An additional error of 1.3% at =19.6 and 200 GeV and 1% at =130 GeV comes from the systematic uncertainties in the particle composition and momentum distribution.
was computed for each event (Eq. 1) using clusters with energy greater than 30 MeV composed of adjacent towers with deposited energy of more than 10 MeV222In phenix_et thresholds of 20 MeV and 3 MeV were applied for the cluster and for the tower, respectively. Energy losses due to thresholds were properly accounted for in both analyses.. The energy losses at the EMCal edges and due to energy thresholds, 6% each, were estimated with the absolute uncertainty 1.5%.
The first main issue for the measurement is the correction for losses for particles which originate within the aperture but whose decay products miss the EMCal (10%). The second is for the in-flow contribution (24%), which is principally of two types: (1) albedo from the magnet poles; (2) particles which originate outside the aperture of the calorimeter but whose decay products hit the calorimeter. The in-flow component was checked by comparing the MC and the measurements for events with a vertex just at and inside a pole face of the axial central-spectrometer magnet, for which the calorimeter aperture was partly shadowed. The estimated contribution of the in-flow uncertainty to the uncertainty is 3% phenix_et .
Since measurements are based on the sum of all cluster energies in the EMCal, random noise even in a small portion of the total number of EMCal towers (15,000 in PbSc) may affect the total energy in the EMCal, particularly in peripheral collisions. This effect was estimated by measuring the total energy in the EMCal in very peripheral events with the collision vertex inside the magnet poles. In this case, the EMCal is fully shadowed and no energy deposit from beam collisions is expected. The estimated contribution was consistent with zero. The uncertainty from this effect contributes 3.5% systematic error to the measurement in the most peripheral bin of 45%-50% at =19.6 GeV, 10% in the most peripheral bin of 65%-70% at =130 GeV and 6% to the bin of 65%-70% at =200 GeV. The contribution to the systematic error for central events was negligible.
III.2 analysis
In the absence of a magnetic field, the particle tracks are straight lines. The number of tracks in the event was determined by combining all hits in PC3 with all hits in PC1. The resulting straight lines were projected onto a plane containing the beam line and perpendicular to the symmetry axis of the PCs. All tracks intersecting the plane at a radius less than 25 from the event vertex were accepted. 951% of all real tracks in the event point back within this radius.
The complete set of tracks thus formed contains both real tracks and tracks from combinatorial background. The latter can be determined using a mixed event technique in which each sector in PC1 is exchanged with its neighbor and the resulting combinatorial background measured.
The average combinatorial background from the mixed event analysis was subtracted from the data from the real events. Several corrections were subsequently applied.
A correction of 15.3% accounts for nonsensitive mechanical gaps between the PC sectors, inactive electronic readout cards, and dead pads in the PC1 and PC3 detectors. The data were also corrected for the PC efficiency for an isolated hit, measured to be 99.5% using cosmic rays pc . The combined systematic error from these corrections was estimated to be 2.5% for single east arm and 2.3% for both east and west arms.
Track losses from the finite double hit resolution of the PCs depend on the event multiplicity. Losses occur in both the direct counting of tracks and in the combinatorial background subtraction. These two effects were studied in great detail using Monte Carlo techniques. To account for the track losses in the real event sample, a correction of 15%, 13% and 6% for the 5% most central events was applied at =200, 130, and 19.6 GeV, respectively.
Track loss due to the finite double hit resolution reduces combinatorial background in the real events more than in the mixed events. The number of tracks in the mixed events must be decreased by 3.6% to account for this. The uncertainty in the correction related to the finite double hit resolution of the PCs is estimated to be 3.5% of the number of reconstructed tracks in the most central events at = 200 GeV. This number was deduced from the simulation and cross-checked with an artificial 50% increase of the double hit resolution of PC1 and PC3.
An additional correction is related to the decays of charged particles and feed-down from the decays of neutral particles as discussed in phenix_nch where it was determined using the HIJING event generator. In this paper the measured composition of the produced particles at different centralities is used at =200 and 130 GeV julia ; tatsuja . The correction related to particle decay varies about 1% over the full range of measured centralities. In mid-central events it is % and % at =200 GeV and 130 GeV respectively. At the lowest RHIC energy the correction is based on NA49 na49_1 ; na49_2 ; na49_3 measurements at close energy =17.2 GeV and is about 115.7% independent of centrality. The difference between = 19.6 GeV and 130 GeV arises from the decrease of the particle momenta and the width of the -distribution at lower energy which affects the number of tracks from decays of the particles coming from adjacent rapidities. The uncertainty is also larger because the correction was based on non-PHENIX data. More details on the analysis can be found at phenix_nch ; david_thesis ; sasha_thesis .
III.3 Determination of trigger efficiency and .
The distribution of the number of participants () in collisions was determined using a Monte Carlo simulation based on the Glauber model. The inelastic cross section of collisions used in the Glauber model was taken to be 31 mb, 41 mb and 42 mb at = 19.6 GeV, 130 GeV and 200 GeV respectively PDG and varied within 3 mb in order to get the systematic errors. The nuclear density profile was taken as the Woods-Saxon parameterization:
| (2) |
where is the nucleus radius and is a diffuseness parameter. Based on the measurements of electron scattering from nuclei Hofstadter , was set to (6.380.27) fm and to (0.540.01) fm.
The BBC detectors are located in a region where the number of produced particles is proportional to at =130 GeV and 200 GeV phobos6 . By comparing measured BBC spectra to simulations, the MB trigger efficiency was estimated to be % at both =200 GeV and 130 GeV, with less than 1% uncertainty in the difference between these two energies.
One can also use the BBC (or ZDC vs. BBC) response to define centrality for a given event as a percentile of the total geometrical cross section. The BBC amplitude distribution and ZDC vs BBC signals divided into centrality classes are shown in Fig. 1.
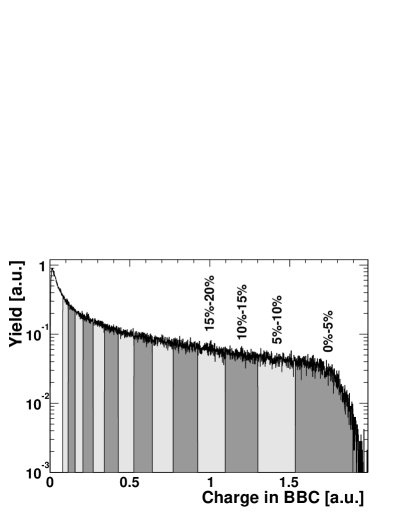
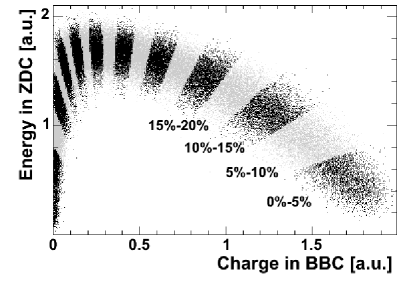
By matching the detector response simulation to the data, can be assigned to each centrality class. The results for vary by less than 0.5% depending on the shape of the cut in the ZDC/BBC space and whether the BBC alone was used as a centrality measure. The larger error in comes from model uncertainties and can be parameterized as .
At =19.6 GeV, the BBC acceptance partially covers the nuclei fragmentation region where the relation between the particle production and is not well known for peripheral events. This makes the MB trigger efficiency model dependent. To avoid this problem, an approach based on the Glauber model and the Negative Binomial Distribution (NBD) was applied to the data from the PHENIX central arm. For the centrality associations, the BBC signal can still be used after applying the correction described in the text below.
The NBD, written as:
| (3) |
represents the number of independent trials that are required to get a number of predetermined successes if the average number of successes per trial is . The parameter is related to the variance of the distribution by the equation . By associating with the number of particles produced in the event such that , the NBD describes the distribution of hits in a detector ags_mjt ; mitchell produced by a given number of . In the simplest case when , . Using probability weights for from the Glauber model, one can construct a distribution of the number of hits in a detector. The coefficients and can be obtained by fitting the constructed distribution to the experimentally measured distribution.
The number of hits in the PC1 detector shown in the left panel of Fig. 2
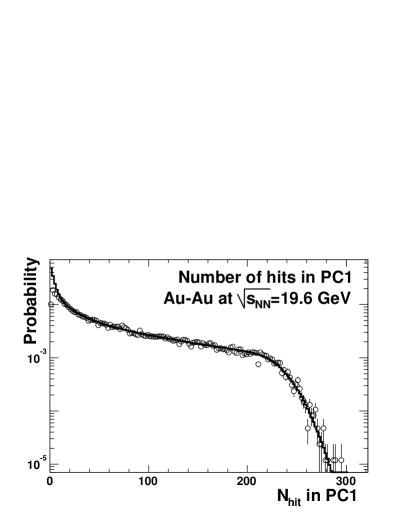
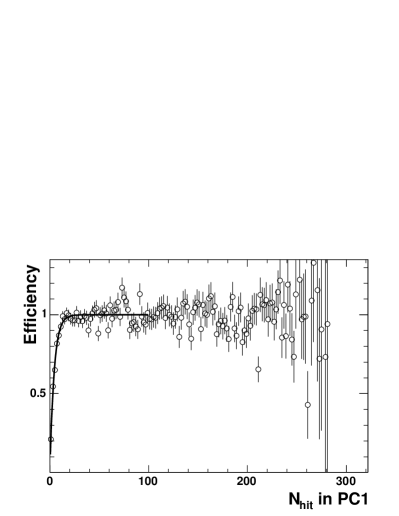
was used to determine the trigger efficiency. can be parameterized as scaling with the number of participants , where is between 1.0 and 1.1 as measured by WA98 at the CERN SPS wa98 . The Glauber/NBD fit to the distribution of the number of hits in PC1 is shown as the solid line. The fitting range is constrained above some number of hits, where the trigger efficiency is equal to 1. The efficiency as a function of the number of hits in the detector can be found by taking the ratio of measured and reconstructed distributions. This is shown in the right panel of Fig. 2. Intergated over all the MB trigger efficiency was found to be % at =19.6 GeV. The 1% uncertainty due to variation of from 1.0 to 1.1 was included in the systematic error. An uncertainty on the difference between =19.6 GeV and 200 GeV was of 1.5%.
A fraction of events missing in the trigger at all energies belongs to the peripheral centrality classes outside the centrality range discussed in this paper.
As a cross check, the same procedure was applied to the BBC response at 200 GeV. It was found that the MB trigger efficiency in and collisions agrees with the procedure based on a full simulation within one standard deviation of the systematic error. In the in the centrality bins determined using Glauber/NBD method agree better than 0.5% to the values used in this paper. In for a single nucleon-nucleon collision the MB trigger efficiency was found to be 57% consistent with % measured for PHENIX trigger efficiency at the same energy using different method phenix_pp . Finally, the fraction of expected collisions in the sample agrees with the fraction of the events in which the corresponding ZDC detects the spectator neutron from the deuteron within better than 1.5%.
As it was stated above, the BBC detector at =19.6 GeV covers a part of the nuclei fragmentation region and its response is not linear with phobos6 . Also, the number of hits in BBC has a strong vertex dependence mainly due to the fact that the BBC samples different parts of the distribution at different vertices; see Fig. 3. The asymmetry of north and south BBC amplitudes in the same event was studied to correct for these two effects. Around vertex the asymmetry between number of hits in north BBC and south BBC is reflects the slope of the -distribution at BBC rapidity. In order to use the BBC signal for determination the observed signals were scaled such that the asymmetry between north and south is the same as in the most central events where the influence of the fragmentation region is negligible. The vertex dependence was also corrected for. The results of the correction are shown in Fig. 3.
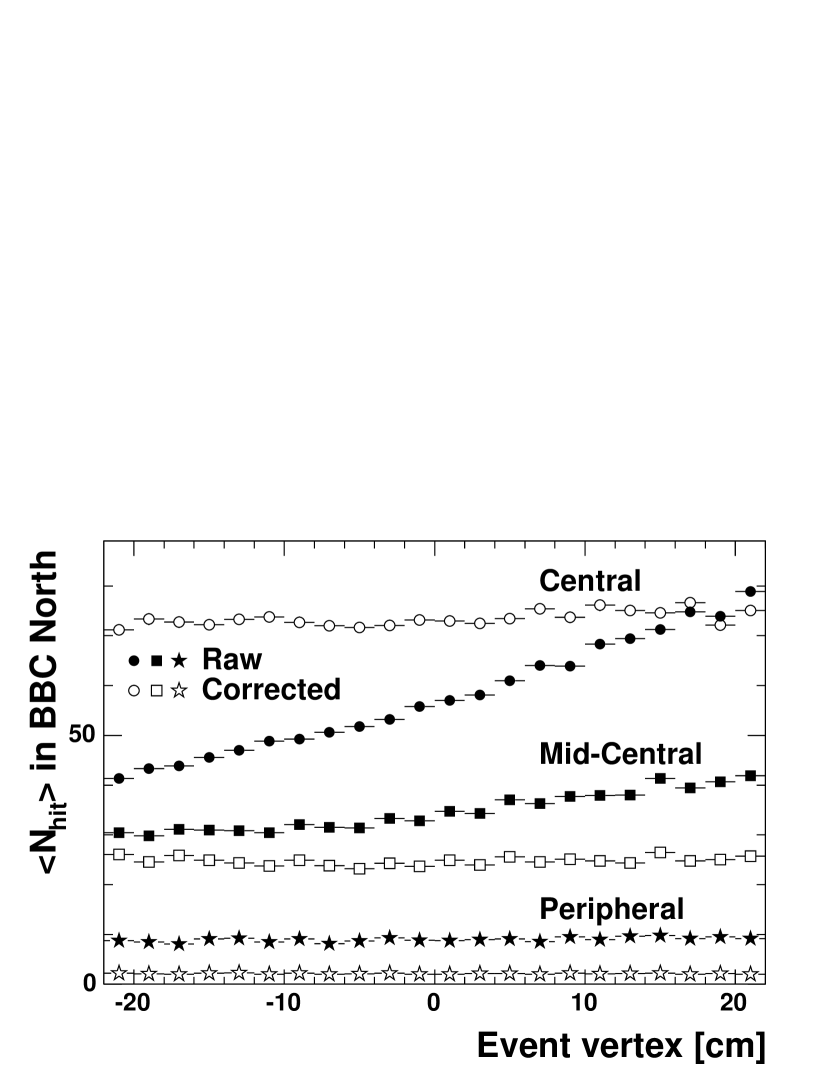
The corrected BBC response was used for the centrality determination. Based on both data and Monte-Carlo simulation, a systematic error of 2% was added to the determination of the centrality classes using the BBC correction procedure.
III.4 Systematic error summary
Table 1 summarizes the systematic errors discussed in this section. The “Energy resp.” error for the measurements combines the uncertainties in absolute energy scale, hadronic response and energy losses on the EMCal edges and from energy thresholds. The resulting error for each centrality bin is a quadratic sum of the errors listed in the Table.
| [GeV] | 19.6 | 130 | 200 | 19.6 | 130 | 200 |
|---|---|---|---|---|---|---|
| Energy resp. | 4.7 | 3.8 | 3.9 | |||
| Bkg. / noise | 0.5-3.5 | 0.4-10 | 0.2-6 | 1.0 | 1.0 | 1.0 |
| Acceptance | 2.0 | 2.0 | 2.0 | 2.3 | 2.5 | 2.3 |
| In- & outflow | 3.0 | 3.0 | 3.0 | 5.7 | 2.5 | 2.9 |
| Occupancy | 1.6-0.3 | 3.1-0.1 | 3.5-0.1 | |||
| Centrality | 2.0 | 0.5 | 0.5 | same | ||
| 2.9-6.7 | 2.8-15. | 2.8-15. | same | |||
| Trigger | 0.4-8.8 | 0.3-16. | 0.3-16. | same | ||
IV Results
IV.1 PHENIX results
The distribution of the raw transverse energy, , into the fiducial aperture of two EMCal sectors is shown in the left three panels of Fig. 4 for three RHIC energies = 19.6, 130 and 200 GeV. The lower scale represents the fully corrected normalized to one unit of pseudorapidity and full azimuthal acceptance. The lower axis in the plot is not labeled beyond 200 GeV to avoid confusion between the true shape of the distribution and as measured using the limited acceptance of two EMCal sectors.
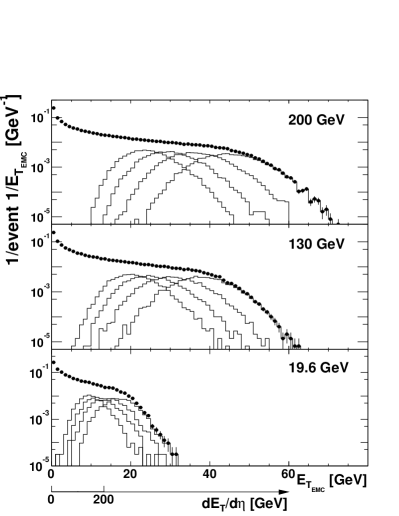
For the measurements at = 19.6 GeV and 200 GeV, five EMCal sectors (with azimuthal coverage ) were used, while only two sectors () were available during the PHENIX run at = 130 GeV. Results obtained with different number of sectors at the same energy were consistent within 1.5%.
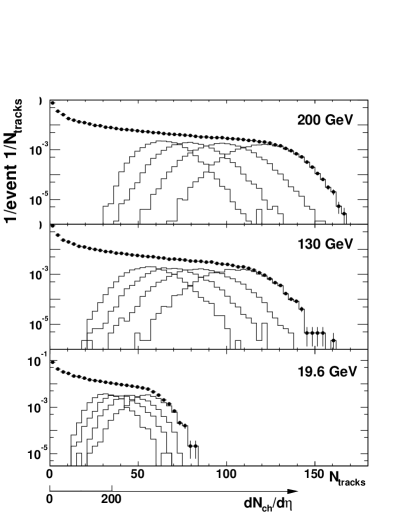
The right three panels in Fig. 4 show the number of tracks reconstructed in the east arm of the PHENIX detector after background subtraction and all corrections. The lower axis corresponds to measured distributions normalized to one unit of pseudorapidity and full azimuthal acceptance. For a similar reason as for the measurement, the lower axis is not labeled above 200 GeV in .
For the measurements at = 130 GeV, only the east arm was used, while for the other two energies the measurements were made using both PHENIX central arms. The results obtained with two arms at =200 GeV and 19.6 GeV are consistent with each other within 1.5%.
The distributions shown in Fig. 4 have a characteristic shape with a sharp peak that corresponds to the most peripheral events. Missing events caused by the finite MB trigger efficiency in peripheral events would make this peak even sharper than measured. The plateau in all distributions corresponds to mid-central events and the fall-off to the most central events. The shape of the curves in Fig. 4 in the fall-off region is a product of the intrinsic fluctuations of the measured quantities and the limited acceptance of the detector.
The distributions for the four most central bins 0%-5% to 15%-20% are also shown in each panel. The centroids of these distributions were used to calculate the centrality dependence of and 333All plotted and quoted numbers correspond to average values in each centrality bin or ratios of those averages.. The statistical uncertainty of all mean values (less than or about 1%) determined by the width of the distributions are small because of the large size of the event samples.
The magnitude of and at mid-rapidity divided by the number of participant pairs as a function of is shown in Fig. 5 and tabulated in Tables 13–15. The right three panels show the same ratio for at three RHIC energies.

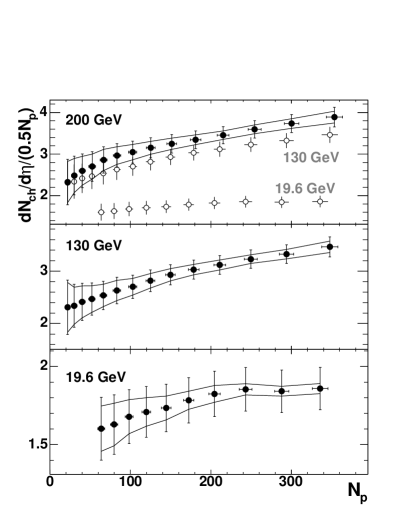
The horizontal errors correspond to the uncertainty in , determined within the framework of the Monte Carlo Glauber model. The vertical bars show the full systematic errors of the measurements444Here and everywhere errors correspond to one standard deviation. added quadratically to the errors of . The lines denote the corridor in which the points can be inclined or bent. The statistical errors are smaller than the size of the markers. The upper panel also shows the results of the two lower panels with open markers for comparison.
An important result from Fig. 5 is an evident consistency in the behavior of the centrality curves of shown on the left and shown on the right for all measured energies. Both values demonstrate an increase from peripheral (65%-70% bin) to the most central events by 50%-70% at RHIC energies =130 GeV and 200 GeV. For the lowest RHIC energy (=19.6 GeV) this increase is at the level of systematic uncertainties of the measurement. One can note that results from PHOBOS phobos_total , show that the total charged particle multiplicity is proportional to while the multiplicity at mid-rapidity over increases with , indicating that the pseudorapidity distribution gets more narrow for central events.
The ratios of the and per participant pair measured at different RHIC energies are shown in Fig. 6 and tabulated in Table 16. In these ratios some common systematic errors cancel.
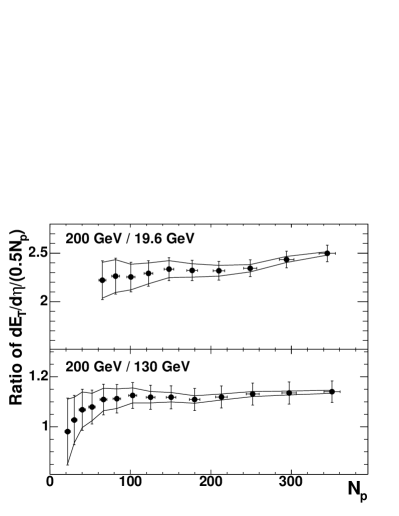

The increase in the production between 19.6 GeV and 200 GeV (with an average factor of 2.3) is larger than for (with average factor of 1.9). This is consistent with an increase in the particle production per participant common to both and and a 20% increase in of produced particles contributing to the parameter only. See section A.1 and na49_1 ; tatsuja .
The ratio of 200 GeV/19.6 GeV shows some increase from peripheral to central events; however the increase is marginally at the level of the systematic errors of the measurement.
The ratio of 200 GeV/130 GeV is flat above 80 and is equal to for and for in the most central bin. A rather sharp increase between =22 and 83 in the ratios of both quantities is still at the level of systematic uncertainties.
The ratio of the transverse energy and charged particle multiplicity at mid-rapidity as a function of centrality is shown in Fig. 7 for the three energies. The upper plot also shows the results displayed in the lower panels for comparison.

The ratio 555 is used as a shortcut for at in C.M.S.., sometimes called the “Global Barometric Observable”, triggered considerable discussion gulash ; raju . It is related to the of the produced particles and is observed to be almost independent of centrality and incident energy of the collisions within the systematic errors of the previous measurements. The present paper forges a direct link between the highest SPS and lowest RHIC energies, making a more quantitative study of possible.
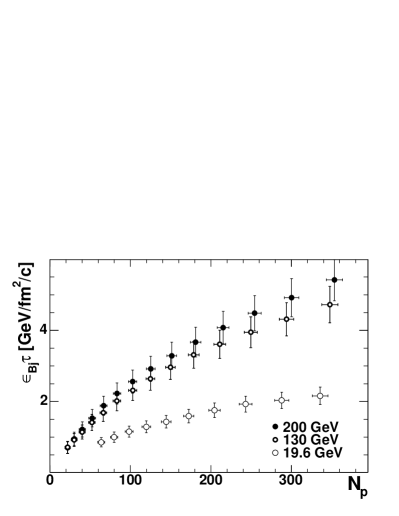
IV.2 Bjorken Energy Density
The Bjorken energy density bjorken can be calculated using
| (4) |
where is the formation time and is the nuclei transverse overlap area.
The transverse overlap area of two colliding nuclei was estimated using a Monte Carlo Glauber model , where and are the widths of and position distributions of the participating nucleons in the transverse plane. The normalization to , where is the sum of and parameters in a Woods-Saxon parameterization (Eq. 2), was done for the most central collisions at the impact parameter .
For the transformation from to , a scale factor of was used, see A.1.
The Bjorken energy density for three RHIC energies is plotted in the left panel of Fig. 8 and tabulated in Tables 13–15. For the 5% most central collisions, was , and GeV/() for =19.6, 130 and 200 GeV, respectively. These values increase by 2%, 4% and 5%, respectively, for the maximal =394, as obtained from extrapolation of PHENIX data points. There is a factor of 2.6 increase between the “SPS”-like energy ( =19.6 GeV) and the top RHIC energy =200 GeV. The comparison of the only published =3.2 GeV/ at SPS for head-on collisions na49_4 and top RHIC energies, assuming the same =1 fm/c, reveals an increase in energy density by a factor of only 1.8, which may come from an overestimation in the SPS measurement, as shown in the left panel of Fig. 13 and discussed in section A.3.
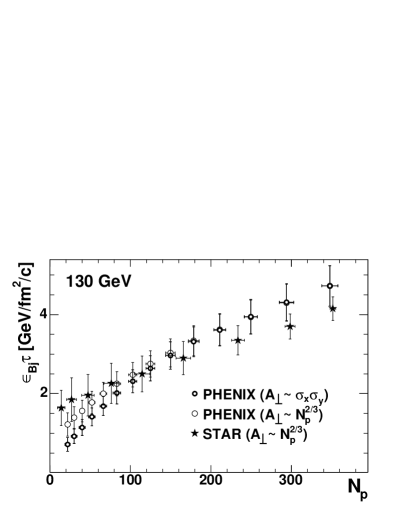
Another approach is used by STAR in star_bj for the estimate of the transverse overlap area of the two nuclei in Eq. 4. This approach accounts only for the common area of colliding nucleons, not nuclei. The results are different only in the peripheral bins as shown in the right panel of Fig. 8. For a comparison, the same panel shows the result obtained by STAR which agrees with PHENIX result within systematic errors, though displaying a smaller increase of the energy density with .
IV.3 Comparison to other measurements
Comparison to the results of other experiments is complicated by several factors. AGS and SPS data were taken in the Laboratory (Lab.) system while the RHIC data are in the Center of Mass (C.M.S.) system. Since and are not boost invariant quantities, the data should be converted into the same coordinate system. Some experiments provide a complete set of identified particle spectra from which information about and can be deduced. For other experiments, additional assumptions are necessary for their published values. Appendix A describes how such recalculation was done in each particular case.
The PHENIX results for are compared to the data available from the other RHIC experiments. This comparison is shown in the left panels of Fig. 9.
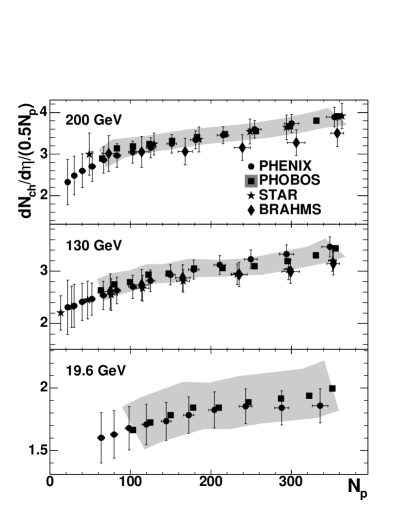
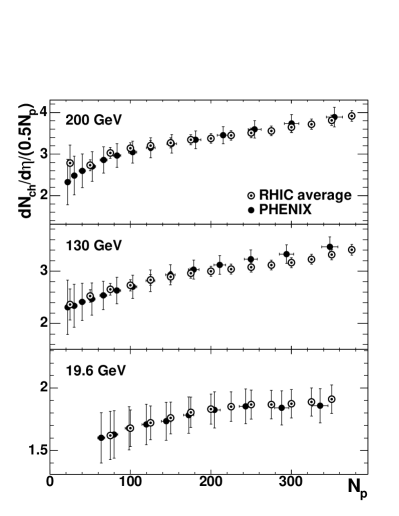
There is good agreement between the results of BRAHMS brahms1 ; brahms2 , PHENIX, PHOBOS phobos1 ; phobos2 ; phobos3 and STAR star1 ; star2 using based on a Monte-Carlo Glauber model. This agreement is very impressive because all four experiments use different apparatuses and techniques to measure the charged particle production. The systematic errors of all results are uncorrelated, except for those related to the same Glauber model which are small. That makes it possible to calculate the RHIC average and reduce the systematic uncertainty. The averaged results from all four RHIC experiments are plotted in the right panel of Fig. 9 and tabulated in Table 17. See section A.2 for the procedure.
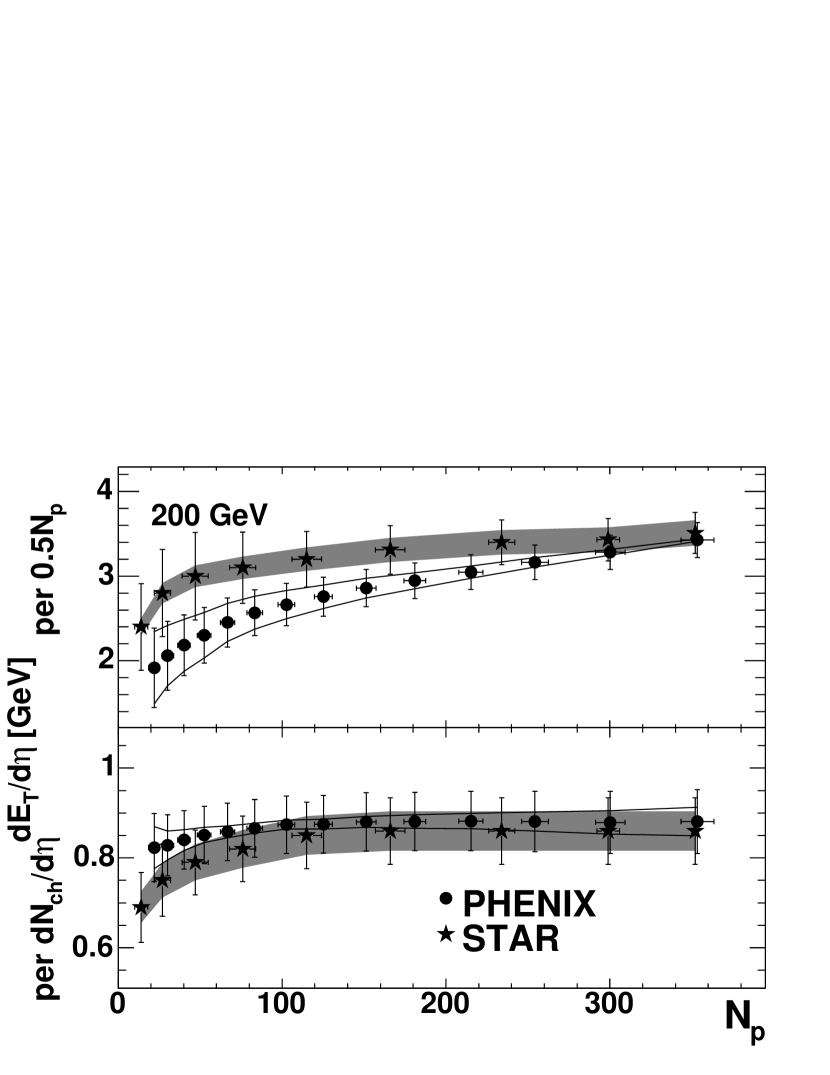
Figure 10 compares results from the PHENIX and STAR star_etra experiments. The results are consistent for all centralities within systematic errors, though STAR per participant pair has a smaller slope vs. above 70 participants, and shown in the lower panel is consistent for all .
The RHIC run at =19.6 GeV allows a connection between RHIC and SPS data to be made. The highest SPS energy of 158A GeV corresponds to =17.2 GeV in the C.M.S., making a direct comparison of RHIC and SPS results possible. This comparison is shown in Fig. 11. See sections A.3 through A.6 for the details of the data compilation.
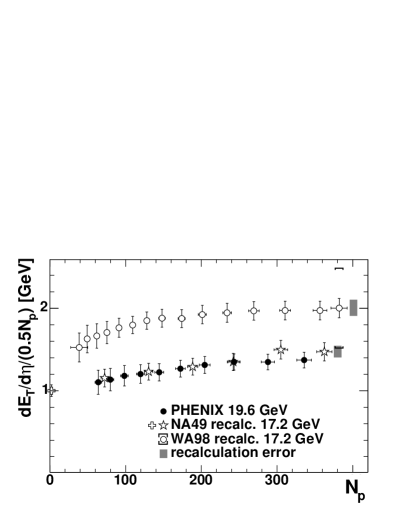
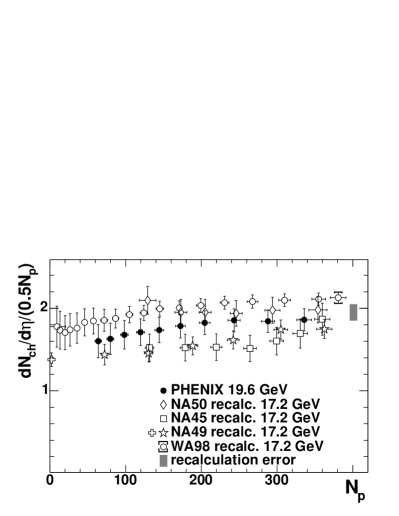
Several comments should be made about this comparison. For both measured parameters the PHENIX results and the SPS results agree. The WA98 results (see section A.4) are systematically higher than the results of other experiments, especially for . However the WA98 data has an additional systematic error common to all points shown for the last bin. For the relative spread of the SPS results is larger than for the RHIC results shown in Fig. 9, though overall the =17.2 GeV SPS measurements are consistent with the PHENIX result at =19.6 GeV.
Different SPS and AGS experiments made measurements at lower energies. The combined data of AGS, SPS and RHIC provide a complete picture of the centrality behavior of and as a function of the nucleon-nucleon energy. The centrality dependence of at mid-rapidity measured at =4.8, 8.7 and 17.2 GeV by different experiments is shown in Fig. 12. See Table 17 for the summary of these results and sections A.5 through A.7 for the details of the data compilation.
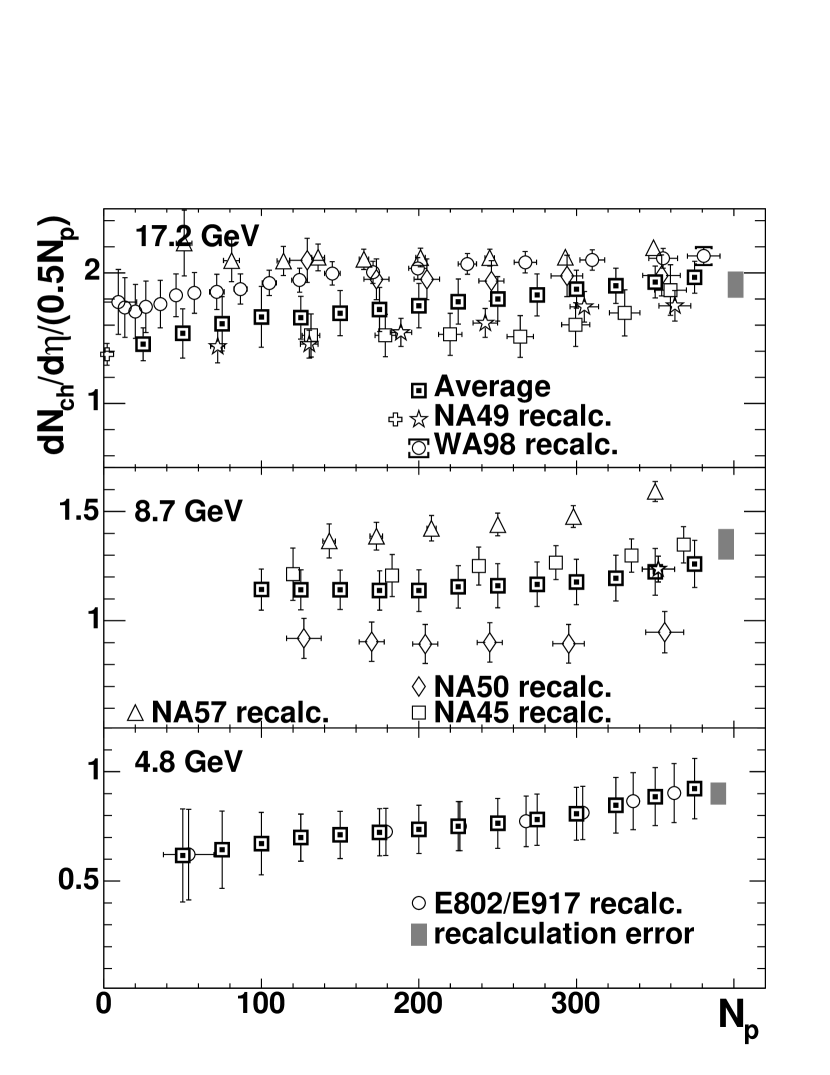
At the highest SPS energy the averaging procedure is the same as for RHIC energies and weighted experimental errors are scaled with the reduced -like factor (described in section A.2) reaching the value of 1.5 at some points. For the intermediate SPS energy =8.7 GeV, two experiments NA45 ceres_3 and NA50 na50_1 reported the centrality dependence of at mid-rapidity. The discrepancy in the measurements is close to three times the quadratic sum of their systematic error. However the shapes of the two curves are almost the same. NA49 has published results (see section A.3) which give one point in at =352. This point favors the NA45 result666The NA57 results at both SPS energies are published without systematic errors in na57 . They are currently not considered.. The average centrality curve is produced taking into account the shape of the centrality curves reported by NA45 and NA50 and the single NA49 point. See section A.8 for the averaging procedure at =8.7 GeV. The errors are scaled with the factor , which reaches a value of 2.5 at some points. The AGS results are presented with a curve produced from the combined results of the E802/E917 experiments (see section A.7). The averaging procedure in this case is a simple rebinning of the data.
The average SPS centrality dependence at =17.2 GeV shown in the upper panel in Fig. 12 and the average curve of the two RHIC experiments at =19.6 GeV shown in the lower panel in Fig. 9 are very similar. Less than 5% increase is expected due to the difference in the incident energy between the highest SPS and the lowest RHIC energies (see section IV.4.1 below).
IV.4 Dependence on the incident nucleon energy.
The data compilation made in the previous section allows for a detailed study of the charged particle production in heavy ion reactions at different incident energies of colliding nuclei. Although the data on transverse energy production is not abundant, a similar comparison can be made phenix_milov ; phenix_bazik .
IV.4.1 Central Collisions
Figure 13 shows the energy dependence for the and production per pair of participants in the most central collisions measured by different experiments. See sections A.5 through A.9 for the details of the data compilation.
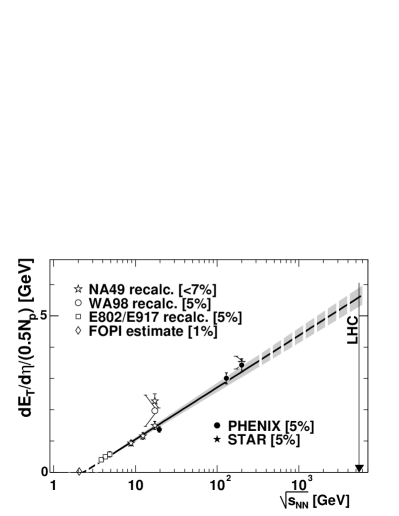
The results shown in Fig. 13 are consistent with logarithmic
scaling as described in phenix_milov ; sasha_thesis ; david_thesis .
Use of the logarithmic function is phenomenological and is suggested
by the trend of the data in the range of available measurements.
The agreement of the fits with the data in both panels is very good, especially in
the right panel where the averaged values are used for =350. The single point
of NA49 na49_4 is excluded from the fit (see
section A.3). The results
of the fit are:
for GeV and GeV
for GeV and .
The parameter =2.35 GeV obtained from the fit is slightly above, although within 3 from the minimum possible value of ==1.86 GeV. The measurement closest to it at =2.05 GeV done by the FOPI experiment allows to estimate the amount of produced to be 5.0 GeV in the most central collisions corresponding to =359. Section A.9 gives details of the estimate. This does not disagree with the extrapolation of the fit but does indicate that the logarithmic parameterization requires higher order terms to describe how the production starts at very low .
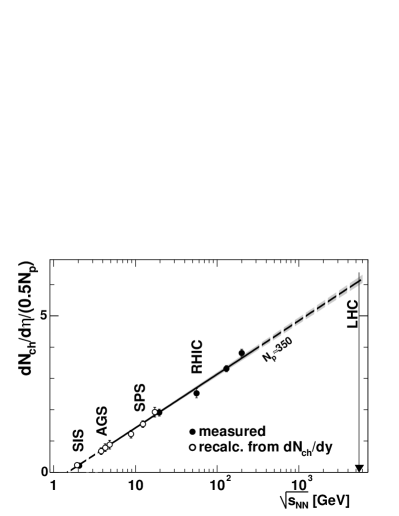
The right panel of Fig. 13 shows the logarithmic fit to the data. It agrees well with all results plotted for =350. Unlike that for , the fit parameter for is 1.480.02 GeV which is lower than the minimum allowed . This suggests that above the production as a function of should undergo threshold-like behavior, unlike the production which must approach zero smoothly due to energy conservation.
The FOPI measurement at =1.94 GeV and 2.05 GeV agrees with the extrapolation of the fit at energy very close to . It is an interesting result that colliding nuclei with kinetic energies of 0.037 GeV and 0.095 GeV per nucleon in the C.M.S. follow the same particle production trend as seen at AGS, SPS and RHIC energies.
A fit to the charged particle multiplicity shows a factor of 2.2 increase in per participant in the most central events from the highest energy at the AGS ( =4.8 GeV) to the highest energy at the SPS ( =17.2 GeV) and a factor of 2.0 from the highest SPS energy to the highest RHIC energy ( =200 GeV). Assuming the same behavior extends to the LHC highest energy =5500 GeV one would expect = and the increase in particle production from the highest RHIC energy to be 60% for the most central events. With the greater energy, the rapidity width should increase by 60% i.e. the total charged particle multiplicity at LHC would increase by a factor of 2.6 from the top RHIC energy.
The ratio of for the most central bin as a function of is shown in Fig. 14.
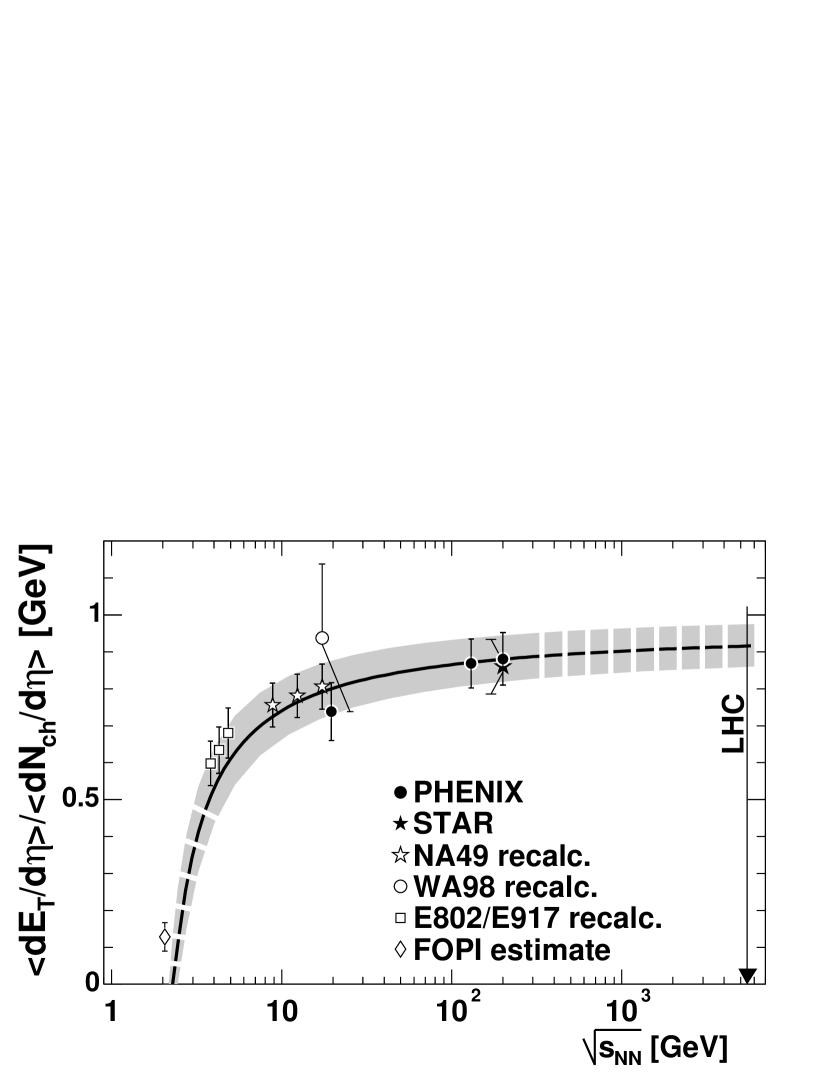
Note that the line shown in the figure is not the fit to the data points. Rather, it is calculated from the fits shown in Fig. 13. The calculation agrees well with the data.
There are two regions in the plot which can be clearly separated. The region from the lowest allowed to SPS energy is characterized by a steep increase of the ratio with . In this region the increase in the incident energy causes an increase in the of the produced particles. The second region starts from the SPS energies and continues above. In this region, the ratio is very weakly dependent on . The incident energy is converted into particle production at mid-rapidity rather than into increasing the particle .
The shape of the curve in the first region is governed by the difference in the parameter between and . In the second region it is dominated by the ratio of the parameters in the fits. This ratio is close to 1 GeV. Extrapolating to LHC energies one gets a value of (0.920.06) GeV.
IV.4.2 Centrality shape
Another interesting question is how the shapes of the centrality curves of and change with .
One approach previously used in a number of papers is to describe the shape of the centrality dependence as a sum of “soft” and “hard” contributions such that the “soft” component is proportional to and the “hard” component to the the number of binary collisions : . A disadvantage of this approach is that the contributions called “soft” and “hard” do not necessarily correspond to the physical processes associated with these notations. Another approach is to assume that the production of or is proportional to , although the parameter does not have any physical meaning.
The results of and obtained from the fits to the data at different are summarized in Table 2. Although the numbers tend to increase with beam energy, the values presented in Table 2 are consistent with each other within the systematic errors.
| GeV | PHENIX | PHENIX | Average |
| 200 | |||
| 130 | |||
| 19.6 | |||
| 17.2 | |||
| 8.7 | |||
| parameter | |||
| 200 | 1.200.07 | 1.180.08 | 1.160.06 |
| 130 | 1.140.08 | 1.170.08 | 1.140.05 |
| 19.6 | 1.130.07 | 1.090.06 | 1.100.11 |
| 17.2 | 1.110.08 | ||
| 8.7 | 1.060.13 | ||
| 4.8 | 1.200.24 | ||
The availability of higher quality data would make it possible to derive a more conclusive statement about the shape of the curves plotted in Figs. 9 and 12. With the present set of data usually limited to above 50, a large part of the centrality curve is missing or smeared by systematic errors. To avoid this, one can compare collisions to (=2) at the same energy.
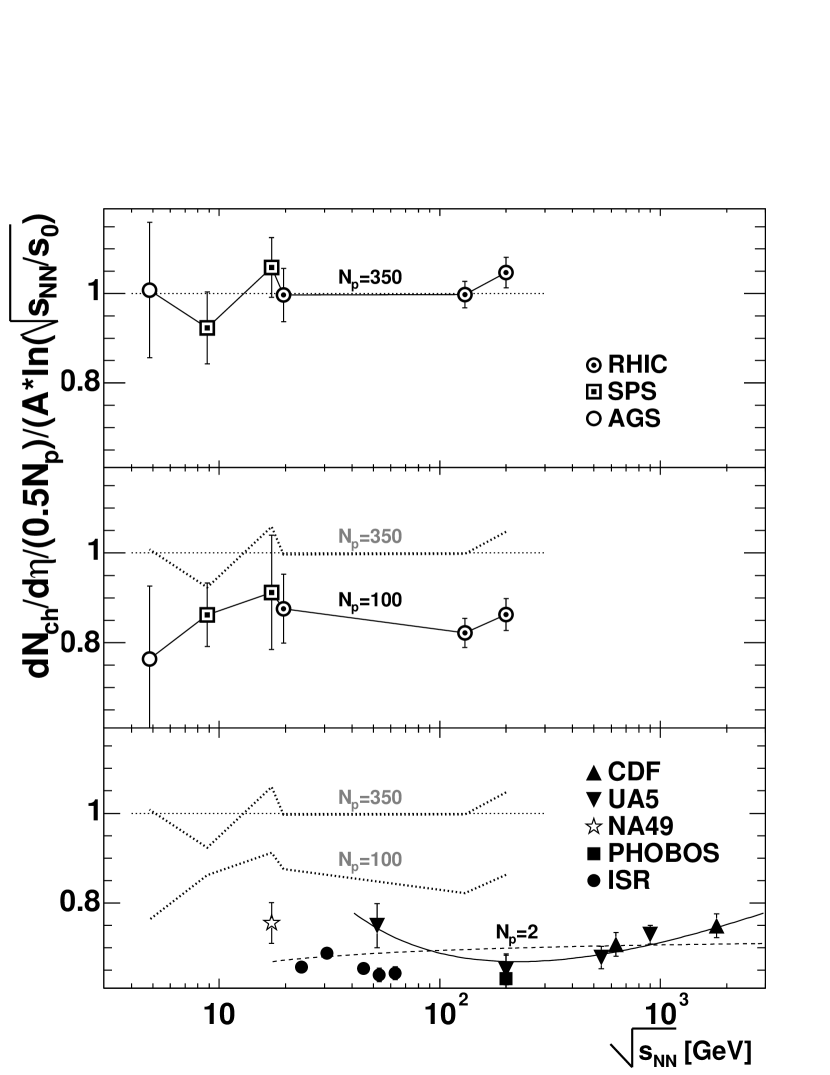
Figure 15 shows divided by the parameterization plotted in the right panel of Fig. 13. The top panel shows the most central events with = 350. All points are consistent with 1 demonstrating an agreement of the fit to the data. The points are connected with a line for visibility. The middle panel shows results for mid-central events with = 100 connected with a solid line. The dotted line is the same line as in the top panel for = 350. The points for = 100 are lower than = 350 by a factor of , over the plotted range of incident energies. The lower panel shows data corresponding to = 2 measured by several experiments. Dotted lines are the same as appear in the upper two panels for = 350 and 100 and the parameterizations are taken from ua5 ; isr . In the range of RHIC energies these points are lower by a factor of than the most central events.
These results indicate that the centrality curves normalized to the most central collisions have a similar shape for all RHIC energies within the errors of available measurements.
IV.5 Comparison to models
A variety of models attempting to describe the behavior of and as a function of centrality at different are available. An updated set of model results were collected from several theoretical groups to make a comparison as comprehensive as possible.
Figures 16 through 18 show the comparison between the existing theoretical models777Models are presented as the best fit by the polynomial of the lowest degree which is closer than 1% to any theoretical point provided by the authors of the models. The polynomial is plotted in the range where points are provided. and the data for 19.6, 130 and 200 GeV. Brief descriptions of the models and their main characteristics are given below.
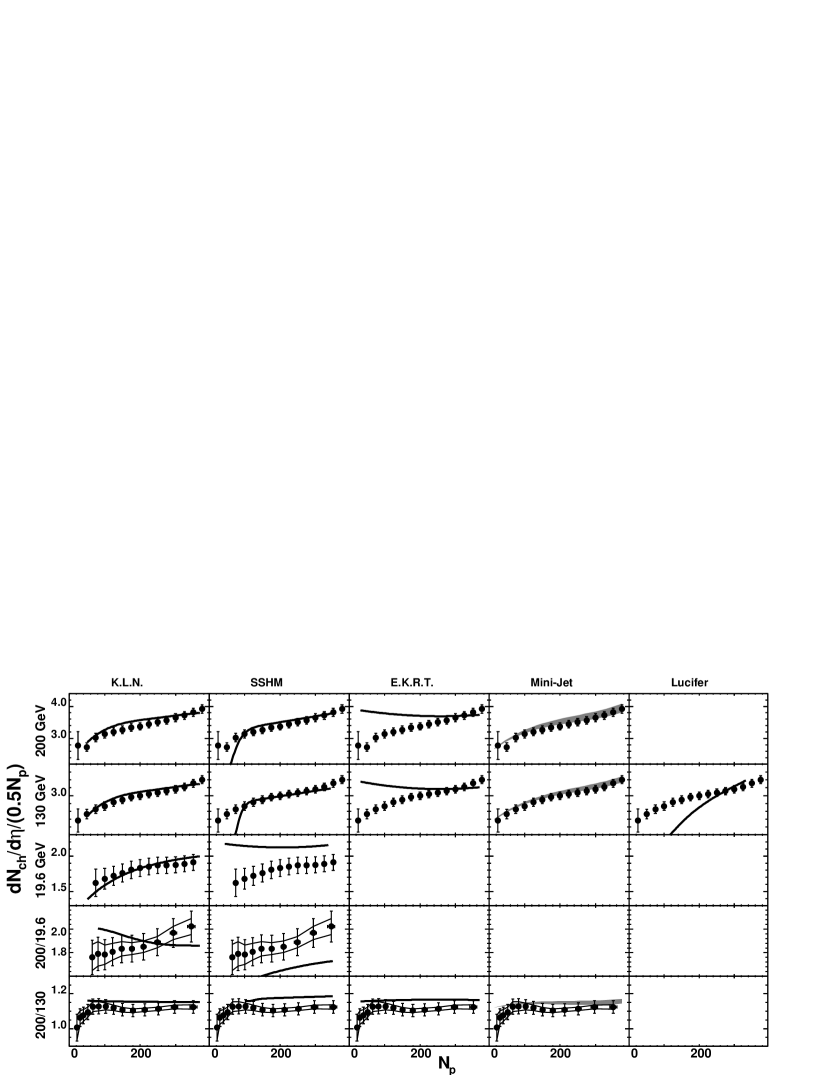
One of the more commonly used Monte Carlo event generators is HIJING hijing_sim ; new_hijing . This model, like several others, uses pQCD for initial minijet production, and the Lund string model lund_string for jet fragmentation and hadronization. HIJING also includes jet quenching and nuclear shadowing. This type of model typically has two components, a soft part proportional to and a hard part proportional to , which partly motivated the discussion in section IV.4.2. There are also so-called saturation models which also rely on pQCD and predict that at some fixed scale the gluon and quark phase-space density saturates, thus limiting the number of produced quarks and gluons. An example of this type of model is EKRT ekrt , which is referred to as a final state saturation model. In this paper, comparisons are also made to another parton saturation type model, KLN kln , an initial state saturation model, and also to models related to HIJING, namely Minijet minijet and AMPT ampt . AMPT is a multiphase transport model, and extends HIJING by including explicit interactions between initial minijet partons and also final state hadronic interactions. Minijet follows the same two-component model as HIJING but also incorporates an energy dependent cut-off scale, similar to the saturation models.
The other models are listed briefly below. SSHM and SFM did not have a designated short identifier, so they were named somewhat arbitrarily here, based on the physics the models incorporate. SSHM (Saturation for Semi-Hard Minijet) accardi is also a two-component model: pQCD-based for semi-hard partonic interactions, while for the soft particle production it uses the wounded nucleon model. DSM dsm , the Dual String Model, is basically the Dual Parton Model dpm , with the inclusion of strings. SFM (String Fusion Model) perez , is a string model which includes hard collisions, collectivity in the initial state (string fusion), and rescattering of the produced secondaries. Finally, there are the hadronic models, LUCIFER kahana , a cascade model, with input fixed from lower energy data, and LEXUS lexus , a Linear EXtrapolation of Ultrarelativistic nucleon-nucleon Scattering data to nucleus-nucleus collisions.
The available model results range from predicting (or postdicting) at one energy to predicting both and at 19.6, 130 and 200 GeV. The models have varying success in reproducing the data.
In Fig. 16, it can be seen that KLN is among the most successful at describing the centrality dependence for all three energies. However, at =19.6 GeV the theoretical curve is steeper than the data. This results in a reversed centrality dependence relative to the data for the 200 GeV to 19.6 GeV ratio. SSHM describes the 130 and 200 GeV data well, for centralities above 100, which is the approximate limit of applicability for this and other saturation models. For the less central events, the model values are lower than the data. At 19.6 GeV, the model values are significantly higher than the data. The saturation model EKRT describes the central points at both energies but overshoots the more peripheral data points and thus does not reproduce the general centrality dependence of the data. For the non-saturation models included in this figure, Minijet reproduces both the overall scale, as well as the centrality and energy dependence of the data rather well, while the cascade model LUCIFER describes the central points at 130 GeV well, but undershoots the less central values at this energy.
Most of the models included in Fig. 17, provided values for all three energies: 19.6, 130 and 200 GeV. SFM is in reasonable agreement with the 130 and 200 GeV data, but gives much larger values than the data at 19.6 GeV. AMPT is in overall good agreement with the data for the two higher energies, except for the increasing trend in at the most peripheral events, which is not seen in the data. At the lower energy the centrality behavior is underestimated. LEXUS rather severely overshoots the data for all energies, indicating that nucleus-nucleus effects are not accounted for. The HIJING models (version 1.37 and a new version with implemented baryon junctions, HIJING B-) only provide points at 130 and 200 GeV and are in reasonable agreement with the data at those energies, but generally give somewhat lower values. The curves shown include quenching and shadowing implemented in HIJING. DSM describes 19.6 GeV reasonably well for all centralities, and the more central bins for 130 and 200 GeV, but overpredicts the values for semi-central and peripheral events.
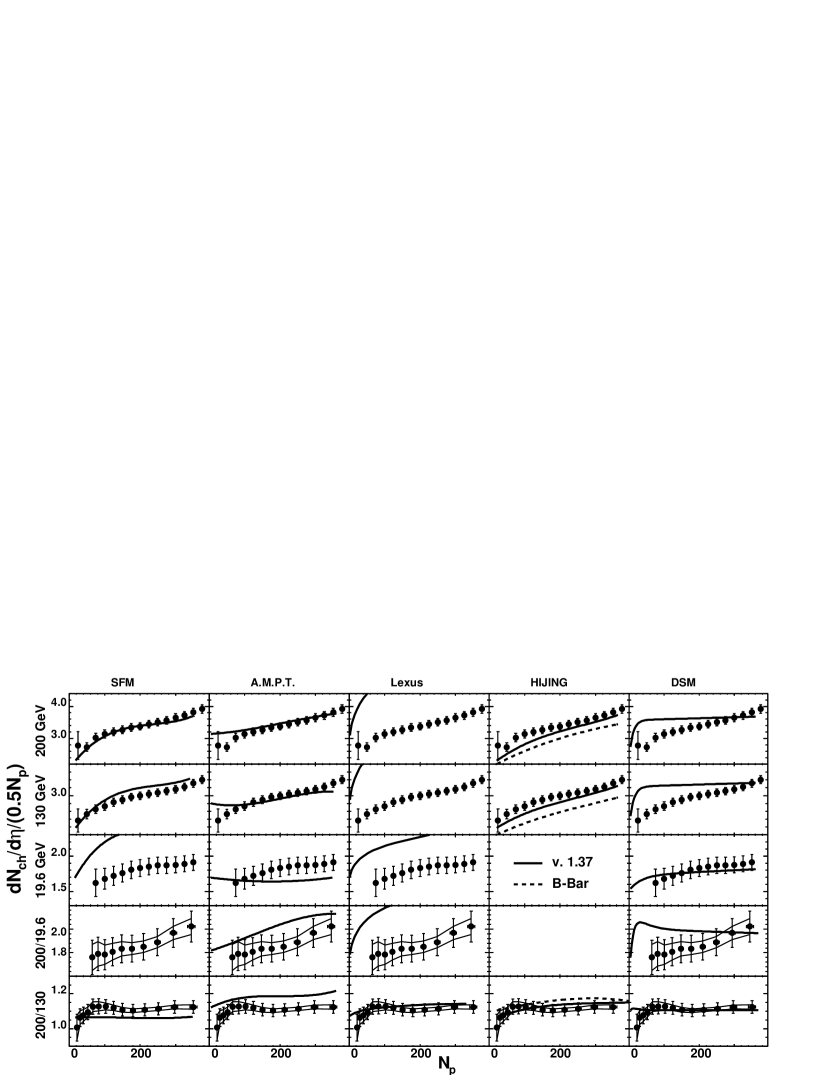
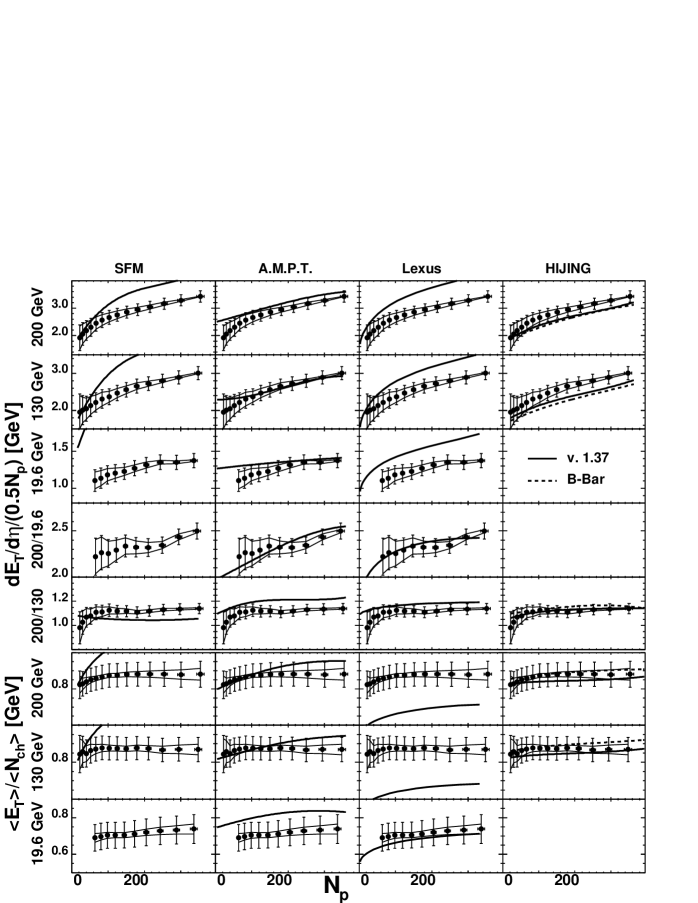
Figure 18 shows the results for the models that provide data for both and . For , LEXUS and SFM consistently overshoot the data for all energies. In the ratio , LEXUS gives values that are too low except at the lowest energy 19.6 GeV. That might indicate that the hadronization mechanism allows too little energy per particle. The SFM gives values that are too large, except for the most peripheral bin, which suggests that the particles are assigned transverse masses that are too large. The HIJING versions and the related AMPT model are in reasonable agreement with the data for both and 888Note that the HIJING versions available at the time the data were collected and used for predictions were in worse agreement with the data phenix_bazik . This was before energy loss and minijet separation/cut-off scale parameters were updated..
Also shown in Fig. 18 are the ratios of results at 200 GeV to 19.6 GeV, and 200 GeV to 130 GeV, for . These results, especially the comparison of the 200 GeV to 19.6 GeV data, is intended to make a more precise check of the dependence of the models. SFM fails to describe the 19.6 GeV data and thus can not describe the energy dependence probed by these ratios, unlike LEXUS which however does not agree well with the individual data curves for 19.6, 130 and 200 GeV. AMPT and the HIJING versions reproduce the values of the ratios well, as expected since they are in reasonable agreement with the individual curves. AMPT and Hijing are also successful in describing the ratio, as illustrated in the lower panels of Fig. 18.
To summarize, most models reproduce at least some of the data fairly well, but most also fail in describing all the data. Since the model results typically are given without systematic errors, it is not entirely straightforward to quantify the level of agreement or disagreement with the data. Qualitatively, the models that are most successful in describing both and in terms of the overall trends, both regarding centrality dependence and energy dependence, are AMPT, and the HIJING versions. KLN and Minijet unfortunately do not give information on but are successful in describing the results. The results thus can either be described by the initial state saturation scenario (KLN) or by the mini-jet models that need an energy-dependent mini-jet cut-off scale as described in new_hijing ; minijet to reproduce the data.
V Summary
This paper presents a systematic study of the energy and centrality dependence of the charged particle multiplicity and transverse energy at mid-rapidity at = 19.6, 130 and 200 GeV.
The yields, divided by the number of participant nucleons, show a consistent centrality dependence (increase from peripheral to central) between and for all energies. Furthermore, the increase in the ratio from 19.6 GeV to 200 GeV is consistent with a 20% increase in with increasing . The ratio shows only a weak centrality dependence at RHIC energies.
For the dependence, comparisons were made not only among RHIC results but also including data from lower energy fixed-target experiments at SPS, AGS and SIS. A phenomenological fit, scaling logarithmically with , describes both and for the most central collisions well for all energies.
Using the fit results, one can separate two regions with different particle production mechanisms. The region below SPS energy is characterized by a steep increase in with , whereas for the energies above SPS is found to be weakly dependent on .
Within the systematic errors of the measurements the shape of the centrality curves of vs. were found to be the same in the range of RHIC energies and to scale with . The same must be true for because has a very weak centrality dependence.
Based on the measurements, the Bjorken energy density estimates were performed and was determined to be GeV/() at = 200 GeV for the most central bin. This is in excess of what is believed to be sufficient for a phase transition to the new state of matter. The energy density increases by about a factor of 2.6 from the top SPS energy to the top RHIC energy.
Finally, a comparison between the RHIC and data and a collection of models was performed. A few models, notably HIJING and AMPT, reproduce both and rather well for several energies.
Acknowledgements.
We thank the staff of the Collider-Accelerator and Physics Departments at Brookhaven National Laboratory and the staff of the other PHENIX participating institutions for their vital contributions. We are grateful for information provided by the model authors. In particular, we thank A. Accardi, S. Barshay, S. Jeon, S. Kahana, D. Kharzeev, Z. Lin, N. Armesto Perez, R. Ugoccioni, V.T. Pop, and X.N. Wang for helpful correspondence. We acknowledge support from the Department of Energy, Office of Science, Nuclear Physics Division, the National Science Foundation, Abilene Christian University Research Council, Research Foundation of SUNY, and Dean of the College of Arts and Sciences, Vanderbilt University (U.S.A), Ministry of Education, Culture, Sports, Science, and Technology and the Japan Society for the Promotion of Science (Japan), Conselho Nacional de Desenvolvimento Científico e Tecnológico and Fundação de Amparo à Pesquisa do Estado de São Paulo (Brazil), Natural Science Foundation of China (People’s Republic of China), Centre National de la Recherche Scientifique, Commissariat à l’Énergie Atomique, Institut National de Physique Nucléaire et de Physique des Particules, and Institut National de Physique Nucléaire et de Physique des Particules, (France), Bundesministerium für Bildung und Forschung, Deutscher Akademischer Austausch Dienst, and Alexander von Humboldt Stiftung (Germany), Hungarian National Science Fund, OTKA (Hungary), Department of Atomic Energy and Department of Science and Technology (India), Israel Science Foundation (Israel), Korea Research Foundation and Center for High Energy Physics (Korea), Russian Ministry of Industry, Science and Tekhnologies, Russian Academy of Science, Russian Ministry of Atomic Energy (Russia), VR and the Wallenberg Foundation (Sweden), the U.S. Civilian Research and Development Foundation for the Independent States of the Former Soviet Union, the US-Hungarian NSF-OTKA-MTA, the US-Israel Binational Science Foundation, and the 5th European Union TMR Marie-Curie Programme.Appendix A Recalculation of the non-PHENIX experimental data
Comparisons of and between different experiments can be made only if the results are presented in the same coordinate system since these values are not boost invariants. In some cases a full set of identified particles measured by one experiment can be recalculated into and . Each case that involves handling non-PHENIX published data is separately explained in this Appendix.
A.1 General
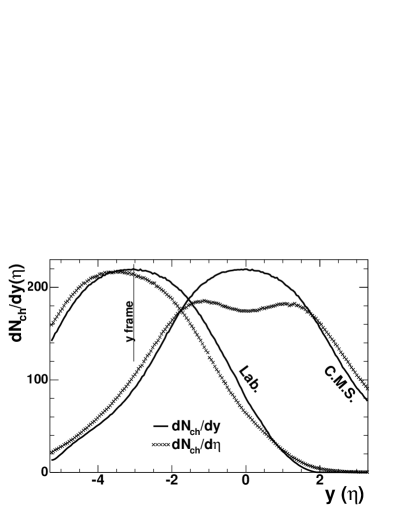
Figure 19 shows simulated rapidity distributions for and in the C.M.S. and Lab. frames. Plots presented here are for illustration purposes only. The invariant distributions which do not change their shape under transition from Lab. to C.M.S. are and , while all others do.
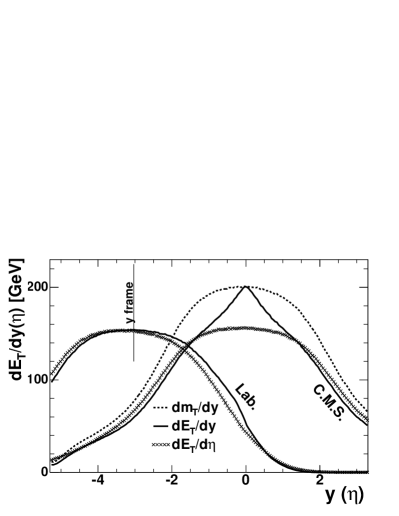
In the C.M.S. system, the transition from “” to “” at mid-rapidity requires a scaling factor between 1.2 and 1.3. An accurate determination of this coefficient from the published data of other experiments is not always possible, therefore for SPS and AGS energies a coefficient of 1.25 was used. Because of the definition of used in this paper, , around mid-rapidity, where is a quadratic sum of the particle mass and transverse momentum: .
In the Lab. system and at maximum rapidity. A 1.04 conversion factor was assigned to the transition from “” to “” in the Lab. system.
An error of 5% was assigned to any converted value. This error also absorbs uncertainties on various assumptions used in the calculations. For example, the contribution of neutral particles to the total is assumed to be:
| (5) |
A.2 Averaging procedure
Average values were calculated for =25, 50,… 375. The centrality bin corresponding to a given can be different in different experiments. per participant and the associated error were deduced by a weighted average interpolation from the two nearest values of each experiment. The closest value was required to be within a proximity of 25 participants from the value. The error bars are multiplied by the -factor, where if or otherwise. See the Particle Data Group reference PDG for details.
A.3 NA49
The identified particle yields in the most central events at mid-rapidity at =17.2 GeV are shown in Fig. 6 in reference na49_1 .
| Particle | p̄ | |||||
|---|---|---|---|---|---|---|
| 167 | 165 | 32 | 15 | 33 | 5 | |
| error | 10 | 10 | 4 | 5 | 1.5 | 0.5 |
The total yields per participant and number of participants are taken from Fig. 10 in reference na49_1 .
| P | 362 | 305 | 242 | 189 | 130 | 72 | 2 | |
|---|---|---|---|---|---|---|---|---|
| P | error | 10 | 15 | 15 | 15 | 10 | 5 | |
| P | 1.65 | 1.64 | 1.55 | 1.48 | 1.40 | 1.42 | 1.42 | |
| P | error | 0.08 | 0.08 | 0.08 | 0.08 | 0.08 | 0.08 | 0.08 |
| P | [GeV/c] | 0.29 | 0.31 | 0.30 | 0.30 | 0.30 | 0.29 | 0.28 |
| P | [GeV/c] | 0.27 | 0.31 | 0.29 | 0.30 | 0.30 | 0.30 | 0.28 |
| P | 0.27 | 0.27 | 0.22 | 0.19 | 0.16 | 0.14 | 0.10 | |
| P | error | 0.02 | 0.02 | 0.02 | 0.02 | 0.02 | 0.02 | 0.02 |
| P | [GeV/c] | 0.57 | 0.54 | 0.50 | 0.49 | 0.53 | 0.55 | 0.45 |
| P | 0.15 | 0.15 | 0.12 | 0.10 | 0.09 | 0.07 | 0.06 | |
| P | error | 0.01 | 0.01 | 0.01 | 0.01 | 0.01 | 0.01 | 0.01 |
| P | [GeV/c] | 0.57 | 0.55 | 0.53 | 0.51 | 0.55 | 0.51 | 0.42 |
| P | [GeV/c] | 0.77 | 0.74 | 0.75 | 0.73 | 0.70 | 0.65 | 0.54 |
| P | 0.03 | 0.03 | 0.03 | 0.03 | 0.03 | 0.02 | 0.02 | |
| P | error | .005 | .005 | .005 | .005 | .005 | .005 | .005 |
| P | [GeV/c] | 0.87 | 0.84 | 0.80 | 0.75 | 0.78 | 0.70 | 0.48 |
| R | [GeV] | 1.47 | 1.50 | 1.35 | 1.29 | 1.23 | 1.15 | 1.00 |
| R | error [GeV] | 0.11 | 0.11 | 0.10 | 0.10 | 0.10 | 0.11 | 0.07 |
| R | 1.75 | 1.74 | 1.62 | 1.54 | 1.46 | 1.44 | 1.38 | |
| R | error | 0.12 | 0.12 | 0.11 | 0.11 | 0.11 | 0.12 | 0.08 |
Using shapes of the distributions shown in Fig. 7 in reference na49_1 for different centrality bins quantities tabulated in 3 and 4 can be converted into and per participant pair at mid-rapidity. Systematic errors on particle yields are given in Table 1 in the same reference. The systematic error on this value is not mentioned in the paper, therefore they were taken from na49_3 . The results used in this paper are also given in Table 4.
For the same and lower , the identified particle yields and were reconstructed using formula (1) and Fig. 1 in reference na49_2 and also Table II and formula (1) and (2) in reference na49_3 . The data obtained from the Tables and the fits are summarized in Table 5. Using and the values of and were recalculated in the C.M.S. frame. The accuracy of the procedure was verified by the consistency of results presented in Table 5 and Table 6.
| =17.2 GeV | |||||||||
|---|---|---|---|---|---|---|---|---|---|
| [GeV] | .180 | .180 | .232 | .226 | .127 | .122 | .127 | .122 | .127 |
| error [GeV] | 0.01 | .010 | .007 | .011 | .004 | .002 | .004 | .002 | .004 |
| 170. | 175. | 29.6 | 16.8 | 23. | 1.4 | 16. | 3.5 | 0.32 | |
| error | 9. | 9. | 1.5 | 0.8 | 7.4 | 0.23 | 6.1 | 0.67 | 0.23 |
| =12.4GeV | |||||||||
| [GeV] | .179 | .179 | .230 | .217 | .133 | .120 | .133 | .120 | .133 |
| error [GeV] | 0.01 | .010 | .008 | .007 | .003 | .001 | .003 | .001 | .003 |
| 132. | 140. | 24.6 | 11.7 | 29. | 0.7 | 17.5 | 0.8 | 0.85 | |
| error | 7. | 7. | 1.2 | 0.6 | 6.2 | 0.06 | 4.4 | 0.08 | 0.28 |
| =8.7 GeV | |||||||||
| [GeV] | .169 | .169 | .232 | .226 | .130 | .137 | .130 | .137 | .130 |
| error [GeV] | 0.01 | 0.01 | .007 | .007 | .002 | .004 | .002 | .004 | .002 |
| 96.6 | 106. | 20.1 | 7.6 | 40. | 0.28 | 17.2 | 0.28 | 1.25 | |
| error | 6. | 6. | 1.0 | 0.4 | 5.8 | 0.08 | 2.9 | 0.08 | 0.37 |
A.4 WA98
The centrality dependence of the , and were read from the plots in Figs. 7 and 14 in reference wa98 and converted to the C.M.S. frame. Results are summarized in Table 7.
| P | 382 | 357 | 311 | 269 | 234 | 201 | 174 | 148 | 128 | 109 | 91 | 75 | 62 | 49 | 39 | |||||
|---|---|---|---|---|---|---|---|---|---|---|---|---|---|---|---|---|---|---|---|---|
| P | error | 11 | 9 | 7 | 7 | 6 | 5 | 5 | 4 | 4 | 4 | 4 | 3 | 3 | 2 | 11 | ||||
| P | [GeV] | 2.09 | 2.06 | 2.06 | 2.05 | 2.03 | 2.00 | 1.95 | 1.96 | 1.93 | 1.87 | 1.84 | 1.78 | 1.73 | 1.70 | 1.59 | ||||
| P | error [GeV] | 0.12 | 0.12 | 0.12 | 0.12 | 0.12 | 0.12 | 0.11 | 0.11 | 0.11 | 0.11 | 0.12 | 0.14 | 0.15 | 0.17 | 0.18 | ||||
| R | [GeV] | 2.00 | 1.97 | 1.97 | 1.97 | 1.95 | 1.92 | 1.88 | 1.88 | 1.85 | 1.80 | 1.76 | 1.71 | 1.67 | 1.63 | 1.53 | ||||
| R | error [GeV] | 0.12 | 0.11 | 0.11 | 0.11 | 0.12 | 0.11 | 0.11 | 0.11 | 0.11 | 0.11 | 0.12 | 0.13 | 0.15 | 0.17 | 0.18 | ||||
| P | 381 | 355 | 310 | 268 | 231 | 199 | 171 | 145 | 124 | 105 | 87 | 72 | 58 | 46 | 36 | 27 | 20 | 13 | 9 | |
| P | error | 10 | 9 | 8 | 7 | 6 | 6 | 6 | 5 | 5 | 5 | 4 | 5 | 4 | 3 | 3 | 3 | 2 | 2 | 12 |
| P | 2.66 | 2.64 | 2.62 | 2.60 | 2.58 | 2.54 | 2.50 | 2.49 | 2.43 | 2.40 | 2.34 | 2.32 | 2.31 | 2.29 | 2.20 | 2.17 | 2.13 | 2.17 | 2.22 | |
| P | error | 0.09 | 0.09 | 0.10 | 0.10 | 0.10 | 0.10 | 0.11 | 0.11 | 0.11 | 0.12 | 0.14 | 0.17 | 0.19 | 0.21 | 0.23 | 0.25 | 0.26 | 0.29 | 0.31 |
| R | 2.13 | 2.11 | 2.10 | 2.08 | 2.07 | 2.03 | 2.00 | 2.00 | 1.94 | 1.92 | 1.88 | 1.85 | 1.85 | 1.83 | 1.76 | 1.74 | 1.71 | 1.74 | 1.78 | |
| R | error | 0.07 | 0.08 | 0.08 | 0.08 | 0.08 | 0.08 | 0.09 | 0.09 | 0.09 | 0.10 | 0.12 | 0.14 | 0.16 | 0.16 | 0.18 | 0.20 | 0.21 | 0.23 | 0.25 |
| P | 383 | 359 | 315 | 276 | 242 | 211 | 185 | 160 | 140 | 123 | 106 | 91 | 78 | 66 | 56 | 49 | ||||
| P | error | 10 | 9 | 8 | 7 | 6 | 5 | 4 | 4 | 3 | 4 | 6 | 6 | 6 | 5 | 5 | 11 | |||
| P | [GeV] | 0.78 | 0.78 | 0.79 | 0.80 | 0.80 | 0.81 | 0.79 | 0.79 | 0.81 | 0.81 | 0.81 | 0.80 | 0.79 | 0.78 | 0.77 | 0.77 | |||
| P | error [GeV] | 0.06 | 0.06 | 0.06 | 0.06 | 0.06 | 0.06 | 0.06 | 0.06 | 0.06 | 0.06 | 0.06 | 0.06 | 0.06 | 0.06 | 0.06 | 0.06 | |||
| R | [GeV] | 0.94 | 0.94 | 0.95 | 0.96 | 0.96 | 0.97 | 0.95 | 0.95 | 1.00 | 0.98 | 0.97 | 0.96 | 0.94 | 0.94 | 0.93 | 0.93 | |||
| R | error [GeV] | 0.07 | 0.07 | 0.07 | 0.07 | 0.07 | 0.07 | 0.07 | 0.07 | 0.07 | 0.07 | 0.07 | 0.07 | 0.07 | 0.07 | 0.07 | 0.07 | |||
A.5 NA45
The NA45/CERES collaboration did not publish results for as a function of centrality at =17.2 GeV. The data was taken from Fig. 6.5 in reference ceres_1 and a 10% error was assigned based on the analysis procedure. The number of participants was taken for the corresponding cross section bin reported by the NA50 results na50_1 . At the lower energy, the results were originally published in ceres_2 and then was subsequently corrected, see e.g.: ceres_3 . The results presented in Fig. 4 in reference ceres_3 for charged hadrons and were added together to get and then converted to in the C.M.S. frame. The published and recalculated results are summarized in Table 8.
| =17.2 GeV | ||||||||
|---|---|---|---|---|---|---|---|---|
| P | bin | 0-2.3 | 2.3-5 | 5-8 | 8-12 | 12-18 | 18-23 | 23-35 |
| P | 420 | 350 | 300 | 250 | 210 | 170 | 125 | |
| R | 360 | 331 | 300 | 264 | 220 | 179 | 132 | |
| R | error | 10. | 10 | 9 | 8 | 7 | 7 | 6 |
| R | 1.87 | 1.69 | 1.60 | 1.51 | 1.53 | 1.52 | 1.52 | |
| R | error | 0.19 | 0.18 | 0.17 | 0.16 | 0.16 | 0.16 | 0.17 |
| =8.7GeV | ||||||||
| P | 368 | 335 | 287 | 238 | 183 | 120 | ||
| P | 129 | 113 | 94 | 78 | 58 | 38 | ||
| P | error | 15 | 14 | 12 | 11 | 9 | 9 | |
| P | 52 | 46 | 39 | 30 | 22 | 15 | ||
| P | error | 12 | 8 | 8 | 7 | 6 | 6 | |
| R | 1.35 | 1.30 | 1.27 | 1.25 | 1.21 | 1.21 | ||
| R | error | 0.08 | 0.08 | 0.08 | 0.09 | 0.10 | 0.12 | |
A.6 NA50
Results on are taken from Tables 1 and 2 in reference na50_1 and on multiplicity from Figs. 2 and 4 tabulated in captions in reference na50_1 . The systematic errors are mentioned in the text. There is some discrepancy in the results of NA50 and NA45 as shown in Fig. 12. In this respect the comparison made in Table 3 in reference na50_1 is unclear. The results were converted to the C.M.S. frame. Recalculated values are given in Table 9.
| =17.2 GeV | ||||||
|---|---|---|---|---|---|---|
| 354 | 294 | 246 | 205 | 173 | 129 | |
| error | 12 | 10 | 8 | 8 | 8 | 11 |
| 1.98 | 1.98 | 1.94 | 1.95 | 1.95 | 2.10 | |
| error | 0.16 | 0.16 | 0.16 | 0.16 | 0.16 | 0.17 |
| =8.7GeV | ||||||
| 356 | 295 | 245 | 204 | 170 | 127 | |
| error | 12 | 10 | 8 | 8 | 8 | 11 |
| 0.95 | 0.90 | 0.90 | 0.89 | 0.90 | 0.92 | |
| error | 0.10 | 0.09 | 0.09 | 0.09 | 0.09 | 0.09 |
A.7 E802/E917
The centrality dependence of , yields and were recalculated from Tables V and VI in reference e802_1 . Number of participants are taken from Table II in the same publication. The results are presented in Table 10.
| P | pairs | 181 | 168 | 152 | 134 | 113 | 89.5 | 62.5 | 26.9 |
|---|---|---|---|---|---|---|---|---|---|
| E | 64.5 | 56.8 | 47.6 | 39.6 | 33.3 | 25.8 | 17.8 | 6.89 | |
| E | error | 3.13 | 2.55 | 2.75 | 1.75 | 1.68 | 1.37 | 0.89 | 0.28 |
| E | [GeV] | .398 | .392 | .387 | .385 | .375 | .365 | .362 | .361 |
| E | error | .013 | .013 | .014 | .012 | .041 | .011 | .010 | .011 |
| E | 10.6 | 9.28 | 8.12 | 6.17 | 4.91 | 3.73 | 2.22 | 0.74 | |
| E | error | 0.45 | 0.37 | 0.32 | 0.27 | 0.21 | 0.16 | 0.11 | 0.04 |
| E | [GeV] | .809 | .787 | .774 | .785 | .770 | .740 | .743 | .685 |
| E | error | .034 | .032 | .028 | .028 | .030 | .027 | .025 | .021 |
| E | 62.8 | 57.0 | 49.4 | 43.0 | 33.7 | 25.2 | 16.5 | 6.2 | |
| E | error | 1.7 | 1.5 | 1.4 | 1 | 1 | 1 | 1 | 1 |
| E | [GeV] | 1.25 | 1.26 | 1.24 | 1.23 | 1.21 | 1.19 | 1.17 | 1.14 |
| R | .608 | .580 | .527 | .492 | .460 | .426 | .396 | .335 | |
| R | error [GeV] | .146 | .138 | .125 | .116 | .111 | .103 | .098 | .131 |
| R | .903 | .865 | .812 | .773 | .751 | .725 | .699 | .621 | |
| R | error | .135 | .130 | .122 | .116 | .112 | .108 | .108 | .207 |
| R | [GeV] | .673 | .670 | .649 | .636 | .612 | .588 | .567 | .540 |
| R | error [GeV] | .127 | .123 | .120 | .117 | .115 | .111 | .111 | .112 |
ratio was assigned a value of 0.17 for all centralities based on Tables II and III in reference e802_2 . This is consistent with results reported in Fig. 6 in reference e802_3 and Fig. 11 in reference e802_5 . The proton production reported in Table IV in reference e802_1 was compared to measurements reported in Fig. 2 in reference e917_4 and Fig. 10 in reference e802_5 for different centrality bins. The results are consistent. ratio was assigned a value of 0.0003 based on Fig. 11 in reference e802_5 . A 25% enhancement in ratio for low reported in e802_6 for the most central bin is not clearly seen in Fig. 11 in reference e802_5 for all centralities. Such an enhancement would contribute an additional 8-9% to the total particle and transverse energy production. This is less than the systematic error on the result and the recalculation error, and thus this effect is not considered. The resulting values shown in Table 10 are recalculated to mid-rapidity in the C.M.S. frame.
For the lower the information about particle yields and was extracted for and from Table II and I in reference e802_7 respectively, for from Table I in reference e802_8 and for from Fig. 2 in reference e917_4 . The same assumptions as above were made to recalculate values plotted in Figs. 13 and 14. The numbers are given in Table 11.
A.8 Averaging procedure at =8.7 GeV
The averaging procedure is slightly different for this curve. First the average results of NA45 and NA50 are produced. Then at =350, this result is combined with the NA49 measurement using the weighted error method. A scaling coefficient before and after NA49 averaging is calculated. The NA45/NA50 combined result is scaled by this factor for all values of .
A.9 FOPI
The FOPI results for were calculated for 400A MeV based on the data plotted in Fig. 21 in reference fopi_1 . The points were read at the angle corresponding to the mid-rapidity angle () and then converted to resulting in 394 at =2.053 GeV.
| Z | 1 | 2 | 3 | 4 | 5-6 |
|---|---|---|---|---|---|
| 43. | 12. | 2. | 0.5 | 0.25 | |
| error | 4.3 | 1.2 | 0.2 | .05 | .025 |
The corresponding number of participants for a 42 mb event sample is 359 based on Fig. 8 in reference fopi_2 . Data for 150A MeV were compiled based on the comparison between Fig. 13 and Fig. 14 in reference fopi_1 and the used definition of rapidity , resulting in = 405 at = 1.937 GeV.
The estimate of the production at 400A MeV is made based on a comparison of the total yields of the particles with in fopi_1 and yields of protons and deuterons published in fopi_3 . That allowed to determine number of all pions at mid-rapidity to be 20.6 and number of all hadrons with Z=1 15.2. Assuming that the particle temperatures are equal to =40 MeV (exact numbers are published in fopi_2 ; fopi_3 ), one can estimate that the contribution to from pions is and from baryons is , according to the definition of used in this paper. Resulting number of 5.0 GeV is a lower limit estimate because the contribution of heavier particles is not considered. A conservative error of 30% is assigned to this number.
A.10 PHOBOS measurement at =56 GeV
The PHOBOS experiment published =40812(stat)30(syst) at = 56 GeV measured for =3304(stat)(syst) in phobos1 . In the same paper per participant between 130 GeV and 56 GeV is measured to increase by 1.310.04(stat)0.05(syst). That allows for use of the averaged value at =130 GeV consistent with the PHOBOS result published in phobos2 to recalculate at = 56 GeV with smaller systematic error. This value is plotted in Fig. 13.
Appendix B Output tables.
| bin [%] | 0-5 | 5-10 | 10-15 | 15-20 | 20-25 | 25-30 | 30-35 | 35-40 | 40-45 | 45-50 | 50-55 | 55-60 | 60-65 | 65-70 |
|---|---|---|---|---|---|---|---|---|---|---|---|---|---|---|
| 353. | 300. | 254. | 215. | 181. | 151. | 125. | 103. | 83.3 | 66.7 | 52.5 | 40.2 | 30.2 | 22.0 | |
| syst. error | 10. | 9.0 | 8.1 | 7.3 | 6.6 | 6.0 | 5.5 | 5.1 | 4.7 | 4.3 | 4.1 | 3.8 | 3.6 | 3.4 |
| [fm2] | 140. | 125. | 112. | 100. | 90.8 | 82.2 | 73.9 | 66.8 | 60.0 | 54.3 | 49.3 | 45.1 | 40.9 | 37.5 |
| syst. error | 11. | 10. | 9.1 | 8.2 | 7.4 | 6.8 | 6.2 | 5.7 | 5.2 | 4.8 | 4.6 | 4.5 | 4.5 | 4.9 |
| [GeV] | 606. | 493. | 402. | 328. | 266. | 216. | 173. | 137. | 107. | 81.8 | 60.4 | 43.9 | 31.1 | 21.1 |
| stat. error | 0.6 | 0.6 | 0.5 | 0.5 | 0.4 | 0.4 | 0.3 | 0.3 | 0.2 | 0.2 | 0.2 | 0.1 | 0.1 | 0.1 |
| bending syst. error | 2.4 | 5.1 | 7.0 | 7.6 | 8.2 | 8.5 | 8.2 | 8.1 | 7.6 | 6.9 | 6.4 | 5.5 | 4.6 | 3.9 |
| full syst. error | 32. | 27. | 22. | 19. | 16. | 14. | 12. | 11. | 9.5 | 8.1 | 7.2 | 5.9 | 4.9 | 4.0 |
| [GeV fm-2 c-1] | 5.4 | 4.9 | 4.5 | 4.1 | 3.7 | 3.3 | 2.9 | 2.6 | 2.2 | 1.9 | 1.5 | 1.2 | 1.0 | 0.7 |
| full syst. error | 0.6 | 0.5 | 0.5 | 0.5 | 0.4 | 0.4 | 0.4 | 0.3 | 0.3 | 0.3 | 0.2 | 0.2 | 0.2 | 0.2 |
| [GeV] | 3.43 | 3.28 | 3.16 | 3.05 | 2.94 | 2.86 | 2.76 | 2.66 | 2.57 | 2.45 | 2.30 | 2.18 | 2.06 | 1.92 |
| bending syst. error | 0.01 | 0.03 | 0.05 | 0.07 | 0.09 | 0.12 | 0.14 | 0.17 | 0.19 | 0.22 | 0.27 | 0.31 | 0.36 | 0.43 |
| full syst. error | 0.21 | 0.20 | 0.20 | 0.20 | 0.21 | 0.22 | 0.23 | 0.25 | 0.27 | 0.29 | 0.33 | 0.36 | 0.41 | 0.47 |
| 687. | 560. | 457. | 372. | 302. | 246. | 197. | 156. | 124. | 95.3 | 70.9 | 52.2 | 37.5 | 25.6 | |
| stat. error | 0.7 | 0.6 | 0.5 | 0.5 | 0.4 | 0.4 | 0.3 | 0.3 | 0.2 | 0.2 | 0.2 | 0.1 | 0.1 | 0.1 |
| bending syst. error | 25. | 17. | 14. | 11. | 10. | 9.9 | 9.4 | 9.0 | 8.2 | 7.8 | 7.1 | 6.1 | 5.2 | 4.4 |
| full syst. error | 37. | 28. | 22. | 18. | 16. | 14. | 12. | 11. | 9.6 | 8.6 | 7.6 | 6.5 | 5.4 | 4.5 |
| 3.89 | 3.73 | 3.59 | 3.45 | 3.34 | 3.25 | 3.15 | 3.05 | 2.96 | 2.86 | 2.70 | 2.60 | 2.48 | 2.33 | |
| bending syst. error | 0.14 | 0.12 | 0.11 | 0.10 | 0.12 | 0.14 | 0.16 | 0.19 | 0.21 | 0.25 | 0.30 | 0.35 | 0.41 | 0.49 |
| full syst. error | 0.23 | 0.22 | 0.21 | 0.21 | 0.21 | 0.22 | 0.24 | 0.26 | 0.28 | 0.32 | 0.36 | 0.41 | 0.46 | 0.55 |
| [GeV] | 0.881 | 0.879 | 0.881 | 0.882 | 0.881 | 0.880 | 0.875 | 0.874 | 0.866 | 0.858 | 0.851 | 0.840 | 0.828 | 0.823 |
| bending syst. error | 0.032 | 0.026 | 0.021 | 0.017 | 0.015 | 0.012 | 0.011 | 0.010 | 0.011 | 0.013 | 0.017 | 0.023 | 0.032 | 0.047 |
| full syst. error | 0.071 | 0.069 | 0.067 | 0.066 | 0.065 | 0.065 | 0.064 | 0.064 | 0.064 | 0.064 | 0.064 | 0.065 | 0.068 | 0.076 |
| bin [%] | 0-5 | 5-10 | 10-15 | 15-20 | 20-25 | 25-30 | 30-35 | 35-40 | 40-45 | 45-50 | 50-55 | 55-60 | 60-65 | 65-70 |
|---|---|---|---|---|---|---|---|---|---|---|---|---|---|---|
| 348. | 294. | 250. | 211. | 179. | 150. | 125. | 103. | 83.2 | 66.3 | 52.1 | 40.1 | 30.1 | 21.9 | |
| syst. error | 10.0 | 8.9 | 8.0 | 7.2 | 6.6 | 6.0 | 5.5 | 5.1 | 4.7 | 4.3 | 4.0 | 3.8 | 3.6 | 3.4 |
| [fm2] | 138. | 123. | 110. | 99.5 | 89.4 | 80.6 | 72.8 | 65.8 | 59.5 | 54.3 | 49.0 | 44.8 | 40.9 | 37.4 |
| syst. error | 11. | 9.9 | 8.9 | 8.1 | 7.3 | 6.6 | 6.1 | 5.6 | 5.2 | 4.8 | 4.6 | 4.5 | 4.6 | 4.8 |
| [GeV] | 523. | 425. | 349. | 287. | 237. | 191. | 154. | 122. | 96.0 | 73.3 | 55.5 | 41.0 | 30.2 | 21.4 |
| stat. error | 0.9 | 0.9 | 0.8 | 0.7 | 0.6 | 0.6 | 0.5 | 0.4 | 0.4 | 0.3 | 0.3 | 0.2 | 0.2 | 0.2 |
| bending syst. error | 2.6 | 4.2 | 5.6 | 7.0 | 7.5 | 7.6 | 7.5 | 7.0 | 7.3 | 6.2 | 5.8 | 5.1 | 4.4 | 4.1 |
| full syst. error | 27. | 22. | 19. | 16. | 14. | 12. | 11. | 9.4 | 8.8 | 7.3 | 6.5 | 5.5 | 4.7 | 4.2 |
| [GeV fm-2 c-1] | 4.7 | 4.3 | 3.9 | 3.6 | 3.3 | 3.0 | 2.6 | 2.3 | 2.0 | 1.7 | 1.4 | 1.1 | 0.9 | 0.7 |
| full syst. error | 0.5 | 0.5 | 0.4 | 0.4 | 0.4 | 0.3 | 0.3 | 0.3 | 0.3 | 0.2 | 0.2 | 0.2 | 0.2 | 0.2 |
| [GeV] | 3.01 | 2.89 | 2.80 | 2.72 | 2.65 | 2.56 | 2.47 | 2.37 | 2.31 | 2.21 | 2.13 | 2.05 | 2.01 | 1.95 |
| bending syst. error | 0.01 | 0.03 | 0.05 | 0.07 | 0.09 | 0.10 | 0.12 | 0.14 | 0.19 | 0.20 | 0.24 | 0.29 | 0.34 | 0.45 |
| full syst. error | 0.18 | 0.18 | 0.18 | 0.18 | 0.19 | 0.20 | 0.21 | 0.22 | 0.25 | 0.26 | 0.30 | 0.34 | 0.39 | 0.49 |
| 602. | 488. | 403. | 329. | 270. | 219. | 176. | 139. | 109. | 84.1 | 64.3 | 48.4 | 35.2 | 25.3 | |
| stat. error | 1.4 | 1.2 | 1.1 | 0.9 | 0.8 | 0.7 | 0.6 | 0.5 | 0.4 | 0.3 | 0.3 | 0.3 | 0.2 | 0.2 |
| bending syst. error | 19. | 13. | 10. | 9.9 | 8.6 | 8.4 | 8.3 | 7.7 | 7.5 | 6.4 | 5.9 | 5.2 | 4.3 | 4.1 |
| full syst. error | 28. | 22. | 17. | 15. | 13. | 11. | 10. | 9.1 | 8.4 | 7.0 | 6.3 | 5.4 | 4.5 | 4.1 |
| 3.46 | 3.32 | 3.23 | 3.12 | 3.03 | 2.93 | 2.82 | 2.70 | 2.63 | 2.54 | 2.47 | 2.41 | 2.34 | 2.31 | |
| bending syst. error | 0.11 | 0.09 | 0.08 | 0.09 | 0.10 | 0.12 | 0.14 | 0.16 | 0.19 | 0.21 | 0.25 | 0.30 | 0.35 | 0.47 |
| full syst. error | 0.19 | 0.18 | 0.17 | 0.18 | 0.18 | 0.19 | 0.21 | 0.22 | 0.25 | 0.27 | 0.31 | 0.35 | 0.41 | 0.52 |
| [GeV] | 0.869 | 0.870 | 0.867 | 0.874 | 0.877 | 0.873 | 0.875 | 0.876 | 0.878 | 0.871 | 0.864 | 0.847 | 0.857 | 0.844 |
| bending syst. error | 0.028 | 0.023 | 0.019 | 0.016 | 0.015 | 0.014 | 0.014 | 0.016 | 0.020 | 0.025 | 0.033 | 0.043 | 0.060 | 0.083 |
| full syst. error | 0.066 | 0.064 | 0.063 | 0.062 | 0.062 | 0.062 | 0.062 | 0.063 | 0.064 | 0.065 | 0.068 | 0.073 | 0.084 | 0.101 |
| bin [%] | 0-5 | 5-10 | 10-15 | 15-20 | 20-25 | 25-30 | 30-35 | 35-40 | 40-45 | 45-50 |
|---|---|---|---|---|---|---|---|---|---|---|
| 336. | 288. | 243. | 204. | 172. | 144. | 120. | 98.4 | 79.8 | 63.8 | |
| syst. error | 9.7 | 8.8 | 7.9 | 7.1 | 6.4 | 5.9 | 5.4 | 5.0 | 4.6 | 4.3 |
| [fm2] | 133. | 119. | 106. | 95.6 | 85.8 | 77.2 | 69.7 | 62.7 | 56.7 | 51.3 |
| syst. error | 11. | 9.6 | 8.6 | 7.8 | 7.0 | 6.4 | 5.8 | 5.3 | 4.9 | 4.6 |
| [GeV] | 230. | 194. | 164. | 134. | 109. | 88.4 | 72.0 | 58.1 | 45.3 | 35.2 |
| stat. error | 0.8 | 0.8 | 0.8 | 0.7 | 0.5 | 0.5 | 0.4 | 0.4 | 0.3 | 0.3 |
| bending syst. error | 1.7 | 2.6 | 2.9 | 4.0 | 3.8 | 3.8 | 3.9 | 3.9 | 3.9 | 3.4 |
| full syst. error | 14. | 12. | 11. | 9.3 | 7.8 | 6.7 | 6.0 | 5.3 | 4.8 | 4.0 |
| [GeV fm-2 c-1] | 2.2 | 2.0 | 1.9 | 1.8 | 1.6 | 1.4 | 1.3 | 1.2 | 1.0 | 0.9 |
| full syst. error | 0.2 | 0.2 | 0.2 | 0.2 | 0.2 | 0.2 | 0.2 | 0.2 | 0.1 | 0.1 |
| [GeV] | 1.37 | 1.35 | 1.35 | 1.31 | 1.27 | 1.22 | 1.20 | 1.18 | 1.13 | 1.10 |
| bending syst. error | 0.01 | 0.02 | 0.02 | 0.04 | 0.05 | 0.05 | 0.07 | 0.08 | 0.10 | 0.11 |
| full syst. error | 0.09 | 0.09 | 0.10 | 0.10 | 0.10 | 0.10 | 0.11 | 0.12 | 0.14 | 0.15 |
| 312. | 265. | 226. | 187. | 154. | 125. | 102. | 82.6 | 65.0 | 51.1 | |
| stat. error | 0.9 | 0.9 | 0.9 | 0.8 | 0.7 | 0.6 | 0.5 | 0.4 | 0.4 | 0.3 |
| bending syst. error | 5.3 | 4.5 | 4.4 | 5.4 | 4.9 | 5.3 | 5.2 | 5.1 | 5.1 | 4.2 |
| full syst. error | 21. | 18. | 15. | 13. | 11. | 9.7 | 8.5 | 7.4 | 6.6 | 5.4 |
| 1.86 | 1.84 | 1.85 | 1.83 | 1.78 | 1.74 | 1.71 | 1.68 | 1.63 | 1.60 | |
| bending syst. error | 0.03 | 0.03 | 0.04 | 0.05 | 0.06 | 0.08 | 0.09 | 0.11 | 0.14 | 0.14 |
| full syst. error | 0.14 | 0.14 | 0.14 | 0.14 | 0.14 | 0.15 | 0.16 | 0.17 | 0.19 | 0.20 |
| [GeV] | 0.738 | 0.733 | 0.728 | 0.720 | 0.711 | 0.705 | 0.704 | 0.704 | 0.697 | 0.690 |
| bending syst. error | 0.027 | 0.023 | 0.020 | 0.017 | 0.015 | 0.014 | 0.014 | 0.016 | 0.019 | 0.024 |
| full syst. error | 0.078 | 0.076 | 0.075 | 0.073 | 0.072 | 0.071 | 0.071 | 0.071 | 0.072 | 0.072 |
| bin [%] | 0-5 | 5-10 | 10-15 | 15-20 | 20-25 | 25-30 | 30-35 | 35-40 | 40-45 | 45-50 | 50-55 | 55-60 | 60-65 | 65-70 |
|---|---|---|---|---|---|---|---|---|---|---|---|---|---|---|
| 200 GeV/130 GeV | ||||||||||||||
| 350. | 297. | 252. | 213. | 180. | 150. | 125. | 103. | 83.2 | 66.5 | 52.3 | 40.2 | 30.2 | 22.0 | |
| syst. error | 10. | 9.0 | 8.1 | 7.3 | 6.6 | 6.0 | 5.5 | 5.1 | 4.7 | 4.3 | 4.1 | 3.8 | 3.6 | 3.4 |
| 1.14 | 1.13 | 1.13 | 1.12 | 1.11 | 1.12 | 1.12 | 1.12 | 1.11 | 1.11 | 1.08 | 1.07 | 1.03 | 0.98 | |
| bending syst. error | 0.01 | 0.01 | 0.01 | 0.01 | 0.01 | 0.02 | 0.02 | 0.03 | 0.04 | 0.05 | 0.05 | 0.07 | 0.09 | 0.13 |
| full syst. error | 0.04 | 0.04 | 0.04 | 0.04 | 0.04 | 0.05 | 0.05 | 0.05 | 0.06 | 0.06 | 0.07 | 0.08 | 0.10 | 0.13 |
| 1.12 | 1.12 | 1.11 | 1.11 | 1.10 | 1.11 | 1.12 | 1.13 | 1.13 | 1.13 | 1.10 | 1.08 | 1.06 | 1.01 | |
| bending syst. error | 0.01 | 0.01 | 0.01 | 0.01 | 0.01 | 0.01 | 0.02 | 0.02 | 0.03 | 0.03 | 0.03 | 0.03 | 0.04 | 0.07 |
| full syst. error | 0.04 | 0.04 | 0.04 | 0.04 | 0.04 | 0.04 | 0.04 | 0.04 | 0.04 | 0.04 | 0.04 | 0.05 | 0.05 | 0.08 |
| 200 GeV/19.6 GeV | ||||||||||||||
| 344. | 294. | 249. | 210. | 177. | 148. | 122. | 101. | 81.6 | 65.2 | |||||
| syst. error | 10. | 9.0 | 8.1 | 7.3 | 6.6 | 6.0 | 5.5 | 5.1 | 4.7 | 4.3 | ||||
| 2.50 | 2.43 | 2.34 | 2.32 | 2.32 | 2.34 | 2.29 | 2.25 | 2.26 | 2.22 | |||||
| bending syst. error | 0.02 | 0.03 | 0.04 | 0.06 | 0.07 | 0.09 | 0.11 | 0.13 | 0.17 | 0.19 | ||||
| full syst. error | 0.09 | 0.09 | 0.09 | 0.10 | 0.10 | 0.12 | 0.13 | 0.15 | 0.19 | 0.20 | ||||
| 2.09 | 2.03 | 1.94 | 1.89 | 1.87 | 1.87 | 1.84 | 1.81 | 1.82 | 1.79 | |||||
| bending syst. error | 0.08 | 0.06 | 0.06 | 0.06 | 0.06 | 0.07 | 0.08 | 0.10 | 0.12 | 0.13 | ||||
| full syst. error | 0.15 | 0.14 | 0.13 | 0.13 | 0.13 | 0.14 | 0.14 | 0.15 | 0.17 | 0.17 | ||||
| 375 | 350 | 325 | 300 | 275 | 250 | 225 | 200 | 175 | 150 | 125 | 100 | 75 | 50 | 25 | |
|---|---|---|---|---|---|---|---|---|---|---|---|---|---|---|---|
| 200 GeV | 3.92 | 3.81 | 3.72 | 3.65 | 3.56 | 3.51 | 3.45 | 3.38 | 3.34 | 3.27 | 3.20 | 3.14 | 3.03 | 2.73 | 2.78 |
| error | 0.13 | 0.13 | 0.12 | 0.12 | 0.12 | 0.12 | 0.12 | 0.11 | 0.12 | 0.12 | 0.12 | 0.13 | 0.13 | 0.13 | 0.43 |
| 130 GeV | 3.41 | 3.31 | 3.22 | 3.16 | 3.11 | 3.07 | 3.04 | 3.00 | 2.96 | 2.89 | 2.83 | 2.73 | 2.65 | 2.53 | 2.36 |
| error | 0.10 | 0.10 | 0.10 | 0.10 | 0.09 | 0.09 | 0.10 | 0.09 | 0.10 | 0.10 | 0.10 | 0.11 | 0.11 | 0.12 | 0.30 |
| 19.6 GeV | 1.91 | 1.89 | 1.88 | 1.87 | 1.87 | 1.85 | 1.83 | 1.81 | 1.76 | 1.72 | 1.68 | 1.62 | |||
| error | 0.11 | 0.11 | 0.11 | 0.11 | 0.12 | 0.12 | 0.12 | 0.12 | 0.13 | 0.14 | 0.15 | 0.19 | |||
| 17.2 GeV | 1.97 | 1.93 | 1.90 | 1.88 | 1.83 | 1.80 | 1.78 | 1.75 | 1.72 | 1.69 | 1.66 | 1.66 | 1.61 | 1.54 | 1.45 |
| error | 0.12 | 0.12 | 0.14 | 0.15 | 0.16 | 0.17 | 0.17 | 0.17 | 0.17 | 0.17 | 0.16 | 0.23 | 0.21 | 0.19 | 0.13 |
| 8.7 GeV | 1.26 | 1.22 | 1.20 | 1.18 | 1.17 | 1.16 | 1.16 | 1.14 | 1.14 | 1.14 | 1.14 | 1.14 | |||
| error | 0.11 | 0.11 | 0.11 | 0.10 | 0.10 | 0.10 | 0.10 | 0.10 | 0.09 | 0.09 | 0.09 | 0.09 | |||
| 4.8 GeV | 0.92 | 0.89 | 0.85 | 0.81 | 0.78 | 0.76 | 0.75 | 0.74 | 0.72 | 0.71 | 0.70 | 0.67 | 0.64 | 0.63 | |
| error | 0.14 | 0.13 | 0.13 | 0.12 | 0.12 | 0.11 | 0.11 | 0.11 | 0.11 | 0.11 | 0.11 | 0.14 | 0.18 | 0.21 |
References
- (1) H. Hahn et al. , Nucl. Instrum. Methods A499, 245-263 (2003).
- (2) PHENIX Collaboration, K. Adcox et al. , Nucl. Instrum. Methods A499, 469-479 (2003).
- (3) K. Adcox et al. , Nucl. Instrum. Methods A497, 263-293 (2003).
- (4) L. Aphechetche et al. , Nucl. Instrum. Methods A499, 521-536 (2003).
- (5) M. Allen et al. , Nucl. Instrum. Methods A499, 549-559 (2003).
- (6) S. Adler et al. , Nucl. Instrum. Methods A470, 488-499 (2001).
- (7) PHENIX Collaboration, K. Adcox et al. , Phys. Rev. Lett. 87, 052301 (2001).
- (8) PHENIX Collaboration, K. Adcox et al. , Phys. Rev. Lett. 86, 3500 (2001).
- (9) A. Milov for the PHENIX Collaboration, Nucl. Phys. A698, 171 (2002).
- (10) A. Bazilevsky for the PHENIX Collaboration, Nucl. Phys. A715, 486 (2003).
- (11) D. Silvermyr, Ph.D. Thesis. Lund University (2001).
- (12) A. Milov, Ph.D. Thesis. The Weizmann Institute of Science (2002).
- (13) PHENIX Collaboration, K. Adcox et al. , Phys. Rev. Lett. 88, 242301 (2002).
- (14) GEANT 3.2.1, CERN program library.
- (15) X.N. Wang and M. Gyulassy, Phys. Rev. D44, 3501 (1991).
- (16) PHENIX Collaboration, S.S. Adler et al. , Phys. Rev. C69, 034909 (2004).
- (17) J. Bächler for the NA49 collaboration, Nucl. Phys. A661, 45 (1999).
- (18) M. van Leeuwen for the NA49 collaboration, Nucl. Phys. A715, 161 (2003).
- (19) NA49 Collaboration, S.V. Afanasiev et al. , Phys. Rev. C66, 054902 (2002).
- (20) K. Hagiwara et al. , http://pdg.lbl.gov, Phys. Rev. D66, 010001 (2002).
-
(21)
B. Hahn, D.G. Ravenhall and R. Hofstadter,
Phys. Rev, 101, 1131 (1956), and
C.W. De Jager et al. , Atomic Data and Nuclear Table 24, 479 (1974). - (22) PHOBOS Collaboration, B.B. Back et al. , nucl-ex/0210015.
- (23) E-802 Collaboration, T. Abbott et al. , Phys. Rev. C63, 064602 (2001).
- (24) PHENIX Collaboration, K. Adcox et al. , Phys. Rev. C66, 024901 (2002).
- (25) WA98 Collaboration, M.M. Aggarval et al. , Eur. Phys. J. C18, 651 (2001).
- (26) PHENIX Collaboration, S.S. Adler et al. , Phys. Rev. Lett. 91, 241803-1 (2003).
- (27) M. Gyulassy, nucl-th/0106072.
- (28) A. Krasnitz, Y. Nara, R. Venugopalan, hep-ph/0305112, Nucl. Phys. A727, 427-436 (2003).
- (29) J.D. Bjorken, Phys. Rev. D27, 140 (1983).
- (30) NA49 Collaboration, T. Alber et al. , Phys. Rev. Lett. 75, 3814 (1995).
- (31) STAR Collaboration, J. Adams et al. , nucl-ex/0311017.
- (32) BRAHMS Collaboration, I.G. Bearden et al. , Phys. Lett. B523, 227 (2001).
- (33) BRAHMS Collaboration, I.G. Bearden et al. , Phys. Rev. Lett. 88, 202301 (2002).
- (34) PHOBOS Collaboration, B.B. Back et al. , Phys. Rev. Lett. 85, 3100 (2000).
- (35) PHOBOS Collaboration, B.B. Back et al. , Phys. Rev. C65, 061901 (2002).
- (36) M.D. Baker et al. for the PHOBOS Collaboration,, Nucl. Phys. A715, 65c-74c (2003).
- (37) T.S. Ullrich for the STAR Collaboration, nucl-ex/0305018.
- (38) T.S. Ullrich for the STAR Collaboration, Nucl. Phys. A715, 399 (2003).
- (39) STAR Collaboration, J Adams et al. , nucl-ex/0407003.
- (40) D. Mis̀kowiec for the CERES Collaboration, Proc. of CIPPQG Palaiseau, September 2001.
- (41) NA50 Collaboration, M.C. Abreu et al. , Phys. Lett. B530, 43 (2002).
- (42) NA57 Collaboration, F. Antinori et al. , nucl-ex/0406004.
- (43) PHOBOS Collaboration, B.B. Back et al. , nucl-ex/0301017
- (44) UA5 Collaboration, G.J. Alner et al. , Z. Phys. C33, 1-6 (1986).
- (45) W. Thome et al. , Nucl. Phys. B129, 365-389 (1977).
- (46) X.N. Wang et al. , Phys. Rev. C68, 054902 (2003).
- (47) B. Andersson et al. , Nucl. Phys. B281, 289 (2003).
- (48) K.J. Eskola et al. , Nucl. Phys. B570, 379 (2000); Phys. Lett. B497, 39 (2001).
- (49) D. Kharzeev and M. Nardi, Phys. Lett. B507, 121 (2001); D. Kharzeev and E. Levin, Phys. Lett. B523, 79 (2001).
- (50) S. Lee and X.N. Wang, Phys. Lett. B527, 85 (2002).
- (51) Z. Lin et al. , Phys. Rev. C64, 011902 (2001).
- (52) A. Accardi, Phys. Rev. C64, 064905 (2001).
- (53) R. Ugoccioni, Phys. Lett. B491, 253 (2000).
- (54) A. Capella et al, Phys. Repts. 236, 225 (1994).
- (55) N. Armesto Perez et al. , Phys. Lett. B527, 92 (2002); Eur. Phys. J. C22, 149 (2001).
- (56) D.E. Kahana and S.H. Kahana, nucl-th/0208063.
- (57) S. Jeon and J. Kapusta, Phys. Rev. C63, 011901 (2001).
- (58) F. Ceretto, Ph.D. Thesis. University of Heidelberg (1998).
- (59) H. Appelshäuser for the CERES Collaboration, Nucl. Phys. A698, 253 (2002).
- (60) E802 Collaboration, L. Ahle et al. , Phys. Rev. C59, 2173 (1999).
- (61) E802 Collaboration, L. Ahle et al. , Phys. Rev. C58, 3523-3538 (1998).
- (62) C.A. Ogilvie for the E866 and E917 Collaborations, Nucl. Phys. A638, 57c-68c (1998).
- (63) Y. Akiba for the E802 Collaboration, Nucl. Phys. A610, 139 (1996).
- (64) E917 Collaboration, B.B. Back et al. , Phys. Rev. Lett. 86, 1970-1973 (2001).
- (65) E802 Collaboration, L. Ahle et al. , Phys. Rev. C57, R466-R470 (1998).
- (66) E802 Collaboration, L. Ahle et al. , Phys. Lett. B476, 1 (2000).
- (67) E802 Collaboration, L. Ahle et al. , Phys. Lett. B490, 53 (2000).
- (68) FOPI Collaboration, W. Reisdorf et al. , Nucl. Phys. A612, 493 (1997).
- (69) FOPI Collaboration, D. Pelte et al. , Z. Phys. A357, 215 (1997).
- (70) FOPI Collaboration, B. Hong et al. , Phys. Rev. C66, 034901 (2002).