Multiplicity fluctuations
in nuclear collisions at GeV
Abstract
System size dependence of multiplicity fluctuations of charged particles produced in nuclear collisions at GeV was studied in the NA49 CERN experiment. Results indicate a non-monotonic dependence of the scaled variance of the multiplicity distribution with a maximum for semi-peripheral Pb+Pb interactions with number of projectile participants of about 35. This effect is not observed in a string-hadronic model of nuclear collision HIJING.
(NA49 Collaboration)
.
1 Introduction
Nucleus-nucleus collisions at relativistic energies have been intensely studied over the last two decades. The main goal of these efforts is to understand the properties of strongly interacting matter under extreme conditions of high energy and baryon densities when the creation of the quark-gluon plasma (QGP) is expected [1, 2]. In fact, various collision characteristics and their collision energy dependence suggest that a transient state of deconfinement matter may be created at collision energies as low as 30 A GeV [3]. Fluctuations in physical observables in heavy ion collisions have been a topic of interest for some years as they may provide important signals regarding the formation of QGP. With the large number of particles produced in heavy ion collisions at CERN SPS and BNL RHIC energies it has now become feasible to study fluctuations on an event-by-event basis [4]. In a thermodynamical picture of the strongly interacting system formed in the collision, the fluctuations in particle multiplicities [5, 6, 7], mean transverse momenta [8], and other global observables, are related to the fundamental properties of the system, such the specific heat [9, 10], chemical potential, and matter compressibility [11]. These, in turn, may reveal information on the properties of the equation of state near the QCD phase boundary [12, 10, 13].
The main objective of this work is to study how the multiplicity fluctuations change with increasing number of nucleons participating in the collision, i.e. with the system size. In view of this, centrality selected Pb+Pb collisions, central C+C and Si+Si collisions as well as inelastic p+p interactions at GeV registered by NA49 at the CERN SPS were analyzed and the results are presented.
The paper is organized as follows. In Sec. 2 the method of measuring multiplicity fluctuations is introduced and shortly discussed. The NA49 set-up is presented in Sec. 3. Experimental procedures, in particular event and particle selection, detector acceptance and centrality determination are discussed in Sec. 4. The results on the system size dependence of the multiplicity fluctuations are presented in Sec. 5. A final discussion and summary close the paper.
2 Multiplicity fluctuations
2.1 Observables
Let be the multiplicity distribution, then:
| (1) |
is the mean value of the distribution. The variance of the multiplicity distribution is defined as:
| (2) |
Note, that for the Poisonnian distribution the variance equals mean value, .
Mean value and variance of the multiplicity distributions are the only observables used for this analysis.
2.2 Participants and spectators
In description of nuclear collision the concepts of participant and spectator nucleons are very useful. Participant nucleons are nucleons which are removed by the interaction process from the Fermi spheres of the target and projectile nuclei. The remaining nucleons are called spectators. In case of central nucleus-nucleus collisions, where the impact parameter is relatively small, almost all nucleons participate in the collision. In particular, the number of projectile participants, approximately equals the total number of projectile nucleons: . If the collision is peripheral (with large impact parameter ) almost all nucleons are spectators, . In general, the number of projectile spectators is given by: .
2.3 Multiplicity fluctuations in superposition model
Widely used models of nuclear collisions are superposition models which assume that secondary particles are emitted by independent sources. The simplest example is the wounded nucleon model [14], in which the sources are wounded nucleons, i.e. the nucleons that have interacted within a Glauber model approach. In this model the number of participants is equal to the number of wounded nucleons. In superposition models the total multiplicity is then given by:
| (3) |
where denotes number of sources and describes the multiplicity from a single source. The mean total multiplicity in an event may be calculated as:
| (4) |
where is the mean number of sources and is the mean multiplicity from a single source. The variance of the multiplicity distribution is given by:
| (5) |
where and denote the variances of the distribution of multiplicity from a single source and the distribution of the number of sources, respectively.
The scaled variance of the multiplicity distribution is a useful measure of multiplicity fluctuations. From Eqs. 4 and 5 one gets
| (6) |
Thus in superposition models the measured scaled variance of the multiplicity distribution is a sum of two components. The first one describes the multiplicity fluctuations from a single source while the second one accounts for the fluctuations of the number of sources. In most considerations, fluctuations of the geometry of the collision process, which in superposition models are given by the second term in Eq. 5, are uninteresting. The relevant fluctuations are fluctuations determined by the physics of the collision process, in superposition models given by the first component of Eq. 5. Therefore, in this paper we try to remove the influence of the second component by the procedure described in Sec. 4.
3 NA49 experimental set-up
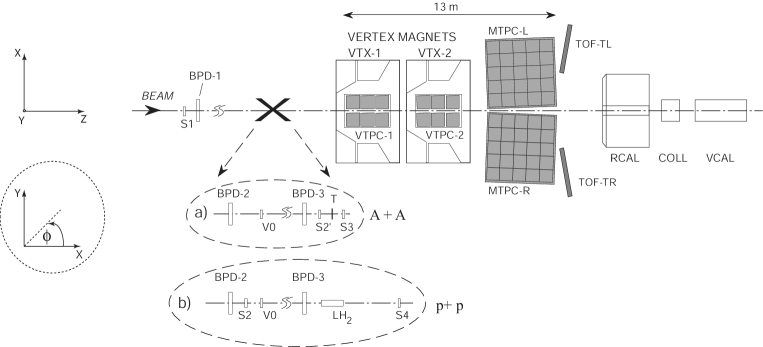
The NA49 experiment is a large acceptance hadron spectrometer at the CERN-SPS used to study the hadronic final states produced in collisions of beam particles (p, Pb from the SPS directly and C, Si from the fragmentation of the primary Pb beam) with a variety of fixed targets. The main tracking devices are four large volume Time Projection Chambers (TPCs) (Fig. 1) which are capable of detecting 80% of some 1500 charged particles created in a central Pb+Pb collision at GeV. Two of them, the Vertex TPCs (VTPC-1 and VTPC-2), are located in the magnetic field of two super-conducting dipole magnets ( and T, respectively) and two others (MTPC-L and MTPC-R) are positioned downstream of the magnets symmetrically to the beam line. The results presented here are analysed with a global tracking scheme [15], which combines track segments that belong to the same physical particle but were detected in different TPCs. The NA49 TPCs allow precise measurements of particle momenta with a resolution of (GeV/c)-1. The set–up is supplemented by two Time of Flight (TOF) detector arrays and a set of calorimeters.
The targets: C (561 mg/cm2), Si (1170 mg/cm2) discs and Pb (224 mg/cm2) foils for ion collisions and a liquid hydrogen cylinder (length 20 cm) for elementary interactions are positioned about 80 cm upstream from VTPC-1.
Pb beam particles are identified by means of their charge as seen by a Helium Gas-Cherenkov counter (S2’) and p beam particles by a 2 mm scintillator (S2). Both of them are situated in front of the target. The study of C+C and Si+Si reactions is possible through the generation of a secondary fragmentation beam which is produced by a primary target (1 cm carbon) in the extracted Pb-beam. With the beam line momentum set to GeV/c a large fraction of all fragments are transported to the NA49 experiment. On-line selection based on a pulse height measurement in a scintillator beam counter (S2) is used to select particles with (Carbon) and (Al, Si, P). Off-line clean-up is achieved by using in addition the energy loss measured by beam position detectors (BPD-1/2/3 in Fig. 1). These detectors consist of pairs of proportional chambers and are placed along the beam line for a precise measurement of the transverse positions of the incoming Pb nuclei.
For p, C and Si beams interactions in the target are selected by anti-coincidence of the incoming beam particle with a small scintillation counter (S4) placed on the beam line between the two vertex magnets. For p+p interactions at GeV this counter selects a (trigger) cross section of 28.5 mb out of 31.6 mb of the total inelastic cross section. For Pb-ion beams, an interaction trigger is provided by anti-coincidence with a Helium Gas-Cherenkov counter (S3) directly behind the target. The S3 counter is used to select minimum bias collisions by requiring a reduction of the Cherenkov signal by a factor of about 6. Since the Cherenkov signal is proportional to , this requirement ensures that the Pb projectile has interacted with a minimal constraint on the type of interaction. This setup limits the triggers on non-target interactions to rare beam-gas collisions, the fraction of which proved to be small after cuts, even in the case of peripheral Pb+Pb collisions.
Centrality of the collisions is selected by using information from a Veto Calorimeter (VCAL), which measures the energy of the projectile spectator nucleons. The geometrical acceptance of the Veto Calorimeter is adjusted in order to cover the projectile spectator region by a proper setting of the collimator (COLL).
Details of the NA49 detector set-up and performance of tracking software are described in [16].

4 Data selection and analysis
4.1 Data sets
The multiplicity fluctuations are studied for negatively, positively and all charged particles selecting events within narrow intervals of energy measured by the Veto Calorimeter (predominantly energy of projectile spectators). Experimental material used for the analysis consists of samples of p+p, C+C, Si+Si and Pb+Pb collisions at GeV. The number of events in each sample is given in Table 1. For Pb+Pb interactions a minimum bias trigger was used allowing a study of centrality dependence.
| \brData Set | No of events | |
| \mrp+p | 319 000 | 0.9 |
| C+C | 51 000 | 0.153 |
| Si+Si | 59 000 | 0.122 |
| Pb+Pb | 65 000 | 0.84 |
| \br |
4.2 NA49 acceptance
The NA49 detector was designed for a large acceptance in the forward hemisphere. However, also in this region the geometrical acceptance is not complete. The acceptance limits were parameterized by a simple function:
| (7) |
where the values of the , and parameters depend on the rapidity interval and are given in [8]. Only particles within the analytical curves are used in this analysis. This well defined acceptance is essential for later comparison of the results with models and other experiments. Only forward rapidity tracks (, rapidity calculated assuming pion mass for all particles) with GeV/c have been used in this analysis.
4.3 Event and particle selection
The aim of the event selection criteria is to reduce a possible contamination of non-target collisions. The primary vertex was reconstructed by fitting the intersection point of the measured particle trajectories. Only events with a proper quality and position of the reconstructed vertex were accepted for future analysis. The vertex coordinate along the beam had to satisfy , where the nominal vertex position and cut parameter values are: -579.5 and 5.5 cm, -579.5 and 1.5 cm, -579.5 and 0.8 cm, -578.9 and 0.4 cm for p+p, C+C, Si+Si and Pb+Pb collisions, respectively. The vertex position in the transverse , coordinates had to agree with the incoming beam position as measured by the BPD detectors.
In order to reduce the contamination of particles from secondary interactions, weak decays and other sources of non-vertex tracks, several track cuts were applied. The accepted particles were required to have measured points in at least one of the Vertex TPCs. A cut on the extrapolated distance of closest approach of the particle at the vertex plane has been applied ( cm and cm) to reduce the contribution of non-vertex particles. Moreover the particle was accepted only when the potential number of points (calculated on the basis of the geometry of the track) in the detector exceeded 30. The ratio of the number of points on a track to the potential number of points had to be higher than 0.5 in order to avoid split tracks (double counting).
4.4 Centrality selection
In order to reduce the effect of fluctuations of the number of participants the multiplicity fluctuations were analysed for narrow centrality bins defined by the energy measured in the Veto Calorimeter.
For the C+C and Si+Si interactions one narrow centrality bin was selected. In case of Pb+Pb collisions, eight narrow centrality bins were chosen. The first () bin corresponds to the most central Pb+Pb events, the last () to the most peripheral reactions. For each bin of centrality the number of projectile participants was estimated by:
| (8) |
where is the energy deposited in the Veto Calorimeter; is the energy carried by single nucleon.
The Table 2 shows the number of projectile participants in each centrality bin.
| \brData Set | (TeV) | ||
| \mrp+p | 1 | - | 319 014 |
| C+C | 8.8 | 0.5 | 1768 |
| Si+Si | 21.7 | 1.0 | 665 |
| Pb+Pb(8) | 18.1 | 30.0 | 265 |
| Pb+Pb(7) | 37.1 | 27.0 | 290 |
| Pb+Pb(6) | 43.4 | 26.0 | 341 |
| Pb+Pb(5) | 49.8 | 25.0 | 299 |
| Pb+Pb(4) | 81.4 | 20.0 | 266 |
| Pb+Pb(3) | 113.1 | 15.0 | 202 |
| Pb+Pb(2) | 144.7 | 10.0 | 153 |
| Pb+Pb(1) | 176.4 | 5.0 | 150 |
| \br |
4.5 Multiplicity distributions
The multiplicity distribution depends on the selected interval (its position - and width - ; see Fig. 2 for definitions) and the kinematic acceptance selected for the analysis.
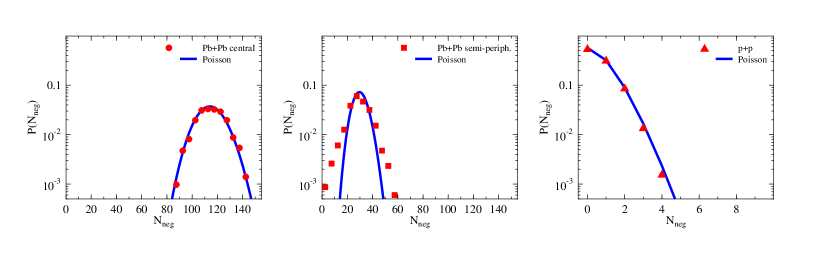
In the centrality intervals and acceptance selected for this analysis, multiplicity distributions show Poissonian behavior for p+p and central Pb+Pb collisions (see Fig. 3). For semi-peripheral collisions the multiplicity distribution is significantly broader than the Poisson one.
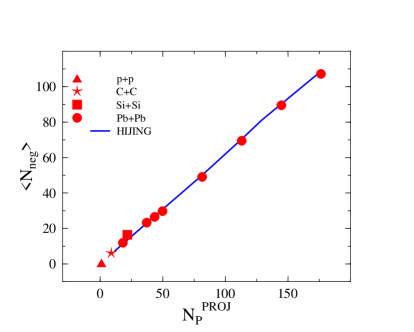
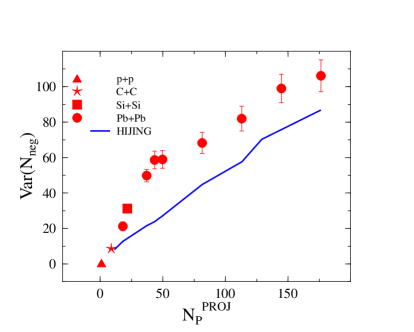
In Figs. 5 and 5 the measured mean value and the variance of the multiplicity distributions as a function of the number of projectile participants are presented. The data are compared with the results from the HIJING model. The simulation was performed with special care taken to properly grantee the Veto Calorimeter response and the NA49 acceptance. The energy of a HIJING event was calculated as the energy of the projectile spectators smeared by a Gaussian distribution with width ( is given in GeV), to take into account detector resolution. One can see from these plots that the mean multiplicity shows approximately linear dependence on the number of projectile participants in data as well as in simulation, whereas the variance of the multiplicity distributions calculated from the data exceeds the variance obtained from HIJING (which is roughly a superposition model).
4.6 Scaled variance of the multiplicity distribution
The scaled variance of the multiplicity distribution depends on the width of the energy interval selected in the Veto Calorimeter. For very broad intervals the measured scaled variance of the multiplicity distribution has a large value because of significant fluctuations in number of projectile participants . Narrowing of the interval results in decreasing fluctuations in the number of projectile participants and consequently the scaled variance decreases, as shown in Fig. 6. For smaller than about TeV the measured scaled variance of the multiplicity distribution is independent of . Note, that even for very small values of the number of projectile spectators fluctuates due to the finite resolution of the Veto Calorimeter.
The scaled variance calculated in the intervals defined in Table 2 was corrected for fluctuations in the number of projectile participants due to the finite width of the interval and the finite resolution of the Veto Calorimeter. Within superposition models the correction can be calculated as:
| (9) |
where is the variance of due to the finite width of the bin, is the variance of due to the finite Veto Calorimeter resolution, is the mean value of in the bin and GeV is the total beam energy.


Finally the corrected scaled variance is calculated as:
| (10) |
where is the measured variance and the measured mean value of the multiplicity distribution in a given bin and represents the corrections for fluctuations in the number of projectile participants and finite Veto Calorimeter resolution. The corrections for the data samples defined in Table 2 are small as shown in Fig. 7. The largest correction is about for the most peripheral Pb+Pb collisions. The corrected values of the scaled variance from Eq. 10 are plotted in Fig. 8.
The systematic error due to Veto Calorimeter resolution, contamination of non-vertex interactions, tracks from weak decays and secondary interactions as well as reconstruction inefficiencies and biases were estimated by varying event and track selection cuts and simulations. The resulting estimates are shown by the horizontal bars in Fig. 8.
5 Preliminary results
The results discussed in this section refer to accepted particles, i.e. particles that are registered by the detector and pass all kinematic cuts and track selection criteria. The data cover a broad range in , ( GeV/c). The rapidity of accepted particles is restricted to the interval which corresponds to forward rapidities in the collision of equal mass nuclei (at GeV energy the center of mass rapidity equals for fixed target geometry), where the azimuthal acceptance is large. The acceptance in azimuthal angle is given by Eq. 7.
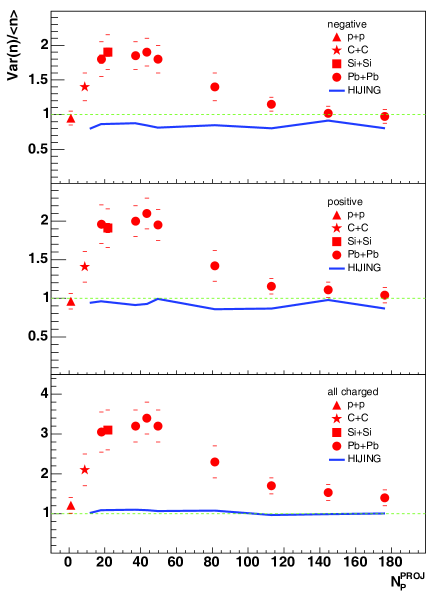
The corrected scaled variance of the multiplicity distribution for negatively, positively and all charged accepted particles as a function of centrality in comparison with HIJING simulation is shown in Fig. 8 (the results were also shown at the Quark Matter 2004 conference [3]). HIJING produces approximately Poissonian multiplicity distributions, independent of centrality. In contrast, the data points indicate a non-monotonic dependence on system size with a maximum at number of projectile participants . Note, that the value of unity for p+p interactions is an accident at GeV. The multiplicity distribution in p+p collisions is not Poissonian at lower and higher energies; see for example [17].
Within a statistical model in which strict electric charge conservation is obeyed [18] the scaled variance of like-sign particles is expected to vary in the range 0.5-1 depending on the volume of the matter and the acceptance in momentum space. The results presented here are in disagreement with this prediction.
The scaled variances for positively and negatively charged particles are similar. The corresponding values for all charged particles are larger. This is probably due to charge conservation. Assuming that negatively and positively charged particles in the experimental acceptance are correlated with a correlation factor , one gets:
| (11) |
where , and are multiplicities of negatively, positively and all charged particles, respectively, and, for simplicity we assumed .
The scaled variance for charged particles is times larger than for like-sign particles (see also [18]).
Note that transverse momentum fluctuations measured in nuclear collisions at GeV [8] also show a non-monotonic system size dependence with the maximum located close to the maximum of the scaled variance of multiplicity distribution. A possible relation between these two observation was discussed in [19].
6 Summary
The scaled variance of the multiplicity distribution was used as a measure of multiplicity fluctuations. A non-monotonic system size dependence of the scaled variance is seen for negatively, positively and all charged particles. The scaled variance is closest to unity for p+p and central Pb+Pb collisions and has a maximum at . The behavior of the scaled variance is similar for positively and negatively charged particles, but it is larger for all charged particles.
Acknowledgements
This work was supported by the US Department of Energy Grant DE-FG03-97ER41020/A000, the Bundesministerium fur Bildung und Forschung, Germany, the Polish State Committee for Scientific Research (2 P03B 130 23, SPB/CERN/P-03/Dz 446/2002-2004, 2 P03B 04123), the Hungarian Scientific Research Foundation (T032648, T032293, T043514), the Hungarian National Science Foundation, OTKA, (F034707), the Polish-German Foundation, and the Korea Research Foundation Grant (KRF-2003-070-C00015).
References
References
- [1] Colllins J C and Perry M J 1975 Phys. Rev. Lett. 34 1353
- [2] Shuryak E V 1980 Phys. Rept. 61 71
- [3] Gaździcki M et al. (NA49 Collaboration), 2004 J. Phys. G 30 S701
- [4] Heiselberg H, 2001 Phys. Rept. 351 161
- [5] Aggarwal M M et al. (WA98 Collaboration), 2002 Phys. Rev C 65 054912
- [6] Afanasev S V et al. (NA49 Collaboration), 2001 Phys. Rev. Lett. 86 1965
- [7] Roland C et al. (NA49 Collaboration), 2004 J. Phys. G 30 S1381
- [8] Anticic T et al. (NA49 Collaboration), Preprint hep-ex/0311009
- [9] Stodolsky L, 1995 Phys. Rev. Lett. 75 1044
- [10] Stephanov M A, Rajagopal K and Shuryak E V, 1999 Phys. Rev. D 60 114028
- [11] Mrówczyński S, 1998 Phys. Lett. B 430 9
- [12] Stephanov M A, Rajagopal K and Shuryak E V, 1998 Phys. Rev. Lett. 81 4816
- [13] Gazdzicki M, Gorenstein M I and Mrowczynski S, 2004 Phys. Lett. B 585 115
- [14] Białas A, Bleszyński M and Czyż W, 1976 Nucl. Phys. B 111 461
- [15] Barnby L S et al. (NA49 Collaboration), 1999 J.Phys. G 25 469
- [16] Afanasiev S et al. (NA49 Collaboration) 1999, Nucl. Instrum. Meth. A 430 210
- [17] Gaździcki M, Szwed R, Wrochna G and Wróblewski A K, 1991, Mod. Phys. Lett. A 6 981
- [18] Begun V et al., Preprint nucl-th/0404056
- [19] Mrówczyński S, Rybczyński M and Włodarczyk Z, Preprint nucl-th/0407012