Mesonic and nonmesonic weak decay widths of medium-heavy hypernuclei
Abstract
We have measured the energy spectra of pions and protons emitted in the weak decay of C, Si, and ΛFe hypernuclei produced via the reaction. The decay widths of the mesonic decay and the nonmesonic decay were extracted. The present results demonstrate an increase of the mesonic decay width due to a distortion of the pion wave function in nuclear medium for the first time. The ratios of the neutron- to proton-induced nonmesonic decay widths, , were evaluated by a direct comparison of the measured proton energy spectra with the calculated ones. No theoretical calculation which has been proposed so far can simultaneously account for both the nonmesonic decay widths and the ratios in the present data.
pacs:
21.80.+a, 13.30.Eg, 13.75.Ev, 21.10.TgI Introduction
The hypernuclei have been extensively studied since their first discovery in a nuclear emulsion Dan53 . A hyperon, which carries a degree of freedom, ‘strangeness’, can be used as a unique probe to investigate the interior of the nucleus since it does not suffer from Pauli’s exclusion principle.
A hypernucleus is usually produced in an excited state of -particle neutron-hole configuration. When a hypernucleus is excited above the particle emission threshold, it decays dominantly by the strong interaction, and then deexcites to its ground state via electromagnetic transitions. From the ground state, it eventually decays through the weak interaction.
The total decay width (= 1/) of a hypernucleus is composed of the mesonic decay width () and the nonmesonic decay width (). In the mesonic decay, a hyperon decays into a nucleon and a pion in nuclear medium, similarly as in free space. The mesonic decay width () can be further expressed as a sum of the decay widths for emitting negative (: ) and neutral (: ) pions, respectively. In two-body nonmesonic decay, however, a hyperon in a nucleus interacts with a neighboring nucleon and decays into a pair of nucleons without emitting a pion. The nonmesonic decay width () is comprised of the proton-induced (: ) and neutron-induced (: ) decay widths. In addition, importance of the two nucleon-induced decay width (: ) has also been discussed theoretically Eric92 , although it has not been experimentally established yet.
Therefore, the lifetime (), the total () and partial decay widths of hypernuclei are connected by the following relationship,
| (1) | |||||
| (2) | |||||
| (3) |
The mesonic decay releases energy of MeV, corresponding to a momentum of about 100 MeV/c in the center-of-mass system (c.m.) for the emitted nucleon and pion. Since this is much smaller than the nuclear Fermi momentum ( MeV/c) in typical nuclei, except for light ones, the mesonic decay is strongly suppressed in heavier hypernuclei due to Pauli’s exclusion principle acting on the nucleon in the final state.
Although there are several experimental data of and/or on light hypernuclei, such as H Outa95 , He Outa98 , He Szym91 , B, and C Szym91 Saka91 Noumi95 , no finite value has been reported for the mesonic decay widths of hypernuclei heavier than C. It has been pointed out that the mesonic decay widths are sensitive to the nuclear structure in the final state and the choice of the pion-nucleus optical potentials Motoba88_NPA Motoba94 Nieves93 . While the pion-nucleus potentials have been studied so far through -nucleus scattering experiments and measurements of X-rays from the pionic atoms, the study of mesonic weak decay offers a unique opportunity to investigate pion wave functions deep inside a nucleus, where hypernuclear weak decay occurs. Therefore, precise and systematic measurements of the mesonic decay widths are long awaited.
Nonmesonic weak decay provides a unique opportunity to study both the parity-conserving and parity-violating terms in the baryon-baryon weak interaction, which are difficult to experimentally investigate by other means, since the weak component of nucleon-nucleon scattering is usually masked by the strong interaction.
In nonmesonic decay of a hypernucleus, the released energy is MeV, and the c.m. momentum of two nucleons in the final state is about 400 MeV/c. Since the momentum transfer is larger than the Fermi momentum, the nonmesonic decay does not suffer from Pauli blocking so seriously. Therefore, it dominates over the mesonic decay, except in very light hypernuclei.
Currently, there is no clear picture concerning the nonmesonic decay, although various experimental and theoretical efforts have been attempted for a long time. Nonmesonic decay width (), the neutron- and proton-induced partial decay widths ( and ), and their ratio () are thought to be good experimental observables.
The lifetimes and partial decay widths of several spin-isospin saturated hypernuclei were measured at Brookhaven National Laboratory (BNL) and High Energy Accelerator Research Organization (KEK) (He Szym91 , B, and C Szym91 Noumi95 ). It was reported that the ratios were close to unity or larger, although the quoted errors were large. Contrary to the experimental data, theoretical calculations based on the framework of meson exchange models assuming the rule yield ratios much smaller than unity (typically 0.1-0.3) Dubach86 Bando90 Parreno_PRC97 . The smallness of the ratios essentially comes from the tensor dominance of one pion-exchange, which contributes only to the proton-induced nonmesonic decay. The inclusion of the exchange processes was discussed in an attempt to cancel out the strong tensor dominance of one pion-exchange potential Ito98 . Another approach based on the direct quark current exchange has also been suggested to take the short-range nature of the nonmesonic decay and the violation of the rule into account Oka . All of these efforts still resulted in small ratios. Good experimental data are seriously required in order to reveal the mechanism of the nonmesonic decay.
We carried out an experiment to measure the precise lifetimes and partial decay branching ratios of C, Si and ΛFe hypernuclei produced via the reaction (KEK-PS E307). Since the contribution of mesonic decay to the total decay width becomes smaller, measurements of the nonmesonic decay widths becomes less ambiguous in heavier hypernuclei. The results of lifetime measurements in the present experiment have already been published elsewhere Bhang98 Park99 . The present paper reports results for the mesonic decay widths (), the total nonmesonic decay widths (), and the ratios of C, Si, and ΛFe hypernuclei, a part of which has already been published in ref. E307pdw_letter .
II Experiment
The hypernuclei produced by the reaction were identified in the hypernuclear mass spectrum reconstructed using the momenta of the incident pions and the outgoing kaons. The charged particles emitted in the weak decay were detected by the decay counter systems located above and below the experimental target in coincidence with kaons. The branching ratios of the mesonic decay were obtained as ratios between the numbers of identified hypernuclei and pions emitted after the mesonic decay. The mesonic decay width () and the nonmesonic decay width () were then derived by combining the results of the present lifetime measurement and the previous data of the mesonic decay branching ratios. The ratios were evaluated by a direct comparison of the observed proton energy spectra with calculated ones as described in the next section.
The reaction has several advantages in the measurement of the weak decay of heavy hypernuclei. On the other hand, the reaction, whose momentum transfer is very small, dominantly excited substitutional states and poorly populates the bound region of a hypernucleus Povh80 . On the contrary, the reaction, whose momentum transfer is about 400 MeV/c, is suitable to excite deeply bounded states of a hyperon. Another advantage of the reaction over the reaction is that the pion beams are relatively clean compared with kaon beams which is subject to a large contamination of pions originated in the in-flight decay. It is crucial for a precise measurement of the branching ratios for heavier hypernuclei such as Si to obtain inclusive spectra in which each peak is clearly separated with high statistics and less background contamination.
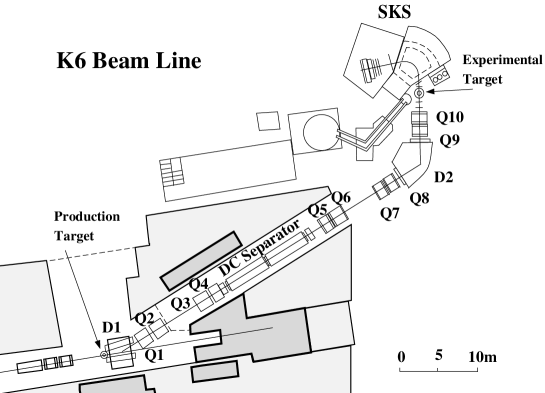
The present experiment was carried out at the K6 beam line Tanaka_K6 of the KEK 12-GeV Proton Synchrotron (PS), which is depicted in Fig. 1. Primary proton beams were extracted for 1.4-1.8 sec in each 4.0 sec period. The central momentum of pion beams was set to 1.06 GeV/c, where the production cross section of the elementary reaction becomes maximum Dover80 . The typical beam intensity at the target was adjusted to per 1.8 sec for primary protons in order to maintain the stability of the total detection efficiency of the tracking chambers on the beam line. The accumulated numbers of incident pions used in the present analysis are listed in Table 1.
Plates of graphite (natC), natural silicon (natSi) and iron (natFe) were used as the experimental targets. These targets were tilted up by degrees from the beam direction in order to maximize the thickness in the beam direction ( ) and minimize the threshold energy of the charged decay particles. Detailed specifications of the experimental targets can be found in ref. Park99 .
The momenta of the scattered particles were analyzed by the Superconducting Kaon Spectrometer (SKS). SKS has specifications particularly suitable for coincidence experiments of hypernuclei, such as a large solid angle (100 msr) and short flight length ( m), as well as a good momentum resolution (FWHM 0.1% at 720 MeV/c) SKSNIM . Kaon events were selected in the mass spectrum of scattered particles, which were reconstructed by their time-of-flight and momentum. The mass of hypernuclei was calculated for selected events through the momentum vectors of incident pions and scattered kaons with corrections of the energy loss in the beam counters and the experimental target. The correction of the horizontal scattering angle measured by SKS was applied to the momenta of outgoing kaons. In addition, the constant offsets were applied to the present hypernuclear mass spectra so as to adjust the measured ground states to the ones measured by the previous studies Davis92 Hase96 Akei91 . The constant offsets applied for the spectra with the 12C, 28Si, and Fereactions were 0.62 MeV, 3.51 MeV, and 2.0 MeV, respectively.
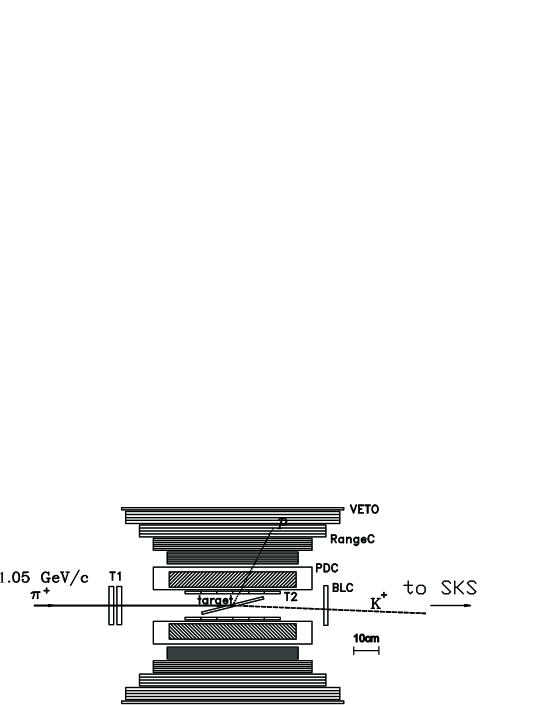
Charged particles emitted in the weak decay of hypernuclei were detected by the decay counter systems located above and below the experimental target, as shown in Fig. 2. Each system was comprised of timing scintillation counters (T1 and T2), multi-wire drift chambers (PDCU and D), and range counters (RangeU and D). The plastic scintillation counters (T1 and T2) were designed to realize good time resolution ( psec) even under the high-rate of particle/sec YDKim . The T1 counters installed on the beam line gave the time of hypernuclear production, and the T2 counters located above and below the target measured time information and deposited energy of the decay particles. A detailed description of the fast timing measurement in the present experiment can be found in ref. Park99 .
The PDC is a multi-wire drift chamber having two plane-pairs parallel and one plane-pair perpendicular to the beam direction. The distance between the sensitive wires in each plane was 8 mm, and the elements of each plane-pair were displaced relative to the other by a half of the wire spacing to solve the left/right ambiguity. A typical spatial resolution of PDC was m. Tracks of the decay particles were reconstructed by fitting the hit positions on PDC and the reaction vertex on the target plane.
The range counter is comprised of twenty plastic scintillators, of which 12 slabs had 4 mm thickness and 8 slabs 6 mm thickness, respectively. The region of kinetic energy measured by the range counter system was from 30 MeV to 150 MeV for protons, and from 12 MeV to 70 MeV for pions, respectively. The total kinetic energy deposited in the range counters () was also evaluated by summing up all ADC data after adjusting pulse height gain of each segment.
Pions and protons were identified with the functions (PID1 and PID2) made from the measured , range, and . These functions were defined as follows:
| (4) | |||||
| (5) |
Here, the mean energy loss () of each decay particle was calculated by the energy deposit with a correction of the flight length in the T2 counters. The symbol denotes the second-order polynomial function, which was used to correct the correlations and make the one-dimensional plot of particle identification functions (PID functions). Protons and pions which passed the criteria of both PID1 and PID2 functions were used in the analysis. Fig. 3 shows the PID functions obtained in the C ground state region with Gaussian-shape fitting curves. The accepted efficiency of the PID window for pions and protons is %, and it was included in the estimation of detection efficiency. The proton events in the pion window were evaluated to be less than 1% of pion events, after applying both PID1 and PID2 gates.
The overall solid angle of the two decay counter systems was estimated to be % for C and ΛFe, and % for Si by a Monte-Carlo simulation based on GEANT GEANT . The error of the solid angle comes from the angle resolution of the drift chambers. The total detection efficiency () of each decay counter system, including the ambiguity of the particle identification, was estimated to be () % for the carbon and iron targets, and () % for the silicon target. These efficiencies were obtained by analyzing the calibration data of the and reactions, which were taken simultaneously with the trigger data.
The stability of the detection efficiency during the experiment was studied by monitoring the detection efficiency in each data-taking run, which usually took about 2 hour. The errors in the detection efficiency are dominantly due to statistics of the calibration data. These errors in the evaluation of the solid angle and the detection efficiency are included in the systematic errors of the branching ratios.
III Analysis and Results
III.1 Hypernuclear mass spectra
Fig. 4, 5, and 6 illustrate the measured hypernuclear mass spectra. The horizontal axis is the mass difference between a produced hypernucleus and a target nucleus (). A scale in the binding energy of the hyperon (BΛ) is also given in the same figure. The top spectrum (a) in each figure is the inclusive spectrum of the reaction. The middle and bottom spectra, (b) and (c), are the coincidence spectra with protons ( MeV) and charged pions ( MeV), respectively.
In Fig. 4-(a) and 5-(a), the two dominant peaks, denoted as sΛ and pΛ at B and MeV for C, and B and 7.1 MeV for Si, were interpreted as the neutron-hole -particle configurations of and for C, and those of and for Si, respectively. The quasi-free production process rises from its threshold (B MeV). Compared to the previous hypernuclear weak decay experiments carried out at BNL Szym91 and KEK Noumi95 , the background level in Fig. 4-(a) is greatly improved, and each peak can be clearly identified.
The peak assignments and interpretations of C and Si hypernuclei are taken from the previous spectroscopic study of light-to-heavy hypernuclei with SKS Hase96 and theoretical investigations Motoba88_PRC . Since the hypernuclear spectra of C with a resolution of 2 MeV in (FWHM) revealed that the sub-peaks between the predominant ones have about 10% strength to the dominant ones, these sub-peaks were taken into account in the present peak fitting.
The fitting functions applied for the inclusive and coincidence spectra on 12C and 28Si reactions are as follows,
| (6) | |||||
| (7) | |||||
| (8) | |||||
| (11) |
where the peak position (), relative intensity to the ground state (), and peak width () of each Gaussian-like function were taken from the previous experimental results Hase96 . The parameter was adjusted at first by fitting the ground state for C and Si in the proton coincidence spectra, representing the effect on the energy resolution since the present targets are much thicker than those in the previous singles experiment. The function for the quasi-free continuum () was assumed to be a sum of the squared-root type function and third-order polynomial function convoluted with the width of the ground state () as shown in Eq. 11. A constant background was also assumed. The measured energy resolutions of the ground state in the 12C and 28Si spectra were 4.8 MeV and 6.3 MeV in FWHM, respectively. In the fitting of the 12C and 28Si inclusive spectra, the free parameters were the yield of the prominent peak () and the shape of quasi-free continuum (a-d).
In Fig. 4-(b) and 4-(c), the peak positions of two sub-peaks (#2 and #3) are lower than the energy threshold of proton emission and these states supposedly decay to the ground state by emitting gamma rays. Since the lifetimes of these states are supposed to be on the order of 1 psec, which is much shorter than those of the typical hypernuclear weak decay ( psec), the sub-peak events can be regarded as the ones by the weak decay from the C ground state. On the other hand, it is known from the old emulsion experiments that the pΛ state of C emits a proton and sequentially produces B hypernucleus, which then deexcites to the ground state and eventually decay by the weak interaction Bohm Julic72 . Therefore, events in the pΛ state can be thought as those by the weak decay of B.
It is confirmed by the previous experimental study Ajimura_PRL92 Kishimoto_PRC95 that quasi-free hyperons can make hypernuclei in the target. Those hypernuclei eventually emit protons by the nonmesonic decay. Therefore, the tagged protons in the quasi-free region can be regarded as the ones associated with the nonmesonic decay of hypernuclei, not as misidentified pions.
In the fitting of Fig. 4-(b) and 4-(c), the yield of pΛ () was also treated as free parameters. For the peak #2 and #3, their relative intensity and position to the peak #1 in the inclusive spectrum were kept constant. The free parameters were the yields of the peak #1 and #4, and the shape of quasi-free continuum. In Fig. 5-(b) and 5-(c), the pΛ states (#3 and #4) located above the proton emission threshold can be regarded as those of the weak decay of Al after emitting a proton. Therefore, the yields of the dominant peak (#1, #3, and #5) were treated as free parameters, while the relative peak intensity of each sub-peak (#2 and #4) to the dominant one (#1 and #3) was fixed to be constant.
In the Fe spectrum, events gated in the region of a hyperon bound to the 55Fe nucleus were used in the analysis since each hypernuclear state could not be separated. Considering the proton emission threshold of the excited states of Fe, a series of hypernuclei (Fe, Mn, and Fe) can be included in the gated region. The symbol ΛFe represents those hypernuclei whose mass numbers are close to A56.
The yields and statistical errors of C, B, Si, and Al are summarized in Table 1. The systematic errors due to the choice of functional shapes for the quasi-free region were examined with square-root and polynomial functions. changing the fitting region. No significant difference was found on the results of the sΛ state of C and Si. However, significant systematic changes of about 20% for C and 50% for Siwere found in the results on the pΛ states. Such variations were included in the systematic errors of the branching ratios of B and Al.
For ΛFe hypernuclei, the number of events in the gated window was used to estimate the yields. The expected number of true pion events in the bound region of a particle was evaluated to be less than 12.4 at the 90% confidence level (CL) by fitting the quasi-free region in Fig. 6-(c). Only an upper limit of the mesonic decay branching ratio was obtained for ΛFe.
III.2 Branching ratios of the mesonic and nonmesonic decay
The branching ratios of the mesonic decay and the nonmesonic decay can be expressed by the experimental observables as follows,
| (12) | |||||
| (13) | |||||
| (14) | |||||
| (15) |
where the symbols of and represent the yields of each hypernucleus and associated decay pions, as described in the previous section. The symbol denotes a product of the detection efficiency and the solid angle of the decay counter system, which was discussed in Sec II. Table 2 shows the results of the mesonic decay branching ratios () of C and Si hypernuclei. An upper limit of the branching ratio of the mesonic decay on ΛFe was evaluated at the 90% CL.
Fig. 7 shows the energy distribution of pions emitted by C. Pion energy threshold was set at 12.5 MeV. It was found that more than 99 % pion events in the energy spectrum were accepted based on a simulation taking into account energy level distributions of the daughter nucleus, 12N, calculated in ref. Motoba88_NPA ,
Branching ratios of the nonmesonic weak decay were derived incorporating those of charged and neutral mesonic weak decay. As for C and B, the mesonic decay branching ratios () were taken from the previous experimental data Saka91 . The errors of the branching ratios were treated as the systematic ones in the present result. As for Si and Al, the ratios of the to decay width () were assumed to be 2.30 for Si and 0.65 for Al, respectively, according to the theoretical calculations Motoba94 . The calculated ratios of were adopted to the present results. The errors of the adopted branching ratios for Si and Al were assumed to be 100%. The mesonic decay branching ratio of ΛFe was also taken from the theoretical calculation to be 0.015 Motoba94 . The uncertainty of was assumed to be 100%.
III.3 Proton energy spectra and ratios
Fig. 8 shows the proton energy spectra measured in the present experiment. The number of protons measured by the decay counters is plotted as a function of the proton energy measured by the range counter (). It is emphasized that denotes the kinetic energy of the decay protons at the range counter, but not the one at the weak decay vertex since the decay protons generated at the reaction vertex undergo energy loss and struggling processes in the experimental target and the T2 counter. The proton energy spectrum is normalized by the number of hypernuclear weak decays as follows,
| (16) |
where represents the number of events in the inclusive hypernuclear-mass spectrum, and is the one in the corresponding proton-coincidence spectrum. The error bars plotted in the spectra are statistical ones only. The events above 40 MeV are analyzed in order to avoid the uncertainty of the detection limit near 30 MeV.
In accord with ref. Ramos97 , the initial proton energy spectra at the vertex of the nonmesonic weak decay were calculated with the pion-exchange potential and local density approximation in finite nuclei, assuming various ratios on C, Si, and ΛFe hypernuclei. After the nonmesonic decay, the outgoing nucleons propagate through the nucleus colliding with other nucleons, so called the intra-nuclear cascade process (INC). Authors of ref. Ramos97 Ramos_pri calculated the proton energy spectra emitted from nuclei with help of the INC code Carrasco .
In ref. Ramos97 Ramos_pri , the proton energy spectra generated by the proton- and neutron-induced nonmesonic decay were summed incoherently for a given ratio. Explicitly, the number of protons emitted in a nonmesonic weak decay can be expressed as a function of proton energy () and ratio as follows,
| (17) |
where , , and are the fractions of neutron- and proton-induced nonmesonic decay (), and the two-nucleon induced decay (), respectively. and are the numbers of protons originated in the neutron- and proton-induced process, so called “1N process”, and is that originated in the two-nucleon induced decay, so called “2N process”, respectively. The number of protons in the above equation is normalized to be the one per nonmesonic weak decay of a hypernucleus.
The proton energy spectra measured by the decay counters were calculated by the GEANT simulation code described in the previous section. In the Monte-Carlo simulation, energetic protons emitted from the target nucleus with the energy distributions of protons () were transported through the target material and the decay counters. The geometrical acceptance, the energy loss, and its straggling in the target and decay counters together with the energy threshold of 40 MeV were automatically taken into account. The notation of is introduced to represent the proton energy spectra obtained by the GEANT simulation code.
The simulated proton energy spectrum () to be compared with the experimental data () was obtained as follows,
| (18) |
where , , and represent the detection efficiency, the solid-angle acceptance of the decay counters, and the branching ratio of the nonmesonic decay described in the previous section, respectively.
The ratios of C, Si, and ΛFe were obtained by fitting the experimental data with the simulated spectra, changing the ratio as a free parameter. The results in both cases of the “1N only” and “1N and 2N” processes are listed in Table 3. The simulated proton energy spectra in the case of = 0.1, 1.0, and 2.0 are overlaid on the experimental data in Fig. 8. It is shown that the proton yield is much smaller than the calculated one assuming = 0.1, which seems to exclude very small values of .
Recently, an erratum of ref. Ramos97 was published, giving the new proton energy spectra Ramos97_erratum . Since much stronger final state interaction in the INC process was applied in the updated spectra than that in the original paper, the shape of the spectra was greatly shifted toward the lower energy side. The present results of the ratios listed in Table 3 are updated from the ones published in our previous report E307pdw_letter by applying the new proton energy spectra given by the authors of ref. Ramos97_erratum to the experimental data. It should be noted that the experimental proton energy spectra published in ref. E307pdw_letter themselves do not change at all in the present report. Since the experimental data of proton energy spectra noted in Eq. (16) contains only experimental observables, they are free from theoretical assumptions. As a result, the ratios of C and Si became smaller than our previous ones published in ref. E307pdw_letter .
The statistical error of each ratio for C, Si, and ΛFe was evaluated by the conventional least-square method. In addition, the systematic error was evaluated, considering the uncertainty of the nonmesonic decay branching ratio, the detection efficiency of the decay counters, and the solid angle acceptance. The systematic errors of the ratio in the equation (18) were found to be 0.09, 0.10, and 0.05 for C, Si, and ΛFe, respectively. For ΛFe, the dependence of the gate position for the bound state on the ratio was also examined. The differences of the obtained ratios for 160 MeV 180 MeV and 160 MeV 190 MeV were found to be 13 % for the 1N process and 15 % for the 1N+2N process. These errors were included in the systematic errors for ΛFe.
Assuming that the decay widths of the 1N and 2N process are 0.803 and 0.277 on C Ramos97 Ramos_pri , the ratio on C is . Recently, Alberico et al. evaluated the decay width of the 2N process to be 0.16 on C, based on the propagator method Alberico_PRC00 Alberico_HYP2000 . When we take this value, the ratio of C changes from 0.60 to 0.70. Since most of protons emitted by the 2N process are not detected by our decay counter systems, the inclusion of the 2N process in the fitting gives smaller ratios than those in the case of 1N process only. The systematic error of the present data listed in Table 3 was evaluated only by the experimental conditions described above. The uncertainties of the derived ratios due to theoretical assumptions and models, such as degree of the 2N process contribution and the ambiguity coming from the intranuclear cascade calculations, are not included in the systematic errors quoted in the present results.
IV Discussion
IV.1 Mesonic decay widths
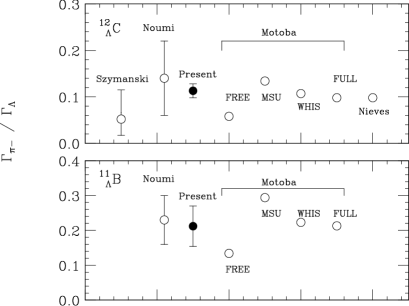
Table 4 and Fig. 9 summarize the present results for the mesonic decay widths together with those obtained by Szymanski et al. Szym91 and Noumi et al. Noumi95 . The results of were derived from the obtained branching ratios using the total decay widths measured simultaneously in the present experiment Bhang98 Park99 by the relation, . The present decay widths of C and B hypernuclei are much more precise than the previous experimental data, and allow us a critical comparison with theoretical calculations. Furthermore, finite values of for Si and Al were measured for the first time. For ΛFe, an upper limit of the mesonic decay width was obtained.
In ref. Motoba88_NPA , Motoba et al. calculated the mesonic decay widths of C and B with the pion-nucleus optical potentials given by a group of Michigan State University (MSU) MSU and Whisnant WHIS , which have a strong and weak imaginary part, respectively. Another potential was introduced to resolve the singularity in the pion wave function (FULL) Motoba94 . The calculated results are compared to the calculations with the plane wave including the Coulomb distortion (FREE). In addition, Nieves et al. has developed an optical potential, which was derived from a purely theoretical calculation, and can reproduce the experimental data of pionic atoms and -nucleus scattering data Nieves93 . They applied their optical potential to the mesonic decay of hypernuclei incorporating the nuclear shell model wave functions. A similar comparison of the experimental results for the mesonic decay of Si and Al with the theoretical results is also shown in Table 4 only for the case of “FULL”.
It can be said that theoretical calculations taking into account of the distortion effects of the pion wave function and nuclear wave functions agree well with the present experimental results. In particular, the result on C, whose experimental error has been drastically improved, is consistent with an increase of due to the distortion of the pion wave function by the pion-nucleus optical potentials.
IV.2 Nonmesonic decay widths and ratios
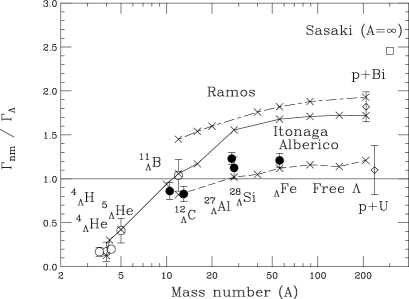
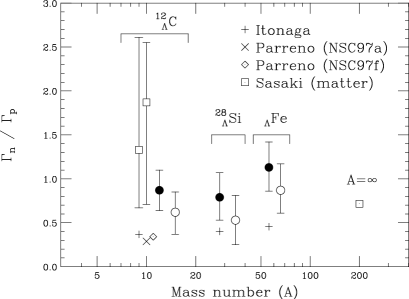
Table 3 summarizes experimental results of nonmesonic decay width and ratios along with theoretical ones. Fig. 10 shows the mass-number dependence of the nonmesonic weak decay widths derived by the present and previous experiments. There are experimental data of lifetime measurement for very heavy hypernuclei in the mass region of with recoil shadow method on p+Bi and p+U reactions at COSY, although the strangeness production was not explicitly identified COSY_PRC97 COSY_NPA98 . The plotted data around in Fig. 10 were the ones converted from the results of lifetime measurements, assuming that no mesonic decay occurs in heavy hypernuclei. Theoretical calculations of the nonmesonic decay widths by Itonaga et al. Itonaga_PRC02 , Ramos et al. Ramos94 , Alberico et al. Alberico_PRC00 , and Sasaki et al. Oka_NPA00 are also illustrated in the figure.
The calculation by Ramos et al. Ramos94 , on which present derivation of ratios rely, was based on one-pion exchange potential in which the vertex renormalization effect in the nuclear medium and the local density approximation are taken into account. Their results of the nonmesonic decay widths are much larger than the experimental results, and do not seem to saturate around A=56. Recently, Alberico et al. Alberico_PRC00 updated Ramos’s calculation, and obtained results closer to the present data by adjusting the Landau-Migdal parameter, which controls the short-range part of the pion potential.
The present data substantially improved the knowledge of the ratios for C and B as shown in Fig. 11. Although all available experimental data agree with the present ones within 1 sigma level, the present ’s are in the region around 0.5-1.0, while the previous ones were significantly larger than unity.
The direct quark current exchange model (DQ) was applied to explain the very short-range part of the nonmesonic decay in light hypernuclei and nuclear matter Oka Oka_NPA00 , incorporating it with the contribution of and meson exchanges. Parreno et al. carried out a systematic study about various combinations of meson exchange potentials, such as , and mesons Parreno_PRC01 , which contains an update of the results published in ref. Parreno_PRC97 . Itonaga et al. introduced additional potentials, V2π/ρ and V2π/σ, in which terms of correlated and exchanges are taken into account Itonaga_PRC02 since it has a strong tensor force but still has opposite sign to that of the one-pion exchange potential. It was also pointed out that two-nucleon induced nonmesonic decay () could play an important role in the nonmesonic weak decay Alberico_PRC00 . However, no experiment has so far explicitly measured the contribution of the two nucleon process.
The present results of the nonmesonic decay widths and the ratios provide good criteria to test the short-range nature of the nonmesonic decay, which is essentially important to understand its mechanism. However, as shown in Fig. 10 and 11, there is no theoretical calculation which explains both the nonmesonic decay width and the ratio consistently. For instance, the quark-current exchange model gives the ratio in nuclear matter comparable to the present experimental data, but overestimates the nonmesonic decay width. The conventional meson exchange models, in which the contribution of heavy mesons are included, provide larger ratios than those by the one-pion exchange model, though the results of meson exchange models are still smaller than the experimental data.
From an experimental point of view, more exclusive information, such as the angular correlation of outgoing nucleons and the detection of low-energy neutrons, would also help to solve the puzzle of the ratio. Recently, an experiment to measure the neutron spectra of the nonmesonic weak decay of C and Y was carried out at KEK E369exp E369_Hotchi . The observed number of neutrons in C E369_JHKim was reported to be smaller than that expected from ref. Ramos97 Ramos97_erratum . In addition, coincidence measurements of the decay particles including neutrons from the s- and p-shell hypernuclei, He and C, were carried out at KEK E462exp E462_Bhang , and the data analysis is under way. A study of the correlation of pair nucleons emitted in the nonmesonic weak decay with much greater statistics would help to completely understand the nucleon spectra and to reduce any ambiguity in the final state interaction.
V Conclusion
In the present study, we measured the pion and proton energy spectra, and extracted the mesonic decay widths (), the total nonmesonic decay widths (), and the ratios on medium-to-heavy hypernuclei with high precision. The results of on C confirmed an increase of the mesonic decay width, which is interpreted as due to the distorted pion wave function and the nuclear shell-model configurations. The total nonmesonic decay widths () in medium-to-heavy hypernuclei almost saturates at . This suggests that the short-range nature and the local density approximation take central roles in the mechanism of the nonmesonic decay. The present ratios are now comparable with the recent calculations based on the meson exchange potentials taking into account of heavy mesons such as Kaon, , and , and/or the quark-current. Although the experimental uncertainty in deriving the ratios become less than ever, the experimental ratios are still larger than the theoretical calculations. At this moment, there is no theoretical calculation that can reproduce both the nonmesonic decay widths and the ratios. Further experimental and theoretical efforts are needed to fully reveal the mechanism of the nonmesonic weak decay.
Acknowledgements.
The authors thank Professor K. Nakai and Professor T. Yamazaki for their continuous encouragement throughout the experiment from the beginning. We deeply appreciate the staff members of KEK and INS for their generous support to carry out the experiment and data analysis. Discussions with Professor K. Itonaga, Professor T. Motoba, Professor T. Fukuda, and Professor T. Nagae are greatly appreciated. One of the authors (H.B.) acknowledges partial support from the Korea-Japan collaborative research program of KOSEF (R01-2000-000-00019-0) and the Korea Research Foundation (2000-015-Dp0084).References
- (1) M. Danysz et al., Phil. Mag. 44, 348 (1953).
- (2) M. Ericson, Nucl. Phys. A547, 127c (1992).
- (3) H. Outa et al., Nucl. Phys. A585, 109c (1995).
- (4) H. Outa et al., Nucl. Phys. A639, 251c (1998).
- (5) J. J. Szymanski et al., Phys. Rev. C43, 849 (1991).
- (6) A. Sakaguchi et al., Phys. Rev. C43, 73 (1991).
- (7) H. Noumi et al., Phys. Rev. C52, 2936 (1995).
- (8) T. Motoba et al., Nucl. Phys. A489, 683 (1988).
- (9) T. Motoba and K Itonaga, Prog. Theo. Phys. Suppl. No.117, 477 (1994).
- (10) J. Nieves and E. Oset, Phys. Rev. C47, 1478 (1993).
- (11) J. F. Dubach, Nucl. Phys. A450, 71c (1986).
- (12) H. Bando, T. Motoba and J. Zofka, Inter. Journ. Mod. Phys. A Vol.5 No.21 (1990), 4021-4198.
- (13) A. Parreno, A Ramos and C. Bennhold, Phys. Rev. C56, 339 (1997).
- (14) K. Itonaga et al., Nucl. Phys. A639, 329c (1998).
- (15) T. Inoue, S. Takeuchi and M. Oka, Nucl. Phys. A597, 563 (1996).
- (16) H. Bhang et al., Phys. Rev. Lett. 81, 4321 (1998).
- (17) H. Park et al., Phys. Rev. C61, 054004 (2000).
- (18) O. Hashimoto et al., Phys. Rev. Lett. 88, 042503 (2000).
- (19) B. Povh, Nucl. Phys. A335, 233 (1980).
- (20) K. H. Tanaka et al., Nucl. Instr. Meth. A363, 114-119 (1995).
- (21) C. B. Dover et al., Phys. Rev. C22, 2073 (1980).
- (22) T. Fukuda et al., Nucl. Instr. and Meth. A361, 485-496 (1995).
- (23) D. H. Davis, Nucl. Phys. A547, 369c (1992).
- (24) T. Hasegawa et al., Phys. Rev. C53, 1210 (1996).
- (25) M. Akei et al., Nucl. Phys. A534, 478 (1991).
- (26) Y. D. Kim et al., Nucl. Instr. and Meth. A372, 431 (1996).
- (27) CERN Program Library Entry W5013, GEANT.
- (28) T. Motoba et al., Phys. Rev. C38, 1322 (1988).
- (29) G. Bohm et al., Nucl. Phys. B24, 248 (1970).
- (30) M. Julic et al., Nucl. Phys. B47, 36 (1972).
- (31) S. Ajimura et al., Phys. Rev. Lett. 68, 2137 (1992)
- (32) T. Kishimoto et al., Phys. Rev. C51, 2233 (1995)
- (33) A. Ramos et al., Phys. Rev. C55, 735 (1997).
- (34) A. Ramos, private communications.
- (35) R. C. Carrasco et al., Nucl. Phys. A570, 701-721 (1994).
- (36) A. Ramos et al., Preprint in nucl-th/0206036.
- (37) J. A. Carr et al., Phys. Rev. C25, 952 (1982).
- (38) C. S. Whisnant, Phys. Rev. C34, 262 (1986).
- (39) H. Ohm et al., Phys. Rev. C55, 3062 (1997).
- (40) P Kulessa et al., Nucl. Phys. A639. 283c (1998).
- (41) K. Itonaga et al. Phys. Rev. C65, 034617 (2002).
- (42) W. M. Alberico et al., Phys. Rev. C61, 044314 (2000).
- (43) A. Ramos et al., Phys. Rev. C50, 2314 (1994).
-
(44)
K. Sasaki et al., Nucl. Phys. A669, 331-350 (2000).
K. Sasaki et al., Nucl. Phys. A678, 455-456 (2000). - (45) A. Parreno and A Ramos, Phys. Rev. C65, 015204 (2001).
- (46) W. M. Alberico, Nucl. Phys. A691, 163c-169c (2001).
- (47) KEK PS experiment E369, spokesperson T. Nagae, (1996).
- (48) H. Hotchi et al., Phys. Rev. C64, 044302 (2001).
- (49) J. H. Kim et al., Phys. Rev. C68, 065201, (2003).
- (50) KEK PS experiment E462, spokesperson H. Outa (2000).
- (51) H. C. Bhang et al., Nucl. Phys. A691, 156c (2002).


| () | YHY | Yp | Y | |
|---|---|---|---|---|
| C | 314 | |||
| B | ||||
| Si | 620 | |||
| Al | ||||
| ΛFe | 919 |
| / | Refs. | |||
| “1N only” | “1N and 2N” | |||
| Experiment | ||||
| C | Presenta) | |||
| () Ramos97 | ||||
| Noumi95 | ||||
| Szym91 | ||||
| B | Present | |||
| Noumi95 | ||||
| Szym91 | ||||
| Si | Presenta) | |||
| () Ramos97 | ||||
| Al | Present | |||
| ΛFe | Presenta) | |||
| () Ramos97 | ||||
| Theory | ||||
| C | 1.060 | 0.368 | Itonaga_PRC02 | |
| 0.82 | Alberico_PRC00 | |||
| 0.726 | 0.288 | NSC97a Parreno_PRC01 | ||
| 0.554 | 0.341 | NSC97f Parreno_PRC01 | ||
| Si | 1.556 | 0.402 | Itonaga_PRC02 | |
| 1.02 | Alberico_PRC00 | |||
| Fe | 1.679 | 0.455 | Itonaga_PRC02 | |
| 1.12 | Alberico_PRC00 | |||
| Bi | COSY_NPA98 | |||
| U | COSY_PRC97 | |||
| 2.456 | 0.716 | Oka_NPA00 | ||
a) The uncertainty of theoretical calculations in the proton energy spectra
is not included in the systematic errors.
b) The results of lifetime measurements were converted to the nonmesonic
decay widths, assuming that no mesonic decay occurs in heavy hypernuclei.
| / | Refs. | |
|---|---|---|
| Experiment | ||
| C | Present | |
| Noumi95 | ||
| Szym91 | ||
| B | Present | |
| Noumi95 | ||
| Si | Present | |
| Al | Present | |
| ΛFe | (90% CL) | Present |
| Theory | ||
| C | 0.058 (FREE) | Motoba88_NPA |
| 0.134 (MSU) | Motoba88_NPA | |
| 0.107 (WHIS) | Motoba88_NPA | |
| 0.098 (FULL) | Motoba94 | |
| 0.086 (Nieves) | Nieves93 | |
| B | 0.134 (FREE) | Motoba88_NPA |
| 0.294 (MSU) | Motoba88_NPA | |
| 0.223 (WHIS) | Motoba88_NPA | |
| 0.213 (FULL) | Motoba94 | |
| Si | 0.027 (FULL) | Motoba94 |
| Al | 0.065 (FULL) | Motoba94 |