Two-particle correlations on transverse momentum and momentum dissipation in Au-Au collisions at = 130 GeV
J. Adams
University of Birmingham, Birmingham, United Kingdom
M.M. Aggarwal
Panjab University, Chandigarh 160014, India
Z. Ahammed
Variable Energy Cyclotron Centre, Kolkata 700064, India
J. Amonett
Kent State University, Kent, Ohio 44242
B.D. Anderson
Kent State University, Kent, Ohio 44242
M. Anderson
University of California, Davis, California 95616
D. Arkhipkin
Particle Physics Laboratory (JINR), Dubna, Russia
G.S. Averichev
Laboratory for High Energy (JINR), Dubna, Russia
Y. Bai
NIKHEF and Utrecht University, Amsterdam, The Netherlands
J. Balewski
Indiana University, Bloomington, Indiana 47408
O. Barannikova
L.S. Barnby
University of Birmingham, Birmingham, United Kingdom
J. Baudot
Institut de Recherches Subatomiques, Strasbourg, France
S. Bekele
Ohio State University, Columbus, Ohio 43210
V.V. Belaga
Laboratory for High Energy (JINR), Dubna, Russia
A. Bellingeri-Laurikainen
SUBATECH, Nantes, France
R. Bellwied
Wayne State University, Detroit, Michigan 48201
B.I. Bezverkhny
Yale University, New Haven, Connecticut 06520
S. Bhardwaj
University of Rajasthan, Jaipur 302004, India
A. Bhasin
University of Jammu, Jammu 180001, India
A.K. Bhati
Panjab University, Chandigarh 160014, India
H. Bichsel
University of Washington, Seattle, Washington 98195
J. Bielcik
Yale University, New Haven, Connecticut 06520
J. Bielcikova
Yale University, New Haven, Connecticut 06520
L.C. Bland
Brookhaven National Laboratory, Upton, New York 11973
C.O. Blyth
University of Birmingham, Birmingham, United Kingdom
S-L. Blyth
Lawrence Berkeley National Laboratory, Berkeley, California 94720
B.E. Bonner
Rice University, Houston, Texas 77251
M. Botje
NIKHEF and Utrecht University, Amsterdam, The Netherlands
J. Bouchet
SUBATECH, Nantes, France
A.V. Brandin
Moscow Engineering Physics Institute, Moscow Russia
A. Bravar
Brookhaven National Laboratory, Upton, New York 11973
M. Bystersky
Nuclear Physics Institute AS CR, 250 68 Řež/Prague, Czech Republic
R.V. Cadman
Argonne National Laboratory, Argonne, Illinois 60439
X.Z. Cai
Shanghai Institute of Applied Physics, Shanghai 201800, China
H. Caines
Yale University, New Haven, Connecticut 06520
M. Calderón de la Barca Sánchez
University of California, Davis, California 95616
J. Castillo
NIKHEF and Utrecht University, Amsterdam, The Netherlands
O. Catu
Yale University, New Haven, Connecticut 06520
D. Cebra
University of California, Davis, California 95616
Z. Chajecki
Ohio State University, Columbus, Ohio 43210
P. Chaloupka
Nuclear Physics Institute AS CR, 250 68 Řež/Prague, Czech Republic
S. Chattopadhyay
Variable Energy Cyclotron Centre, Kolkata 700064, India
H.F. Chen
University of Science & Technology of China, Hefei 230026, China
J.H. Chen
Shanghai Institute of Applied Physics, Shanghai 201800, China
Y. Chen
University of California, Los Angeles, California 90095
J. Cheng
Tsinghua University, Beijing 100084, China
M. Cherney
Creighton University, Omaha, Nebraska 68178
A. Chikanian
Yale University, New Haven, Connecticut 06520
H.A. Choi
Pusan National University, Pusan, Republic of Korea
W. Christie
Brookhaven National Laboratory, Upton, New York 11973
J.P. Coffin
Institut de Recherches Subatomiques, Strasbourg, France
T.M. Cormier
Wayne State University, Detroit, Michigan 48201
M.R. Cosentino
Universidade de Sao Paulo, Sao Paulo, Brazil
J.G. Cramer
University of Washington, Seattle, Washington 98195
H.J. Crawford
University of California, Berkeley, California 94720
D. Das
Variable Energy Cyclotron Centre, Kolkata 700064, India
S. Das
Variable Energy Cyclotron Centre, Kolkata 700064, India
M. Daugherity
University of Texas, Austin, Texas 78712
M.M. de Moura
Universidade de Sao Paulo, Sao Paulo, Brazil
T.G. Dedovich
Laboratory for High Energy (JINR), Dubna, Russia
M. DePhillips
Brookhaven National Laboratory, Upton, New York 11973
A.A. Derevschikov
Institute of High Energy Physics, Protvino, Russia
L. Didenko
Brookhaven National Laboratory, Upton, New York 11973
T. Dietel
University of Frankfurt, Frankfurt, Germany
P. Djawotho
Indiana University, Bloomington, Indiana 47408
S.M. Dogra
University of Jammu, Jammu 180001, India
W.J. Dong
University of California, Los Angeles, California 90095
X. Dong
University of Science & Technology of China, Hefei 230026, China
J.E. Draper
University of California, Davis, California 95616
F. Du
Yale University, New Haven, Connecticut 06520
V.B. Dunin
Laboratory for High Energy (JINR), Dubna, Russia
J.C. Dunlop
Brookhaven National Laboratory, Upton, New York 11973
M.R. Dutta Mazumdar
Variable Energy Cyclotron Centre, Kolkata 700064, India
V. Eckardt
Max-Planck-Institut für Physik, Munich, Germany
W.R. Edwards
Lawrence Berkeley National Laboratory, Berkeley, California 94720
L.G. Efimov
Laboratory for High Energy (JINR), Dubna, Russia
V. Emelianov
Moscow Engineering Physics Institute, Moscow Russia
J. Engelage
University of California, Berkeley, California 94720
G. Eppley
Rice University, Houston, Texas 77251
B. Erazmus
SUBATECH, Nantes, France
M. Estienne
Institut de Recherches Subatomiques, Strasbourg, France
P. Fachini
Brookhaven National Laboratory, Upton, New York 11973
R. Fatemi
Massachusetts Institute of Technology, Cambridge, MA 02139-4307
J. Fedorisin
Laboratory for High Energy (JINR), Dubna, Russia
K. Filimonov
Lawrence Berkeley National Laboratory, Berkeley, California 94720
P. Filip
Particle Physics Laboratory (JINR), Dubna, Russia
E. Finch
Yale University, New Haven, Connecticut 06520
V. Fine
Brookhaven National Laboratory, Upton, New York 11973
Y. Fisyak
Brookhaven National Laboratory, Upton, New York 11973
J. Fu
Institute of Particle Physics, CCNU (HZNU), Wuhan 430079, China
C.A. Gagliardi
Texas A&M University, College Station, Texas 77843
L. Gaillard
University of Birmingham, Birmingham, United Kingdom
J. Gans
Yale University, New Haven, Connecticut 06520
M.S. Ganti
Variable Energy Cyclotron Centre, Kolkata 700064, India
V. Ghazikhanian
University of California, Los Angeles, California 90095
P. Ghosh
Variable Energy Cyclotron Centre, Kolkata 700064, India
J.E. Gonzalez
University of California, Los Angeles, California 90095
Y.G. Gorbunov
Creighton University, Omaha, Nebraska 68178
H. Gos
Warsaw University of Technology, Warsaw, Poland
O. Grebenyuk
NIKHEF and Utrecht University, Amsterdam, The Netherlands
D. Grosnick
Valparaiso University, Valparaiso, Indiana 46383
S.M. Guertin
University of California, Los Angeles, California 90095
K.S.F.F. Guimaraes
Universidade de Sao Paulo, Sao Paulo, Brazil
Y. Guo
Wayne State University, Detroit, Michigan 48201
N. Gupta
University of Jammu, Jammu 180001, India
T.D. Gutierrez
University of California, Davis, California 95616
B. Haag
University of California, Davis, California 95616
T.J. Hallman
Brookhaven National Laboratory, Upton, New York 11973
A. Hamed
Wayne State University, Detroit, Michigan 48201
J.W. Harris
Yale University, New Haven, Connecticut 06520
W. He
Indiana University, Bloomington, Indiana 47408
M. Heinz
Yale University, New Haven, Connecticut 06520
T.W. Henry
Texas A&M University, College Station, Texas 77843
S. Hepplemann
Pennsylvania State University, University Park, Pennsylvania 16802
B. Hippolyte
Institut de Recherches Subatomiques, Strasbourg, France
A. Hirsch
Purdue University, West Lafayette, Indiana 47907
E. Hjort
Lawrence Berkeley National Laboratory, Berkeley, California 94720
G.W. Hoffmann
University of Texas, Austin, Texas 78712
M.J. Horner
Lawrence Berkeley National Laboratory, Berkeley, California 94720
H.Z. Huang
University of California, Los Angeles, California 90095
S.L. Huang
University of Science & Technology of China, Hefei 230026, China
E.W. Hughes
California Institute of Technology, Pasadena, California 91125
T.J. Humanic
Ohio State University, Columbus, Ohio 43210
G. Igo
University of California, Los Angeles, California 90095
A. Ishihara
University of Texas, Austin, Texas 78712
P. Jacobs
Lawrence Berkeley National Laboratory, Berkeley, California 94720
W.W. Jacobs
Indiana University, Bloomington, Indiana 47408
P. Jakl
Nuclear Physics Institute AS CR, 250 68 Řež/Prague, Czech Republic
F. Jia
Institute of Modern Physics, Lanzhou, China
H. Jiang
University of California, Los Angeles, California 90095
P.G. Jones
University of Birmingham, Birmingham, United Kingdom
E.G. Judd
University of California, Berkeley, California 94720
S. Kabana
SUBATECH, Nantes, France
K. Kang
Tsinghua University, Beijing 100084, China
J. Kapitan
Nuclear Physics Institute AS CR, 250 68 Řež/Prague, Czech Republic
M. Kaplan
Carnegie Mellon University, Pittsburgh, Pennsylvania 15213
D. Keane
Kent State University, Kent, Ohio 44242
A. Kechechyan
Laboratory for High Energy (JINR), Dubna, Russia
V.Yu. Khodyrev
Institute of High Energy Physics, Protvino, Russia
B.C. Kim
Pusan National University, Pusan, Republic of Korea
J. Kiryluk
Massachusetts Institute of Technology, Cambridge, MA 02139-4307
A. Kisiel
Warsaw University of Technology, Warsaw, Poland
E.M. Kislov
Laboratory for High Energy (JINR), Dubna, Russia
S.R. Klein
Lawrence Berkeley National Laboratory, Berkeley, California 94720
D.D. Koetke
Valparaiso University, Valparaiso, Indiana 46383
T. Kollegger
University of Frankfurt, Frankfurt, Germany
M. Kopytine
Kent State University, Kent, Ohio 44242
L. Kotchenda
Moscow Engineering Physics Institute, Moscow Russia
V. Kouchpil
Nuclear Physics Institute AS CR, 250 68 Řež/Prague, Czech Republic
K.L. Kowalik
Lawrence Berkeley National Laboratory, Berkeley, California 94720
M. Kramer
City College of New York, New York City, New York 10031
P. Kravtsov
Moscow Engineering Physics Institute, Moscow Russia
V.I. Kravtsov
Institute of High Energy Physics, Protvino, Russia
K. Krueger
Argonne National Laboratory, Argonne, Illinois 60439
C. Kuhn
Institut de Recherches Subatomiques, Strasbourg, France
A.I. Kulikov
Laboratory for High Energy (JINR), Dubna, Russia
A. Kumar
Panjab University, Chandigarh 160014, India
A.A. Kuznetsov
Laboratory for High Energy (JINR), Dubna, Russia
M.A.C. Lamont
Yale University, New Haven, Connecticut 06520
J.M. Landgraf
Brookhaven National Laboratory, Upton, New York 11973
S. Lange
University of Frankfurt, Frankfurt, Germany
S. LaPointe
Wayne State University, Detroit, Michigan 48201
F. Laue
Brookhaven National Laboratory, Upton, New York 11973
J. Lauret
Brookhaven National Laboratory, Upton, New York 11973
A. Lebedev
Brookhaven National Laboratory, Upton, New York 11973
R. Lednicky
Particle Physics Laboratory (JINR), Dubna, Russia
C-H. Lee
Pusan National University, Pusan, Republic of Korea
S. Lehocka
Laboratory for High Energy (JINR), Dubna, Russia
M.J. LeVine
Brookhaven National Laboratory, Upton, New York 11973
C. Li
University of Science & Technology of China, Hefei 230026, China
Q. Li
Wayne State University, Detroit, Michigan 48201
Y. Li
Tsinghua University, Beijing 100084, China
G. Lin
Yale University, New Haven, Connecticut 06520
S.J. Lindenbaum
City College of New York, New York City, New York 10031
M.A. Lisa
Ohio State University, Columbus, Ohio 43210
F. Liu
Institute of Particle Physics, CCNU (HZNU), Wuhan 430079, China
H. Liu
University of Science & Technology of China, Hefei 230026, China
J. Liu
Rice University, Houston, Texas 77251
L. Liu
Institute of Particle Physics, CCNU (HZNU), Wuhan 430079, China
Z. Liu
Institute of Particle Physics, CCNU (HZNU), Wuhan 430079, China
T. Ljubicic
Brookhaven National Laboratory, Upton, New York 11973
W.J. Llope
Rice University, Houston, Texas 77251
H. Long
University of California, Los Angeles, California 90095
R.S. Longacre
Brookhaven National Laboratory, Upton, New York 11973
M. Lopez-Noriega
Ohio State University, Columbus, Ohio 43210
W.A. Love
Brookhaven National Laboratory, Upton, New York 11973
Y. Lu
Institute of Particle Physics, CCNU (HZNU), Wuhan 430079, China
T. Ludlam
Brookhaven National Laboratory, Upton, New York 11973
D. Lynn
Brookhaven National Laboratory, Upton, New York 11973
G.L. Ma
Shanghai Institute of Applied Physics, Shanghai 201800, China
J.G. Ma
University of California, Los Angeles, California 90095
Y.G. Ma
Shanghai Institute of Applied Physics, Shanghai 201800, China
D. Magestro
Ohio State University, Columbus, Ohio 43210
D.P. Mahapatra
Institute of Physics, Bhubaneswar 751005, India
R. Majka
Yale University, New Haven, Connecticut 06520
L.K. Mangotra
University of Jammu, Jammu 180001, India
R. Manweiler
Valparaiso University, Valparaiso, Indiana 46383
S. Margetis
Kent State University, Kent, Ohio 44242
C. Markert
Kent State University, Kent, Ohio 44242
L. Martin
SUBATECH, Nantes, France
H.S. Matis
Lawrence Berkeley National Laboratory, Berkeley, California 94720
Yu.A. Matulenko
Institute of High Energy Physics, Protvino, Russia
C.J. McClain
Argonne National Laboratory, Argonne, Illinois 60439
T.S. McShane
Creighton University, Omaha, Nebraska 68178
Yu. Melnick
Institute of High Energy Physics, Protvino, Russia
A. Meschanin
Institute of High Energy Physics, Protvino, Russia
M.L. Miller
Massachusetts Institute of Technology, Cambridge, MA 02139-4307
N.G. Minaev
Institute of High Energy Physics, Protvino, Russia
S. Mioduszewski
Texas A&M University, College Station, Texas 77843
C. Mironov
Kent State University, Kent, Ohio 44242
A. Mischke
NIKHEF and Utrecht University, Amsterdam, The Netherlands
D.K. Mishra
Institute of Physics, Bhubaneswar 751005, India
J. Mitchell
Rice University, Houston, Texas 77251
B. Mohanty
Variable Energy Cyclotron Centre, Kolkata 700064, India
L. Molnar
Purdue University, West Lafayette, Indiana 47907
C.F. Moore
University of Texas, Austin, Texas 78712
D.A. Morozov
Institute of High Energy Physics, Protvino, Russia
M.G. Munhoz
Universidade de Sao Paulo, Sao Paulo, Brazil
B.K. Nandi
Indian Institute of Technology, Mumbai, India
C. Nattrass
Yale University, New Haven, Connecticut 06520
T.K. Nayak
Variable Energy Cyclotron Centre, Kolkata 700064, India
J.M. Nelson
University of Birmingham, Birmingham, United Kingdom
P.K. Netrakanti
Variable Energy Cyclotron Centre, Kolkata 700064, India
V.A. Nikitin
Particle Physics Laboratory (JINR), Dubna, Russia
L.V. Nogach
Institute of High Energy Physics, Protvino, Russia
S.B. Nurushev
Institute of High Energy Physics, Protvino, Russia
G. Odyniec
Lawrence Berkeley National Laboratory, Berkeley, California 94720
A. Ogawa
Brookhaven National Laboratory, Upton, New York 11973
V. Okorokov
Moscow Engineering Physics Institute, Moscow Russia
M. Oldenburg
Lawrence Berkeley National Laboratory, Berkeley, California 94720
D. Olson
Lawrence Berkeley National Laboratory, Berkeley, California 94720
M. Pachr
Nuclear Physics Institute AS CR, 250 68 Řež/Prague, Czech Republic
S.K. Pal
Variable Energy Cyclotron Centre, Kolkata 700064, India
Y. Panebratsev
Laboratory for High Energy (JINR), Dubna, Russia
S.Y. Panitkin
Brookhaven National Laboratory, Upton, New York 11973
A.I. Pavlinov
Wayne State University, Detroit, Michigan 48201
T. Pawlak
Warsaw University of Technology, Warsaw, Poland
T. Peitzmann
NIKHEF and Utrecht University, Amsterdam, The Netherlands
V. Perevoztchikov
Brookhaven National Laboratory, Upton, New York 11973
C. Perkins
University of California, Berkeley, California 94720
W. Peryt
Warsaw University of Technology, Warsaw, Poland
V.A. Petrov
Wayne State University, Detroit, Michigan 48201
S.C. Phatak
Institute of Physics, Bhubaneswar 751005, India
R. Picha
University of California, Davis, California 95616
M. Planinic
University of Zagreb, Zagreb, HR-10002, Croatia
J. Pluta
Warsaw University of Technology, Warsaw, Poland
N. Poljak
University of Zagreb, Zagreb, HR-10002, Croatia
N. Porile
Purdue University, West Lafayette, Indiana 47907
J. Porter
University of Washington, Seattle, Washington 98195
A.M. Poskanzer
Lawrence Berkeley National Laboratory, Berkeley, California 94720
M. Potekhin
Brookhaven National Laboratory, Upton, New York 11973
E. Potrebenikova
Laboratory for High Energy (JINR), Dubna, Russia
B.V.K.S. Potukuchi
University of Jammu, Jammu 180001, India
D. Prindle
University of Washington, Seattle, Washington 98195
C. Pruneau
Wayne State University, Detroit, Michigan 48201
J. Putschke
Lawrence Berkeley National Laboratory, Berkeley, California 94720
G. Rakness
Pennsylvania State University, University Park, Pennsylvania 16802
R. Raniwala
University of Rajasthan, Jaipur 302004, India
S. Raniwala
University of Rajasthan, Jaipur 302004, India
R.L. Ray
University of Texas, Austin, Texas 78712
S.V. Razin
Laboratory for High Energy (JINR), Dubna, Russia
J.G. Reid
University of Washington, Seattle, Washington 98195
J. Reinnarth
SUBATECH, Nantes, France
D. Relyea
California Institute of Technology, Pasadena, California 91125
F. Retiere
Lawrence Berkeley National Laboratory, Berkeley, California 94720
A. Ridiger
Moscow Engineering Physics Institute, Moscow Russia
H.G. Ritter
Lawrence Berkeley National Laboratory, Berkeley, California 94720
J.B. Roberts
Rice University, Houston, Texas 77251
O.V. Rogachevskiy
Laboratory for High Energy (JINR), Dubna, Russia
J.L. Romero
University of California, Davis, California 95616
A. Rose
Lawrence Berkeley National Laboratory, Berkeley, California 94720
C. Roy
SUBATECH, Nantes, France
L. Ruan
Lawrence Berkeley National Laboratory, Berkeley, California 94720
M.J. Russcher
NIKHEF and Utrecht University, Amsterdam, The Netherlands
R. Sahoo
Institute of Physics, Bhubaneswar 751005, India
I. Sakrejda
Lawrence Berkeley National Laboratory, Berkeley, California 94720
S. Salur
Yale University, New Haven, Connecticut 06520
J. Sandweiss
Yale University, New Haven, Connecticut 06520
M. Sarsour
Texas A&M University, College Station, Texas 77843
P.S. Sazhin
Laboratory for High Energy (JINR), Dubna, Russia
J. Schambach
University of Texas, Austin, Texas 78712
R.P. Scharenberg
Purdue University, West Lafayette, Indiana 47907
N. Schmitz
Max-Planck-Institut für Physik, Munich, Germany
K. Schweda
Lawrence Berkeley National Laboratory, Berkeley, California 94720
J. Seger
Creighton University, Omaha, Nebraska 68178
I. Selyuzhenkov
Wayne State University, Detroit, Michigan 48201
P. Seyboth
Max-Planck-Institut für Physik, Munich, Germany
A. Shabetai
Lawrence Berkeley National Laboratory, Berkeley, California 94720
E. Shahaliev
Laboratory for High Energy (JINR), Dubna, Russia
M. Shao
University of Science & Technology of China, Hefei 230026, China
M. Sharma
Panjab University, Chandigarh 160014, India
W.Q. Shen
Shanghai Institute of Applied Physics, Shanghai 201800, China
S.S. Shimanskiy
Laboratory for High Energy (JINR), Dubna, Russia
E Sichtermann
Lawrence Berkeley National Laboratory, Berkeley, California 94720
F. Simon
Massachusetts Institute of Technology, Cambridge, MA 02139-4307
R.N. Singaraju
Variable Energy Cyclotron Centre, Kolkata 700064, India
N. Smirnov
Yale University, New Haven, Connecticut 06520
R. Snellings
NIKHEF and Utrecht University, Amsterdam, The Netherlands
G. Sood
Valparaiso University, Valparaiso, Indiana 46383
P. Sorensen
Brookhaven National Laboratory, Upton, New York 11973
J. Sowinski
Indiana University, Bloomington, Indiana 47408
J. Speltz
Institut de Recherches Subatomiques, Strasbourg, France
H.M. Spinka
Argonne National Laboratory, Argonne, Illinois 60439
B. Srivastava
Purdue University, West Lafayette, Indiana 47907
A. Stadnik
Laboratory for High Energy (JINR), Dubna, Russia
T.D.S. Stanislaus
Valparaiso University, Valparaiso, Indiana 46383
R. Stock
University of Frankfurt, Frankfurt, Germany
A. Stolpovsky
Wayne State University, Detroit, Michigan 48201
M. Strikhanov
Moscow Engineering Physics Institute, Moscow Russia
B. Stringfellow
Purdue University, West Lafayette, Indiana 47907
A.A.P. Suaide
Universidade de Sao Paulo, Sao Paulo, Brazil
E. Sugarbaker
Ohio State University, Columbus, Ohio 43210
M. Sumbera
Nuclear Physics Institute AS CR, 250 68 Řež/Prague, Czech Republic
Z. Sun
Institute of Modern Physics, Lanzhou, China
B. Surrow
Massachusetts Institute of Technology, Cambridge, MA 02139-4307
M. Swanger
Creighton University, Omaha, Nebraska 68178
T.J.M. Symons
Lawrence Berkeley National Laboratory, Berkeley, California 94720
A. Szanto de Toledo
Universidade de Sao Paulo, Sao Paulo, Brazil
A. Tai
University of California, Los Angeles, California 90095
J. Takahashi
Universidade de Sao Paulo, Sao Paulo, Brazil
A.H. Tang
Brookhaven National Laboratory, Upton, New York 11973
T. Tarnowsky
Purdue University, West Lafayette, Indiana 47907
D. Thein
University of California, Los Angeles, California 90095
J.H. Thomas
Lawrence Berkeley National Laboratory, Berkeley, California 94720
A.R. Timmins
University of Birmingham, Birmingham, United Kingdom
S. Timoshenko
Moscow Engineering Physics Institute, Moscow Russia
M. Tokarev
Laboratory for High Energy (JINR), Dubna, Russia
T.A. Trainor
University of Washington, Seattle, Washington 98195
S. Trentalange
University of California, Los Angeles, California 90095
R.E. Tribble
Texas A&M University, College Station, Texas 77843
O.D. Tsai
University of California, Los Angeles, California 90095
J. Ulery
Purdue University, West Lafayette, Indiana 47907
T. Ullrich
Brookhaven National Laboratory, Upton, New York 11973
D.G. Underwood
Argonne National Laboratory, Argonne, Illinois 60439
G. Van Buren
Brookhaven National Laboratory, Upton, New York 11973
N. van der Kolk
NIKHEF and Utrecht University, Amsterdam, The Netherlands
M. van Leeuwen
Lawrence Berkeley National Laboratory, Berkeley, California 94720
A.M. Vander Molen
Michigan State University, East Lansing, Michigan 48824
R. Varma
Indian Institute of Technology, Mumbai, India
I.M. Vasilevski
Particle Physics Laboratory (JINR), Dubna, Russia
A.N. Vasiliev
Institute of High Energy Physics, Protvino, Russia
R. Vernet
Institut de Recherches Subatomiques, Strasbourg, France
S.E. Vigdor
Indiana University, Bloomington, Indiana 47408
Y.P. Viyogi
Variable Energy Cyclotron Centre, Kolkata 700064, India
S. Vokal
Laboratory for High Energy (JINR), Dubna, Russia
S.A. Voloshin
Wayne State University, Detroit, Michigan 48201
W.T. Waggoner
Creighton University, Omaha, Nebraska 68178
F. Wang
Purdue University, West Lafayette, Indiana 47907
G. Wang
University of California, Los Angeles, California 90095
J.S. Wang
Institute of Modern Physics, Lanzhou, China
X.L. Wang
University of Science & Technology of China, Hefei 230026, China
Y. Wang
Tsinghua University, Beijing 100084, China
J.W. Watson
Kent State University, Kent, Ohio 44242
J.C. Webb
Valparaiso University, Valparaiso, Indiana 46383
G.D. Westfall
Michigan State University, East Lansing, Michigan 48824
A. Wetzler
Lawrence Berkeley National Laboratory, Berkeley, California 94720
C. Whitten Jr
University of California, Los Angeles, California 90095
H. Wieman
Lawrence Berkeley National Laboratory, Berkeley, California 94720
S.W. Wissink
Indiana University, Bloomington, Indiana 47408
R. Witt
Yale University, New Haven, Connecticut 06520
J. Wood
University of California, Los Angeles, California 90095
J. Wu
University of Science & Technology of China, Hefei 230026, China
N. Xu
Lawrence Berkeley National Laboratory, Berkeley, California 94720
Q.H. Xu
Lawrence Berkeley National Laboratory, Berkeley, California 94720
Z. Xu
Brookhaven National Laboratory, Upton, New York 11973
P. Yepes
Rice University, Houston, Texas 77251
I-K. Yoo
Pusan National University, Pusan, Republic of Korea
V.I. Yurevich
Laboratory for High Energy (JINR), Dubna, Russia
W. Zhan
Institute of Modern Physics, Lanzhou, China
H. Zhang
Brookhaven National Laboratory, Upton, New York 11973
W.M. Zhang
Kent State University, Kent, Ohio 44242
Y. Zhang
University of Science & Technology of China, Hefei 230026, China
Z.P. Zhang
University of Science & Technology of China, Hefei 230026, China
Y. Zhao
University of Science & Technology of China, Hefei 230026, China
C. Zhong
Shanghai Institute of Applied Physics, Shanghai 201800, China
R. Zoulkarneev
Particle Physics Laboratory (JINR), Dubna, Russia
Y. Zoulkarneeva
Particle Physics Laboratory (JINR), Dubna, Russia
A.N. Zubarev
Laboratory for High Energy (JINR), Dubna, Russia
J.X. Zuo
Shanghai Institute of Applied Physics, Shanghai 201800, China
Abstract
Measurements of two-particle correlations on transverse
momentum for Au-Au collisions at GeV are presented. Significant large-momentum-scale correlations are observed
for charged primary hadrons with GeV/ and
pseudorapidity . Such correlations
were not observed in a similar study at lower energy and are not
predicted by theoretical collision models. Their direct relation to mean- fluctuations measured in the same angular acceptance is demonstrated.
Positive correlations are observed for pairs of particles which have large
values while negative correlations occur for pairs in which one particle has
large and the other has much lower . The correlation amplitudes
per final state particle increase with collision centrality.
The observed correlations are consistent with a scenario in which
the transverse momentum of hadrons associated with initial-stage
semi-hard parton scattering
is dissipated by the medium to lower .
pacs:
25.75.-q, 25.75.Gz
I Introduction
Studying two-particle correlations and event-wise fluctuations can provide essential information about the medium produced in ultrarelativistic heavy ion collisions stock ; poly ; tricrit . At the collision energies available at the Relativistic Heavy Ion Collider (RHIC) energetic parton scattering occurs at sufficient rate to enable quantitative studies of in-medium modification of parton scattering and the distribution of correlated charged hadrons associated with
those energetic partons. Modification of those correlation structures is expected as the bulk medium produced in ultrarelativistic heavy ion collisions increases in spatial extent and
energy density with increasing collision centrality. Analyses of the centrality dependence in Au-Au collisions of high- back-to-back jet angular correlations based on a leading-particle technique (e.g., leading-particle GeV/, associated particle GeV/) reveal strong suppression for central collisions backjet ; phenixbackjet , suggesting the development of a medium which dramatically dissipates momentum.
Complementary studies of the lower- bulk medium, its correlation structure on transverse momentum, and how those correlations evolve with collision centrality provide a measure of the momentum transport from the few GeV/ range to
lower of order a few tenths of a GeV/ where the bulk hadronic
production occurs.
Such studies are an essential part of understanding the
nature of the medium produced in heavy ion collisions at RHIC.
In addition to jet angular correlations at high-
substantial nonstatistical fluctuations in event-wise mean transverse momentum of charged particles from Au-Au collisions were reported by the STAR meanptprl and PHENIX phenixmeanpt experiments at RHIC. fluctuations at RHIC are much larger than those reported at the CERN Super Proton Synchrotron (SPS) with one-tenth the CM energy gunter , and were not predicted by theoretical models meanptprl ; jetquench ; rqmd ; ampt . fluctuations could result from several sources
including collective flow (e.g., elliptic flow starflow when azimuthal acceptance is incomplete), local temperature fluctuations, quantum interference starhbt ,
final-state interactions, resonance decays, longitudinal fragmentation lund ,
and initial-state multiple scattering iss including hard parton scattering jetquench with subsequent in-medium dissipation newref .
fluctuations can be directly related to integrals of two-particle correlations over the acceptance. Correlations on , by providing differential information, better reveal the underlying dynamics for the observed nonstatistical fluctuations in .
In this paper we report the first measurements at RHIC of two-particle correlations (based on number of pairs) on two-dimensional (2D) transverse momentum space for all charged particles with GeV/ and (pseudorapidity) using the GeV Au-Au collisions observed with the STAR detector star .
This analysis is intended to reveal the response of the bulk medium to strong momentum dissipation and probe the dynamical origins of fluctuations.
The data used in this analysis are described in Sec. II and the
analysis method, corrections and errors are discussed in
Sec. III. Models and fits to the data are presented in
Secs. IV and V, respectively. A discussion and summary
are presented in the last two sections VI and VII.
II Data
Data for this analysis were obtained with the STAR detector star
using a 0.25 T uniform magnetic field parallel to the beam axis.
A minimum-bias event sample (123k triggered events) required coincidence of two Zero-Degree Calorimeters (ZDC); a 0-15% of total cross section event sample (217k triggered events) was defined by a threshold on the Central Trigger Barrel (CTB) scintillators, with ZDC coincidence. Event triggering and charged-particle measurements with the Time Projection Chamber (TPC) are described in star . Approximately 300k events were selected for use in this analysis.
A primary event vertex within 75 cm of the axial center of the TPC was required.
Valid TPC tracks fell within the detector acceptance used here, defined by GeV/, and in azimuth. Primary tracks were defined as having a distance of closest approach less than 3 cm from the reconstructed primary vertex which included a large fraction of true primary hadrons plus approximately 7% background contamination spectra from weak decays
and interactions with the detector material. In addition accepted particle tracks were required to include a minimum of 10 fitted points (the TPC contains 45 pad rows in
each sector) and, to eliminate split tracks (i.e., one
particle trajectory reconstructed as two or more tracks), the fraction of space points used in a track fit relative to the maximum number expected was required to be .
Particle identification was not implemented but charge sign was determined.
Further details associated with track definitions, efficiencies and quality cuts are described in spectra ; ayathesis .
III Data Analysis
III.1 Analysis Method
Our eventual goal is to determine the complete structure of the six-dimensional two-particle correlation for all hadron pair charge combinations.
Toward this goal the two-particle momentum space was projected onto 2D subspace by integrating the pseudorapidity and azimuth coordinates over the detector acceptance for this analysis, and full azimuth. Projection onto 2D subspace is achieved by filling 2D binned histograms of the number of pairs of particles for all values of within the acceptance.
Complementary correlation structures on relative pseudorapidity and azimuth coordinates with integration over transverse momentum acceptance are reported in axialci ; axialcd .
The quantities obtained here are ratios of normalized
histograms of sibling pairs (particles from the same event) to
mixed-event pairs (each particle of the pair is from a different, but similar event)
in an arbitrary 2D bin with indices representing the values of and (see discussion below).
The normalized pair-number ratio introduced in isrpp is here defined by
(1)
where (sum over all 2D
bins), , and and
are the inclusive number of sibling and mixed-event pairs, respectively, in 2D bin . Histograms and ratios were constructed for each charge-sign combination: , , and .
Ratio is approximately 1, while difference measures correlation amplitudes and is the quantity reported here.
The exponential decrease in particle yield with increasing degrades the statistical accuracy of at larger transverse momentum, thus obscuring the statistically significant correlation structures there. In order to achieve approximately uniform statistical accuracy across the full domain considered here, nonuniform bin sizes on were used. This was done by noting that the charged hadron distribution, , for Au-Au collisions at GeV is approximately exponential for GeV/ spectra and by dividing the running integral of that exponential distribution into equal bin sizes. This procedure provides a convenient mapping from to function where , , and (here assumed to be the pion mass ) is a mapping parameter from coordinate to Xmap . Equal bin sizes in therefore have approximately the same number of sibling pairs. For this analysis 25 equal width bins on from to were used ytxyt .
Normalized pair-number ratios were formed from subsets of events with similar centrality (multiplicities differ by , except for the most-central event class) and primary-vertex location (within 7.5 cm along the beam axis) and combined as weighted (by sibling pair number) averages within each centrality class.
The normalized pair-number ratios for each charge-sign
were combined to form like-sign (LS: ) and
unlike-sign (US: ) quantities. The final
correlations reported here were averaged over all four charge-sign quantities,
resulting in the
correlation structures common to all charge-sign combinations.
Hence we refer to these final results as charge-independent (CI = LS + US) correlations even though they are constructed from quantities which depend on
the charge signs of the hadron pairs. The correlation measure reported here is therefore the CI combination for .
Deviations of event-wise fluctuations from a central-limit-theorem reference cltps ; handbook are measured by scale-dependent (i.e., bin sizes) variance difference introduced in meanptprl , where it was evaluated at the STAR () detector acceptance scale. can be expressed as a weighted integral on of pair-density difference , where two-particle densities and are approximated by the event-averaged number of sibling and mixed-event pairs per 2D bin, respectively. Both densities are normalized to the event-averaged total number of pairs. can be rewritten exactly as a discrete sum over products cltps [first line in Eq. (III.1) below], and the summations approximated in turn by the weighted integral of the pair density difference [second line in Eq. (III.1)] according to,
where weighted average is defined in the last line with weight and
the integral of , is rhomix . In Eq. (III.1) is the event-wise number of accepted particles, is the mean of in the centrality bin, is the number of events, the event index, is the mean of the ensemble-average distribution (all accepted particles from all events in a centrality bin), and are particle indices. Eq. (III.1) relates nonstatistical fluctuations at the acceptance scale to the weighted integral of , the latter difference being related to the two-particle number correlation density. In the present analysis we measure normalized pair-ratio distributions exhibiting two-particle number correlations on which correspond to excess fluctuations.
III.2 Corrections and centrality
Corrections were applied to ratio for two-particle reconstruction inefficiencies due to overlapping space points in the TPC (two trajectories merged into one reconstructed track) and intersecting trajectories which cross paths within the TPC and are reconstructed as more than two tracks. These corrections were implemented using two-track proximity cuts trackcuts at various radial positions in the TPC in both the longitudinal (drift) and transverse directions (approximately along the pad rows). The track pair cuts were applied to both and as in HBT analyses starhbt .
Small-momentum-scale correlation structures due to quantum interference,
Coulomb and strong final-state interactions starhbt were suppressed by eliminating sibling and mixed-event track pairs (3% of total pairs) with , (azimuth), GeV/, if GeV/ for either particle. The small-momentum-scale correlation (SSC) structures are most prominent in the lower- domain of the 2D space along the diagonal and were shown to be similar in amplitude and location to simulations mevsim which account for quantum interference correlations and Coulomb final-state interaction effects using pair weights determined by HBT analyses for these data starhbt . The preceding cuts were optimized ayathesis to eliminate SSC structure without affecting the large-momentum-scale correlation (LSC) structure which is of primary interest here. The track-pair cuts generally have small effects on the LSC; uncertainties which result from application of these cuts are discussed in Sec. III.3 and are negligible compared to the large momentum scale structures studied here.
Four centrality classes labeled (a) - (d) for central to peripheral were defined by cuts on TPC track multiplicity within the acceptance
by (d) , (c) , (b) and (a) , corresponding respectively to approximate fraction of total cross section ranges 40-70%, 17-40%, 5-17% and 0-5%.
is the end-point endpoint of the minimum-bias multiplicity distribution.
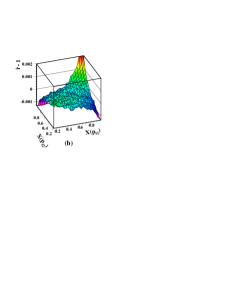
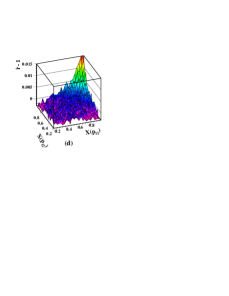
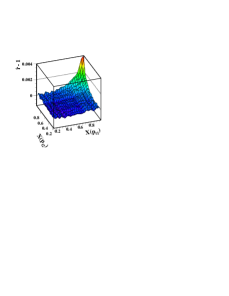
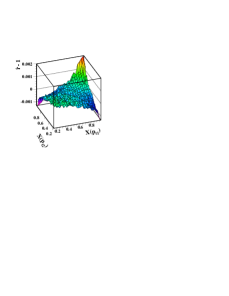
Figure 1: Symmetrized pair-density net ratios for all nonidentified charged primary particles for (a) most-central, (b) mid-central, (c) mid-peripheral, and (d) peripheral Au-Au collision events at GeV/. Note the scale change for panels (c) and (d) and auxiliary scale in units GeV/ in panel (a). SSC were removed using track pair cuts (see text). Errors are discussed in Sec. III.3.
The centrality dependence of quantity is shown in Fig. 1 as perspective views for the four centrality classes used here. This correlation measure represents the number of correlated particle pairs per final-state pair in each 2D bin, and therefore contains a dilution factor relative to the LSC measure presented in axialcd , whose amplitudes are of order one.
The structures in Fig. 1 are therefore numerically a few permil for central Au-Au collisions but are highly significant statistically as seen by comparing to the statistical errors.
The dominant features in Fig. 1 are 1) a large-momentum-scale correlation ‘saddle’ structure with positive curvature along the sum direction from (0,0) to (1,1) and a corresponding negative curvature along the difference direction from (0,1) to (1,0), and 2) a narrow peak structure at large ( GeV/). With increasing centrality the negative curvature of the LSC saddle shape along the difference variable increases in magnitude, the positive curvature along the sum variable decreases, and the magnitude of the peak at large also decreases. Without the SSC cuts a relatively small peaked structure with amplitude of order 0.004 (peripheral) to 0.0005 (central) is present for ( GeV/) which weakens in amplitude but visibly persists to ( GeV/).
An upper limit estimate for resonance contributions was obtained using Monte Carlo simulations mevsim assuming 70% of the primary charged particle production is from resonance decays. The correlations were simulated by populating the events with a sufficient number of two-body decays to account for 70% of the observed multiplicity. These two-body decay processes produced a small saddle-shape correlation with curvature opposite to the data and amplitude at the corners approximately 0.0002 for the most-central data, increasing as for the remaining centrality bins. The saddle-shape structures in Fig. 1 cannot be explained with resonance decays.
The same analysis applied to Pb-Pb collisions in at the CERN SPS did not reveal any statistically significant CI correlations jeffdata when SSC (see Sec. III.2) were removed with pair cuts. The analysis in anticic of proton + proton and various nucleus + nucleus collision data from the CERN SPS for without those pair cuts revealed SSC peaks at low along the direction.
III.3 Error analysis
Per-bin statistical errors for in Fig. 1
range from 6-9% of the maximum correlation amplitude for each centrality
[typically 0.00015, 0.00011, 0.00035 and 0.001 for centralities (a)-(d) respectively] and are approximately uniform, by design, over the 2D domain on . Statistical errors for (0.1 - 0.15) are less dependent on centrality.
Systematic errors were estimated as in axialcd ; meanptprl and
are dominated by the 7% non-primary background contamination spectra whose correlation with primary particles is unknown. The upper limit on the systematic error from this source was estimated by assuming the number of correlated pairs associated with background-primary pairs of particles could range from zero up to the amount which would occur among 7% of the primary particles and the remaining primaries. This conservative assumption produces an overall 7% uncertainty relative to the correlation amplitudes in Fig. 1 throughout the domain for . This error increases to 16% at lower where the contamination fraction is larger and is about 12% in the off-diagonal corners of the domain. Multiplicative factors for quantity which correct for the non-primary background contamination range from 1.0, assuming background-primary particle pairs are correlated and increase both and by % = 14%, to 1.14 if background-primary particle pairs are uncorrelated but the non-primary background contributes 14% to . Multiplication of the data in Fig. 1 by average factor 1.07 provides an estimate of the background corrected correlation amplitudes.
Additional sources of systematic error were evaluated.
Uncertainty in the two-track inefficency corrections have modest effects along the diagonal (%) and are negligible elsewhere. Tracking anomalies caused when particle trajectories intersect the TPC high-voltage central membrane significantly affect the domain corresponding to the single bin at lowest , and the diagonal bins for by 20%.
Final multiplicative correction estimates (not applied in Fig. 1) and total systematic errors for varied respectively from 1.07 and 7% for up to 1.16 and 16-20% for and 1.12 and 12% in the off-diagonal corners [i.e., near (0,1) and (1,0)].
Other potential sources of systematic error were studied and determined to have
negligible effects including primary vertex position uncertainty perpendicular to the beam direction, variation of tracking acceptance and efficiency with primary vertex location along the axis of the TPC, TPC drift speed and/or timing-offset fluctuation, sporadic outages of TPC read-out electronic components, angular
resolution, multiplicity and primary vertex position bin sizes used for producing mixed events, and charge sign dependence of the tracking efficiency.
Conversion electron contamination is suppressed by the lower acceptance cut and also by the pair cuts described in Sec. III.2 and also makes negligible contribution to the systematic error.
IV Modeling One- and Two-Particle Distributions on
Two features dominate the data in Fig. 1: 1) a large-momentum
scale saddle shape and 2) a peak at large and . In
this section results from Monte Carlo collision models are
analyzed in order to gain insight into the dynamical origin(s) of these two
correlation structures in the data. Based on this study an
analytical function is obtained which accurately describes the saddle shape
and in Sec. V this function is used to fit the 2D correlation
data.
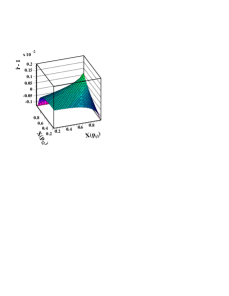
The high energy nuclear collision model hijingjetquench , which includes longitudinal color-string fragmentation and perturbative quantum chromodynamics (pQCD) based jet production and jet quenching, exhibits significant correlation structure at higher [] as shown in the left-hand panel of Fig. 2 for central Au-Au collisions. The predictions, which include jet production with jet quenching (default parameters) are qualitatively different from the data in Fig. 1, failing to produce any saddle-shape, but suggest the type of correlation structure produced by jets.
The general structure of the hijing predictions suggests that the peaks in the data at higher are at least partly due to initial-state partonic scattering and fragmentation. Other theoretical models which combine initial-state parton scattering, energy loss, dissipation, rescattering and recombination ampt ; reco may eventually explain these correlation data, but relevant predictions are not available at this time.
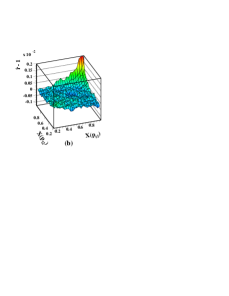
Figure 2: Symmetrized pair-density ratio for unidentified charged particles and for central Au-Au collisions. Left panel: Default Hijingjetquench with jet quenching,
Right panel: a Monte Carlo model mevsim which simulates event-wise global temperature fluctuations (see text).
The saddle-shape correlation spans the entire momentum scale studied here, suggesting event-wise fluctuations of global event characteristics (e.g. temperature and/or collective velocity of the bulk medium) as a possible source. If heavy ion collisions at RHIC thermalize then an ensemble of collision events would be characterized by a distribution of event-wise equilibrium temperatures reflecting event-to-event fluctuations in the initial conditions and time evolution of each colliding system. Based on this idea the transverse momentum correlations for an ensemble of such events can be predicted using a Monte Carlo model in which charged particle production is generated by sampling the inclusive single-particle distribution obtained from the data. At mid-rapidity the inclusive distribution on for GeV/ is well approximated by spectra where is an effective temperature ssh or inverse slope parameter and . Events were generated by sampling where fluctuates randomly from event-to-event according to a gaussian distribution about mean value ; was determined by the measured spectrum.
The result of this Monte Carlo model for central Au-Au collisions at 130 GeV is shown in the right-hand panel of Fig. 2 where the mean and standard deviation (gaussian sigma) of the event-wise temperature distribution are MeV and %. The predicted correlations are not sensitive to but the overall correlation amplitude is directly sensitive to which was adjusted to approximate the overall amplitude of the data in Fig. 1(a). The global temperature fluctuation model accurately describes the saddle-shape. An analytical function based on this approach is derived in the remainder of this section and is used in the following section (Sec. V) to fit the data.
We seek an analytical representation of the LSC saddle-shape
structure of the data in Fig. 1 that is both mathematically
compact and physically motivated in order to conveniently characterize the centrality dependence and to infer thermodynamic properties of the medium. The above Monte Carlo results indicate that a successful representation should involve an averaging over the inverse slope parameter. In general the inverse temperature can vary from event-to-event as well as internally within each event, reflecting the possibility
of relative “hot spots” and “cold spots” in the final-state particle distributions. The number, location in source coordinates (e.g., space-time rapidity ssh and azimuth), amplitude, and angular extent of these perturbations in may vary for each event. In addition, for realistic collision systems both thermal and collective motions are involved such that parameter becomes an inverse effective temperature ssh where fluctuations in could result from fluctuations in the local temperature of the flowing medium, the collective flow velocity itself, or a combination of both effects tempflow . Event-wise effective temperature is therefore represented by distribution on source coordinates and , and similarly for .
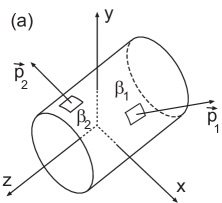
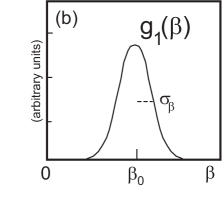
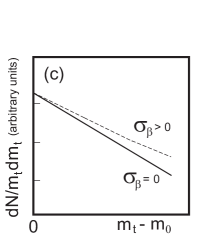
The momentum of a particle at in the final stage of the collision system is obtained by sampling thermal distribution as illustrated in the diagram in Fig. 3(a). In general the histogram of sampled or values for all particles in all events in the event ensemble, , could be like the generic peaked distribution in Fig. 3(b) with mean and standard deviation . The inclusive distribution is then obtained by convoluting thermal distribution with given by
(3)
where is a normalization constant. The
global temperature fluctuation model is recovered when is independent of source coordinate but varies from event-to-event.
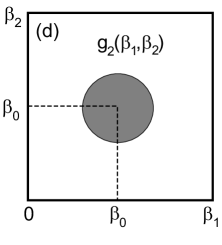
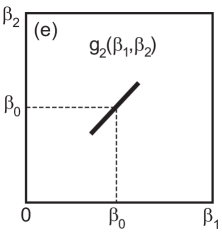
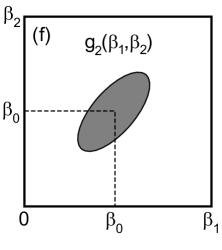
Figure 3:
Diagrams illustrating the temperature fluctuation model. Panel (a): Source coordinates with two final state particles sampling local inverse temperatures and . Panel (b): Distribution of sampled values for all particles in all events of a centrality bin with mean and standard deviation . Panel (c): Thermal model inclusive charged particle yield at mid-rapidity versus with no temperature fluctuations (, solid line) and with temperature fluctuations (, dashed line). Panel (d): 2D distribution, , of sampled pairs and when there are no point-to-point temperature correlations within each source but large temperature variations within each event (non-equilibrium sources). Panel (e): Same as (d) except for global temperature fluctuations where each event is equilibrated but the equilibrium temperature fluctuates from event-to-event. Panel (f): Same as (d) except point-to-point temperature correlations occur within each event as evidenced by the positive covariance of distribution .
In the Monte Carlo model event-wise was obtained by sampling a gaussian distribution. It is therefore reasonable to represent by a peaked distribution which is here assumed to be a gamma distribution tann in order to obtain an analytic solution of the integral in Eq.(3) given by
(4)
a Lévy distribution wilk , where is the relative variance of . The finite width of produces a net increase in the yield at higher as illustrated in Fig. 3(c). We emphasize that any finite-width peaked function results in an distribution which decreases less rapidly with increasing than thermal spectrum e. The assumption of a gamma distribution for is therefore not essential but is used for mathematical convenience and is justified by the capability of the distribution in Eq. (4) to describe the inclusive data. We note however that deviations of the measured distribution from a thermal spectrum, quantified by exponent in the power-law distribution spectra , can result from transverse expansion ssh in addition to local and event-to-event fluctuations in assumed in deriving Eqs. (3) and (4). Consequently, fitting the spectra to obtain the power-law exponent cannot by itself determine the relative variance of the effective temperature distribution, , which is related to the degree of equilibration.
Similarly the two-particle distribution on is obtained by convoluting the two-particle thermal distribution with the 2D distribution of pairs of inverse effective temperature parameters , where particles 1 and 2 sample local thermal distributions determined by and , respectively [see Fig. 3(a)]. The distribution of for all pairs of particles used in all events in the ensemble defines a 2D histogram and 2D distribution, , illustrated in Fig. 3, panels (d)-(f) for three hypothetical cases. If the event ensemble distribution on has finite width (), but are point-to-point uncorrelated within each event, then is symmetric on vs (zero covariance) as shown in Fig. 3(d). For uncorrelated fluctuations or for mixed-event pairs, factorizes as , implying zero covariance. On the other hand, if every event is thermally equilibrated, then each pair of particles from a given event samples the same value of where . For this case (global temperature fluctuation model) limits to a diagonal line distribution illustrated in Fig. 3(e) and given by , where is a Dirac delta-function. In this case has maximum covariance and represents the conventional picture of an ensemble of equilibrated events with event-wise fluctuations in the global temperature. In general may have an intermediate covariance as illustrated in Fig. 3(f). In this case if is expressed as a product of a gamma distribution on the sum direction, multiplied by a gaussian on (for mathematical convenience), then an analytic expression for the two-particle distribution results, given by a 2D Lévy distribution
(5)
on sum and difference variables and . Inverse exponents and are the relative variances of along sum and difference variables and respectively, and is the relative covariance of 2pttemp , measuring velocity/temperature correlations. For the examples in panels (d), (e) and (f) of Fig. 3,
, and , and , respectively. Mixed-event pair distribution , a product of one-dimensional Lévy distributions [Eq. (4)], has the form of Eq. (5) but with .
Ratio
(6)
referred to as a 2D Lévy saddle,
predicts a saddle-shape when has non-zero covariance and is the analytical quantity to be compared to data. It can be tested by comparison to the data in Fig. 1 via chi-square fits. We emphasize for this 2D case that any peaked function with nonzero covariance results in a 2D saddle shape distribution for .
The gamma distribution times gaussian 2D model for was chosen for mathematical convenience but it is reasonable given the form of the measured event-wise distribution. The variance of along the difference direction measures the average degree of equilibration of the events in the ensemble.
Relative variance differences and measure the saddle curvatures of (and hence the data) along sum and difference directions at the origin, and are the quantities best determined by these fits. Sensitivity to the magnitudes of the relative variances and is discussed in the next section.
V Analytical Model Fits
Data in Fig. 1 (excluding peak region ) were fitted with by varying parameters , and (offset). Parameters GeV-1 and were fixed by the (pion dominated) inclusive single-particle spectrum for 1 GeV/. The fits are insensitive to the absolute value of ; its value was fixed as follows.
Parameter when fitted to the single particle spectrum spectra , using an analog of Eq. (4) with replaced by , accounts for the deviation between the measured distribution and e.
In general, both collective
radial expansion velocity ssh and effective temperature
fluctuations contribute to the curvature (decreasing slope) of the
spectrum relative to Boltzmann reference e at increasing shown by
the dashed curve in Fig. 3(c). Both contributions are included in
parameter in Eq.(4), when fitted to the single particle distribution, resulting in an apparent variance,
, given by an incoherent sum of contributions from radial flow,
, and effective temperature fluctations, ,
where . However, for the effective temperature fluctuation model developed in the preceding section only
component is relevant to the 2D Lévy saddle fit but it is not accessible because fits to correlation data () poorly constrain absolute quantities and . However, differences are well determined by the saddle curvatures, nearly independently of the assumed value of in .
The maximum value for corresponds to in the no-flow limit, , where is obtained from the Lévy distribution fit to the single particle spectrum spectra . The minimum value of 0.0009 corresponds to that necessitated by the fitted values of in Table 1 in the limit . The fits were insensitive to variations of in this range, intermediate value near the center of the allowed range provided stable
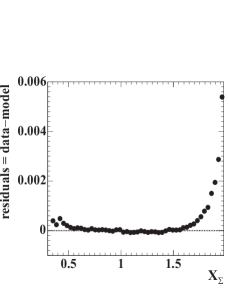
and fit values. Best-fit parameters and /DoF for the saddle fits are listed in Table 1. The model function and residuals for the fit to centrality (b) are shown in Fig. 4.
Figure 4: Left: pair-density net ratio for model fit to mid-central (b) Au-Au collisions. Right: residuals (data model) for mid-central collisions.
Table 1:
Parameters and fitting errors (only) for 2D velocity/temperature fluctuation model for each centrality bin, (a) - (d)
(central - peripheral
as in Fig. 1). Errors (last column) represent
fitting uncertainties. Systematic errors are 7-12% norm .
Mean multiplicities of used particles in the acceptance, , are listed for each centrality bin.
Quantities (last row) are correction factors for contamination and tracking inefficiency meanptprl .
centrality
(d)
(c)
(b)
(a)
error111Range of fitting errors
in percent from peripheral to central.(%)
115.5
424.9
790.2
983.0
-11.6
-0.820
0.787
0.750
6-14
3.54
0.611
0.183
0.118
6-24
-8.61
-3.33
-2.53
-2.04
6-3
12.2
3.95
2.71
2.16
/DoF
1.19
1.22
1.25
1.27
8222Systematic
error.
Two-dimensional saddle-fit residuals, as in Fig. 4 (right panel), are approximately constant along directions parallel to the
axis for each value of
and are small for . The Lévy temperature fluctuation model adequately describes the saddle structure. Residuals from the fit for mid-central events (b) are shown in Fig. 5 (left panel) projected onto sum variable . Errors are included in the data symbols and are smaller than those in Fig. 4 (right panel) due to bin averaging. Residuals for other centralities are similar, but differ in amplitude. We hypothesize that this residual structure is due to correlated final-state hadrons associated with initial-state semi-hard parton scattering jeffp .
Centrality dependences of efficiency-corrected model parameters eff , which determine saddle-shape correlation amplitudes in Fig. 1, are shown in Fig. 5 (right panel). The linear trends suggested by the solid lines are notable. Multiplication by factor estimates correlation amplitudes per final state primary particle as discussed below. Centrality measure
estimates the mean participant path length as the average number of encountered nucleons per participant nucleon in the incident nucleus. For this analysis , based on Glauber-model simulations where
() is the number of participant nucleons (binary collisions).
The reasons for multiplying the parameters in Table 1 by and are the following. Multiplication of by yields the density of correlated pairs per final-state particleaxialcd , typically for all centralities. would be independent of centrality if Au-Au collisions were linear superpositions of p-p collisions (participant scaling) because the amplitude of the numerator of , which is proportional to the density of correlated pairs, would scale with participant number, or in this model with , while the denominator is proportional to . Therefore variation of with centrality directly displays the effects of those aspects of Au-Au collisions which do not follow naïve p-p superposition.
Factor is defined as the ratio of true, primary particle yield (i.e., 100% tracking efficiency and no background contamination) estimated for these data in Ref. spectra divided by the actual multiplicity used in this analysis corrected for the % background contamination. is essentially the reciprocal of the charged-particle tracking efficiency, specific for the present analysis. Multiplication by factor of the parameters in Table 1 therefore estimates the correlation amplitudes per final-state particle for 100% tracking efficiency and no background contamination, assuming the measured correlations include background-primary particle correlations half-way between the limits described in Sec. III.3. The uncertainty in extrapolating to the true primary particle yield is estimated to be 8%, most of which is due to the 7% systematic uncertainty in the measured charged hadron yield spectra . The combined systematic uncertainty for the efficiency corrected amplitudes is from % across the vs space.
Figure 5:
Left: Residuals from 2D Lévy saddle fit to mid-central (b) data in Fig. 1 projected onto sum variable .
Right: Efficiency-corrected per-particle saddle-curvature measures eff on centrality : (dots),
(triangles) and (open circles).
Data symbols include fitting errors only norm .
Solid lines are linear fits.
VI Discussion
Correlations on have two main components, a saddle shape and a peak at higher . By measuring the saddle curvatures we infer the relative covariance of two-point distribution and hence the average two-point correlation amplitude of the temperature/velocity structure of the composite particle source. We now consider possible dynamical origins of that structure.
The analysis of the saddle-shape produces accurate results for relative variance differences , , and the corresponding for effective temperature fluctuations. The measurements do not constrain the absolute magnitudes of the individual variances, and . The minimum possible values, consistent with the saddle-shape conditions and the single-particle spectra, correspond to and , resulting in % to 2.9% global event-to-event temperature/velocity fluctuation from central to peripheral collisions, respectively. In this case and global temperature/velocity fluctuations contribute negligibly to the upward curvature of the spectrum. The maximum values for the variances correspond to , resulting in and %, where , corresponding to 30% local temperature/velocity fluctuations within each event, a significantly non-equilibrated system. Thus, local temperature variation could range between 0 and 30%. One can ask what is the source of the fluctuating effective temperature, and is local source velocity rather than temperature a more appropriate quantity?
Given the correlation peaks at higher it is reasonable to offer the hypothesis that the saddle-shape correlation structure in Fig. 1 results from in-medium modification, specifically momentum dissipation on of a two-particle distribution from fragmenting, semi-hard scattered partons in the initial-stage of the collision. Since no selection was made on leading particle or high- “trigger” particle for these data we refer to the hadrons associated with a semi-hard, initial-state scattered parton as a minijetjetquench ; minijet . Minijet production in Au-Au collisions should increase approximately linearly with raa ; raaother while the subsequent momentum dissipation should monotonically increase with greater minijet production. Correlation amplitudes per final state particle (the latter approximately proportional to ) should therefore increase monotonically with mean participant path length , thus providing a basis for experimental tests of this hypothesis.
The linear trends in Fig. 5 (right panel) therefore support, but do not require, a minijet momentum dissipation mechanism for the observed correlations on .
In Fig. 5 we also observe 1) reduced curvature along the sum direction and 2) increased curvature along the difference direction which may represent respectively transport of semi-hard parton structure to lower and a more correlated bulk medium. Given a minijet interpretation of , the combined trends 1) and 2) represent strong evidence for increased parton dissipation in the more central Au-Au collisions. The present results complement the observed suppression of high- spectra () raa ; raaother and suppression of large angle trigger-particle – associated-particle conditional distributions on backjet ; phenixbackjet in central Au-Au collisions at RHIC. It is very likely that the lower- fluctuations and correlations reported here are, at least in large part, a consequence of the processes which lead to the above suppressions at higher-.
It is important to note that these correlations on transverse momentum observed at relatively low reveal nominally ‘soft’ structure in relativistic heavy ion collisions which scales with the number of binary collisions , whereas a low- inclusive quantity such as multiplicity scales with participant number . Binary-collision scaling is conventionally thought to be an aspect of high- physics and initial-state scattering. This analysis suggests that substantial effects of initial-state parton scattering are manifest at low in more central heavy ion collisions.
VII Summary
In conclusion, the dynamical origins of excess fluctuations
in Au-Au collisions at RHIC are studied in this analysis of two-particle correlations on . The velocity/temperature structure of heavy ion collisions suggested by these correlations is unanticipated by theoretical models jetquench ; rqmd ; ampt . Lacking in these models is the simultaneous inclusion of hard scattering in the initial state with subsequent medium modification of the fragmentation function and/or interactions between the medium and the hadrons associated with the scattered partons. Nevertheless it seems plausible to interpret the observed correlations on as resulting from this sort of semi-hard parton scattering and subsequent medium modified fragmentation and/or associated hadron distributions on in the more central Au-Au collisions. In this picture, with increasing centrality the transverse momentum associated with the two-particle fragment distribution from initial-state semi-hard parton scattering is shifted to lower , asymptotically approaching a form consistent with random velocity/temperature variations (Lévy saddle) as a manifestation of substantial but incomplete equilibration. These newly-observed correlations may thus reveal minijet dissipation in the medium produced by Au-Au collisions at RHIC.
We thank the RHIC Operations Group and RCF at BNL, and the
NERSC Center at LBNL for their support. This work was supported
in part by the Offices of NP and HEP within the U.S. DOE Office
of Science; the U.S. NSF; the BMBF of Germany; IN2P3, RA, RPL, and
EMN of France; EPSRC of the United Kingdom; FAPESP of Brazil;
the Russian Ministry of Science and Technology; the Ministry of
Education and the NNSFC of China; IRP and GA of the Czech Republic,
FOM of the Netherlands, DAE, DST, and CSIR of the Government
of India; Swiss NSF; the Polish State Committee for Scientific
Research; SRDA of Slovakia, and the Korea Sci. & Eng. Foundation.
References
(1) R. Stock, Nucl. Phys. A661 (1999) 282c;
H. Heiselberg, Phys. Rep. 351 (2001) 161.
(2) A. Dumitru, R. Pisarski, Phys. Lett. B504 (2001) 282.
(3) M. Stephanov, K. Rajagopal, E. Shuryak,
Phys. Rev. D 60 (1999) 114028.
(4) C. Adler et al., Phys. Rev. Lett. 90, 082302 (2003).
(5)
S. S. Adler et al. (PHENIX Collaboration), Phys. Rev. Lett. 97, 052301 (2006).
(6) J. Adams et al. (STAR Collaboration), Phys. Rev. C 71 (2005) 064906.
(7) S. S. Adler et al. (PHENIX Collaboration),
Phys. Rev. Lett. 93 (2004) 092301.
(8) H. Appelshäuser et al. (NA49 Collaboration),
Phys. Lett. B459 (1999) 679; D. Adamová et al. (CERES Collaboration), Nucl. Phys. A727 (2003) 97.
(9) X.-N. Wang, M. Gyulassy, Phys. Rev. D 44 (1991) 3501.
(10)
H. Sorge, H. Stöcker, W. Greiner, Nucl. Phys. A498 (1989) 567c;
Ann. Phys. (N.Y.) 192 (1989) 266.
(11)
Z.-W. Lin, C. M. Ko, B.-A. Li, B. Zhang and S. Pal, Phys. Rev. C 72, 064901 (2005).
(12)
C. Adler et al., Phys. Rev. C 66, 034904 (2002).
(13)
C. Adler et al. (STAR Collaboration), Phys. Rev. Lett. 87 (2001) 082301.
(14)
B. Andersson, G. Gustafson, G. Ingelman and T. Sjöstrand, Phys. Rep.
97, 31 (1983).
(15) M. Gaździcki, A. Leonidov, G. Roland, Eur. Phys. J. C6,
365 (1999).
(16) Q. Liu and T. A. Trainor, Phys. Lett. B567, 184 (2003).
(17)
K. H. Ackermann et al., Nucl. Instrum. Meth. A 499 (2003) 624;
see other STAR papers in volume A499.
(18) Related to but not equivalent to the power-law exponent in
C. Adler et al. (STAR Collaboration), Phys. Rev. Lett. 87 (2001)
112303;
ibid.89 (2002) 202301.
(19)
A. Ishihara, Ph. D. Thesis, The University of Texas at Austin (2004)
unpublished.
(20) J. Adams et al. (STAR Collaboration), Phys. Rev. C 73, 064907 (2006).
(21) J. Adams et al. (STAR Collaboration), Phys. Lett. B 634, 347 (2006).
(22)
J. Whitmore, Phys. Rep. 27, 187 (1976);
T. Kafka et al., Phys. Rev. D 16, 1261 (1977).
(23)
Function permits a fully analytic
description of the data in space using the fitting
model in space described in Sec. IV.
Choice
emphasizes the soft part of the spectrum in mapping from to where a temperature model is more appropriate.
(24)
Other mappings are possible. For example, in analysis of transverse jets, transverse rapidity is optimal for comparing longitudinal and transverse fragment distributions;
R. J. Porter and T. A. Trainor (STAR Collaboration), J. Phys. Conf. Ser. 27, 98 (2005).
(25) T. A. Trainor, hep-ph/0001148; the summation in
Eq. (III.1) includes factor relative to that in meanptprl .
(26)
E. U. Condon and H. Odishaw, Handbook of Physics, Second Ed. (McGraw-Hill,
New York, 1967), C. Eisenhart and M. Zelen, Chpt. 12, pgs. 1-177,178.
(27)
The weighted integral of corresponds to
times the second term
in the first line of Eq. (III.1). The event
ensemble average number of mixed-event pairs for that term is
, where is the
variance of the multiplicity distribution, assumed to be Poisson,
such that .
(28)
Two-track merging cuts required average separation distance cm based on two-track separations at nine radial positions in the TPC. Two tracks which cross within the TPC with separations less than 10 cm () and 30 cm (azimuth) at mid-radius from the TPC axis were also excluded.
(29) R. Ray and R. Longacre, nucl-ex/0008009.
(30)
, the half-maximum point at the end of the minimum-bias distribution plotted as , is an estimator on for the maximum number of participants; within 4%.
(31)
J. G. Reid, Ph. D. thesis, Univ. of Washington, nucl-ex/0302001.
(32)
T. Anticic et al. (NA49 Collaboration), Phys. Rev. C 70 (2004) 034902.
(33) R. Hwa and C. Yang, Phys. Rev. C 66, 025205 (2002);
C. B. Chiu and R. C. Hwa, Phys. Rev. C 73, 014903 (2006).
(34) E. Schnedermann, J. Sollfrank and U. Heinz, Phys. Rev. C 48, 2462 (1993); B. Tomášik and U. Heinz, Phys. Rev. C 65, 031902(R) (2002).
(35) Analysis of the measurements presented here cannot distinguish between fluctuating temperature or flow velocity which would require identified particle mass at higher and over the large acceptance of the STAR TPC.
(36) M. J. Tannenbaum, Phys. Lett. B498 (2001) 29.
(37) G. Wilk and Z. Wlodarczyk,
Phys. Rev. Lett. 84 (2000) 2770;
similar to a ‘power-law’ distribution spectra .
(38) In the context of velocity/temperature fluctuations this quantity measures , the relative covariance of velocity/temperature fluctuations.
(39)
Systematic errors for quantities in Fig. 5 (right panel), due to systematic uncertainties in the data (7-12%) plus background and efficiency corrections (8%), are 11-14%.
(40) R. J. Porter and T. A. Trainor (STAR Collaboration),
eprint hep-ph/0406330.
(41)
Multiplication by gives per-particle, rather than per-pair, correlation amplitudes which better reveal non-trivial centrality dependences for A-A collisions relative to an independent nucleon-nucleon collision superposition hypothesis. For the latter case the rescaled correlation amplitudes would be independent of centrality.
(42) X.-N. Wang, Phys. Rev. D 46, R1900 (1992);
X.-N. Wang and M. Gyulassy, Phys. Lett. B 282, 466 (1992).
(43)
J. Adams et al.,
Phys. Rev. Lett. 91, 172302 (2003).
(44)
K. Adcox et al., Phys. Rev. Lett. 88, 022301 (2002); B. B. Back et al., Phys. Rev. Lett. 94, 082304 (2005); I. Arsene et al., Phys. Rev. Lett. 91, 072305 (2003).