Detection of the Natural Alpha Decay of Tungsten
Abstract
The natural -decay of 180W has been unambiguously detected for the first time. The peak is found in a ( and neutron)-free background spectrum. This has been achieved by the simultaneous measurement of phonon and light signals with the CRESST cryogenic detectors. A half-life of T y and an energy release of Q = (2516.4 1.1 (stat.) 1.2 (sys.)) keV have been measured. New limits are also set on the half-lives of the other naturally occurring tungsten isotopes.
pacs:
23.60.+e, 07.20.Mc, 29.40.McI Introduction
The -decay of the naturally occurring isotopes of tungsten (W) has been the subject of experimental search for many decades. Tungsten is an interesting element because -decay is energetically allowed for all five naturally occurring isotopes. Mass excess measurements wapstra show that the available decay energy Q for all these isotopes is low ( MeV) and that the Q values lie in the same energy range as and decay due to natural chains (see Table 1). Therefore background suppression and possibly event-by-event discrimination against ’s and ’s, which may obscure the signal, are crucial issues for the detection of such rare events.
| Isotope | Abundance[] | Q [keV] | ||
|---|---|---|---|---|
| IUPAC IUPAC | Ref.333Considered by the IUPAC (International Union of Pure and Applied Chemistry) to be the best single measurements. Volkening | Ref. wapstra | Ref. wapstra03 | |
| 180W | 0.12(1) | 0.1198(2) | 2516(5) | 2508(4) |
| 182W | 26.50(16) | 26.4985(49) | 1774(3) | 1771.8(2.2) |
| 183W | 14.31(4) | 14.3136(6) | 1682(3) | 1680.0(2.2) |
| 184W | 30.64(2) | 30.6422(13) | 1659(3) | 1656.2(2.2) |
| 186W | 28.43(19) | 28.4259(62) | 1123(7) | 1124(7) |
While 182W,183W,184W, and 186W are expected to have half-lives well above y, the isotope 180W is expected to have a half-life near y, and is close to observability with present techniques. Most recently, the Kiev-Firenze Collaboration, operating CdWO4 scintillation detectors in the Solotvina mine reported a “first indication of a possible -decay of 180W” with a half-life of T years kiev . It is well known birks that the scintillation yield for particles is lower than that for or particles of the same energy. After pulse shape analysis, an -peak at keV was interpreted as 180W -decay. Due to the low energy resolution (FWHM = 110 keV) it was impossible to exclude alternative explanations for the peak, hence the result was treated as an indication. They also set a 90 C.L. lower limit of T years. Also the ROSEBUD collaboration, operating a 54 g CaWO4 scintillating bolometer at the Canfranc Underground Laboratory, obtained a limit of T years at 90 C.L cebrian .
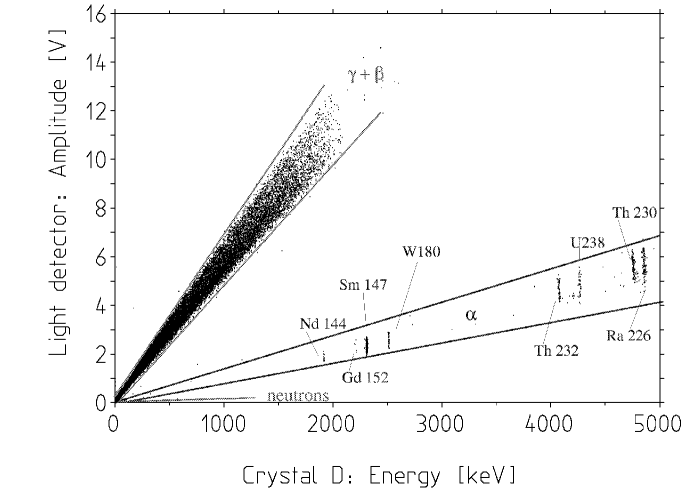
The high sensitivity and excellent energy resolution of low temperature detectors (see for example cresstI ; fiorini ) and the great efforts made to suppress and understand radioactive background in dark matter searches and double beta decay experiments make such apparatus sensitive to rare nuclear decays. For example, the -decay of 209Bi (considered as the heaviest stable isotope) has been recently detected by a French group developing low temperatures bolometers for Dark Matter direct detection marcillac . CRESST (Cryogenic Rare Event Search with Superconducting Thermometers) is a low background cryogenic facility primarily devoted to the direct detection of WIMP dark matter particles via their scattering by nuclei. Such nuclear recoils resulting from WIMP interaction can be discriminated from electron background (caused by photons or electrons) by measuring phonons and scintillation light simultaneously. The energy detected via phonons in a cryogenic detector is, to first order, independent of the nature of the particle. There is, however, a significant difference in scintillation yield for nuclei and electrons of the same energy. The fraction of energy released in the nuclear interaction channel, negligible for photons and electrons, becomes important for ’s and heavy ions and is dominant for WIMPs and neutrons. As a result WIMP and neutron induced recoils give considerably less scintillation light than electrons of the same energy while particles can be clearly discriminated since they interact partly with both, nuclei and electrons. This results in a pure spectrum, i.e. one without contributions from and neutron events as in the middle band of Fig. 1. Finally we remark that the energy measured following an internal -decay in a cryogenic detector corresponds to the sum of the energies of the particle and of the recoiling nucleus, i.e. the total decay energy Q.
In this paper we present clear evidence for the -decay of 180W from early runs of the CRESST II dark matter detectors, originating from the tungsten in the CaWO4 crystals used as the dark matter target.
II Experimental set-up
CRESST is an ultra-low background facility operating at the Gran Sasso underground laboratories. Detailed descriptions can be found in cresstI ; cresstII . CRESST has developed very sensitive cryogenic detectors consisting of a dielectric target crystal with a superconducting phase transition thermometer (SPT) evaporated onto one surface. Particle interactions in a cryogenic detector produce phonons which propagate to the surface, where they heat the electron system in the SPTs. These thermometers, biased in the middle of their superconducting-to-normal transition near a temperature of 10 milli-kelvin, transform the temperature rise of their electrons into a relatively large increase of the resistance of the film. The resistance change of the low impedance thermometer is then measured via a SQUID. The resistance increase is a measure for the energy deposited.
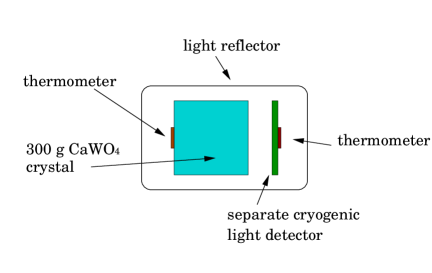
The set-up for the simultaneous detection of scintillation light and phonons is described in cresstII and shown schematically in Fig. 2 for one absorber module. It consists of two independent detectors, each one with its own SPT with SQUID readout. The main detector consists of a g cylindrical CaWO4 crystal ( mm, mm). CaWO4 is a well known scintillator with high light yield and very broad emission spectrum peaked at 420 nm. It is characterized by a high index of refraction (n = 1.92) and a decay time of 17 s at 77 K. The scintillation light produced in each target crystal is detected via an associated calorimeter consisting of a silicon wafer of (30 mm3 volume with a 20 nm thick SiO2 layer on both surfaces. In CaWO4 only a few percent of the absorbed energy is transformed into light. To minimise light losses the whole module is thus enclosed in a highly reflective foil.
In the data to be presented here, three different CaWO4 crystals (referred to as crystal B, D and E) were used in the Gran Sasso set-up for a total of four different CRESST runs (22, 23, 27, 28). For detector operation, the temperature of the thermometer is controlled by a dedicated heater. Additionally the heater is used to inject test pulses which monitor the long term stability of the detector cresstII . In particular, in the runs 27 and 28 a large voltage pulse was produced, reaching the saturation region of the superconducting transition specifically to monitor the detector response above 1 MeV. This pulse was sent, at a rate of 0.5 Hz, throughout the measuring period. A record length of 4096 samples and a time base of 40 s, resulting in a time window of 164 ms for recording an event, was chosen for all the runs presented.
III Off line analysis
CRESST detectors are optimised to be most sensitive in the energy region relevant for dark matter direct detection (200 keV). In this energy range the detector response is mapped out with electric heater test pulses, and the 122 keV line from a 57Co source provides the calibration of the test pulses in terms of a equivalent energy cresstI . A pulse shape template is obtained by averaging pulses from the 122 keV line. This template is used in a fit to the actual signal pulses in order to accurately determine the signal amplitude. This is valid as long as the detector response is in a linear regime. If the response becomes non-linear the pulse shape changes and the same template cannot be used over the full energy range.
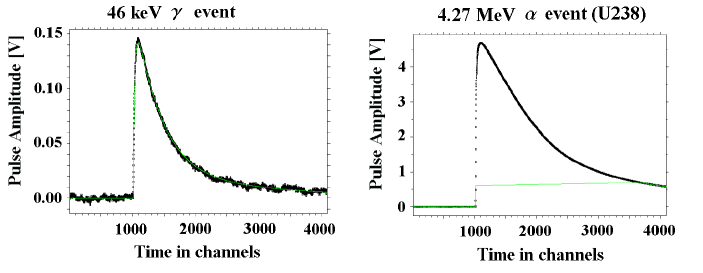
Typically, the pulse shape for the CaWO4 detectors can be described by = 1.1 ms and = 30 ms. However, the temperature rise caused by -decays is usually beyond the dynamic range of the SPT and for precise energy determination the signal duration rather than the pulse height must be used. Therefore two new analysis methods, described in methods , were developed in order to reconstruct the higher energies (MeV region), for which the detector response is non-linear.
In the first method (Method A) a template from pulses in the linear region (for example the 122 keV template from the calibration) is used to fit all measured pulses with an amplitude below the voltage at which the response becomes non-linear. For all pulses with an amplitude exceeding that voltage the fit is truncated and the upper part is reconstructed from the template. This is shown in Fig. 3. The resulting amplitude spectrum is then linear by construction.
If the pulse duration is too long the information from the decaying part of the pulse is outside the recording time window and the method fails. To overcome this limitation a second method was developed (Method B). The template from the linear region is fitted with a function following the model described in proebst . This assumes an exponential rise and two exponential decay components. Once the parameters of the model function are determined for the linear region, a mathematical description of the changes in pulse shape in the non-linear range is needed. At higher energies the pulse shape varies according to the non-linearities of the superconducting phase transition. These changes can be described via successive approximation to the model function. The higher order correction coefficients are extracted by fitting templates of different energies up to 2.31 MeV (see methods ), enabling the energy spectrum to be reconstructed up to the highest recorded -signal ( cascade at 15 MeV).
IV Background
Due to the powerful discrimination technique CRESST II detectors offer, contaminations from natural decay chains and other -unstable isotopes have been identified by their -decays with a sensitivity of Bq/kg. The results of this analysis have shown very good agreement with the results obtained using different techniques commonly employed to determine the presence of impurities in crystals. These include ICPMS444Gran Sasso Laboratory and Durham University durham (Inductively Coupled Plasma Mass Spectrometry), HPGe555 Modane Underground Laboratory and Gran Sasso Underground Laboratory arpesella (High Purity Germanium -spectroscopy) and X-ray luminescence666Durham University Vitalii techniques.
| Crystal B | Crystal E | ||||
| semi- | semi- | ||||
| quantitative | quantitative | quantitative | |||
| analysis | analysis | analysis | |||
| Natural | Sample I | Sample II | Sample I | Sample II | |
| Element | [ppb] | [ppb] | [ppb] | [ppb] | [ppb] |
| Nd | 555 167 | 773 232 | 683 137 | 994 199 | 1100 330 |
| Sm | 22 | 11 3.3 | 9 2 | 13 3 | 6 |
| Eu | 8 | 4 1.2 | 4 1 | 5 1 | 2 |
| Gd | 2898 869 | 4084 1225 | 1000 300 | ||
| Er | 1328 398 | 1877 566 | 940 283 | ||
| Dy | 15 | 3 | 3 | ||
| Hf | 22 | 3 | |||
| Os | 29 | 4 | |||
Evidence for contaminations due to -unstable rare earth elements has been found in all the measured detectors. Rare earth doped crystals are commonly produced for laser applications, therefore these impurities are likely to have been introduced during the production of the crystals. In particular an peak at 2.31 MeV has been detected and identified as the -decay of 147Sm. This isotope is naturally occurring with 15 isotopic abundance and is known to be a pure unstable radionuclide with T years. The intensity of this peak varies for the different detectors, implying different levels of contamination in each crystal. Crystal B showed a count rate of (1.7 0.1) counts/h which translates into (13 1) ppb of natural samarium in the crystal. The rate on the same peak measured with crystal E corresponds to a contamination of (5.5 0.4) ppb of natural samarium.
ICPMS analyses were performed in the Gran Sasso facility on crystals B and E giving results, shown in Table 2, in agreement with our analysis of the -peak intensities. Evidence of 144Nd (Q = 1905.1 keV, isotopic abundance (i.a.) = 23.8, T y) and 152Gd (Q = 2205 keV, i.a. = 0.2, T y) isotope -decay has also been observed and the results are in accordance with the ICPMS analysis. Furthermore, X-ray luminescence analysis on crystal B showed the presence of the characteristic emission peak of Gd and Er ninkovic , the two most abundant rare earth contaminants (see Table 2).
Finally, alternative candidates such as 174Hf (Q =2496 keV, i.a. = 0.162, T y) and 186Os (Q = 2822 keV, i.a. = 1.58, T y)isotope were considered to cause the 2.31 MeV peak. They were discarded, however, due to the unreasonably high atomic concentration needed to produce the detected rate.
V Calibration

Once unambiguously identified, 147Sm was used to calibrate the full spectrum. This allowed a precise identification of the U-Th peaks, which were then used to determine the accuracy of the calibration for both reconstruction methods A and B. In Fig. 4 the linearity of the response functions for method A (top left figure) and method B (top right figure) is shown for the data of run 28. On the x-axis the central values of the tabulated energies wapstra of the 147Sm (Q= 2310.5 1.1 keV), 232Th (Q= 4082.8 1.4 keV) and 238U (Q= 4270 3 keV) peaks are given. On the y-axis their fitted peak position is plotted. The energy scale for the y-axis is fixed on the 147Sm peak at 2310.5 keV while the position of the 232Th and 238U peaks results from a simple linear extrapolation of the calibration. At the bottom of the figure the residuals of the fitted position with respect to the expected position are shown. The calibration of the amplitude spectrum resulting from method A is much more accurate, but less information can be used to reconstruct the signal amplitude compared with method B. This results in a slightly worse energy resolution E = (12.9 0.3) keV (FWHM) on the 147Sm peak, and it fails to completely reconstruct the higher part of the U-Th -spectrum. Method B, on the other hand, using a larger amount of information from the pulses than method A, gives a much better resolution (E = (6.7 0.1) keV (FWHM) on the 147Sm peak), but the approximation of the pulse shape description introduces a higher systematic error on the linear extrapolation of the calibration. In the following, method B has been used to fully reconstruct and identify the entire spectrum, while method A was applied as an independent check on the peak position of the 180W evidence. In particular, method A is used to extract the measured energy for the 180W Q-value.
VI Results
Crystal D showed the best performance as a detector (energy resolution: E = 1.8 keV (FWHM) for 122 keV gammas, and E =(6.7 0.1) keV for 2.31 MeV alphas, using method B) and it has the longest exposure (11.745 kg days in run 27 and 12.268 kg days in run 28). In run 28 the performance of the module was improved by replacing the Ag reflective foil used in run 27, which showed a 210Pb contamination, by a highly reflective (99 at 420 nm) scintillating polymeric foil. It is these data which we discuss in full detail. A peak was observed at 2512.8 0.4 (stat.) 4.3 (sys.) keV with a resolution E = (6.5 0.7) keV (FWHM). This is shown in Fig. 5.

The position in energy obtained by reconstructing the spectrum with method A is (2516.5 1.4) keV. A half-life T y is obtained. This is consistent with the value from run 27 on the same crystal and on crystals B and E, as shown in Table 3. The consistency of the results from different crystals tends to confirm that the signal originates from the 180W decay and not from unknown impurities which may be expected to vary for each individual crystal, as seen in Section 4. Furthermore ICPMS measurements performed on these two crystals reported in Table 2 exclude alternative explanations for the tungsten peak, such as 174Hf.
| Crystal | Run | Exposure | Number | Half-life |
| number | [kg days] | of counts | [y] | |
| D | 28 | 12.268 | 35 4.3 | T |
| D | 27 | 11.745 | 28.5 5.6 | T |
| E | 23 | 3.467 | 9 | T (90 C.L.) |
| B | 22 | 1.14 | 4 | T (90 C.L.) |
| All Crystals | 28.62 | 75.58.7 | T | |
Finally, the four measurements were added, resulting in a spectrum for a total exposure of 28.62 kg days. The data from each run have been analysed with method A, calibrated individually and then summed. This results in half-life of Ty, which is consistent with the previously published limits. Including the uncertainty on the position of the 147Sm line, a peak of energy (2516.4 1.1 (stat.) 1.2 (sys.)) keV is found with a resolution E = (18 2) keV (FWHM), as shown in Fig. 6. This result is consistent with expectations based on the mass difference of 180W and 176Hf from Ref.wapstra , but lies 2 away from the latest update wapstra03 (see Table 1). We note however that most of the input data used to evaluate the atomic masses consist of relative measurements which set a relation in mass or energy among two or more nuclei. In the diagram showing the relations among input data (Fig 1 of Ref.wapstra03 ), 180W and 176Hf are only weakly connected and an underestimation of the errors is plausible. Our result represents the missing direct connection between 180W and 176Hf.

Limits on the half-lives for the non-observed -decays of the other four naturally occurring tungsten isotopes were also calculated. For this purpose the data from run 27 could not be used. In that run, a Ag foil was used to surround the crystal, while in the other three runs the scintillating polymeric foil was used. Any contamination of -unstable isotopes, such as 210Po on the surface of the foil or on the crystal may results in events of degraded energy from the U-Th chain energy, going down to 100 keV. These were observed in run 27 with a rate of 0.087 counts/100keV/kg/day both between 500 keV and the 144 Nd peak at 1.9 MeV, and between the 180W and the 232Th peaks. The polymeric foil used in all the other runs did not show any surface contamination. Furthermore if the scintillating side of the foil faces directly the crystal, as in run 28, it efficiently vetoes all the surface events due to the light emitted by the polymeric foil itself. The limits obtained from the sum of runs 22, 23 and 28 are reported in Table 4.
| Isotope | Half-life [y] | ||
|---|---|---|---|
| This work | Previous kiev | Previous cebrian | |
| 182W | T | ||
| 183W | T | ||
| 184W | T | ||
| 186W | T | ||
VII Conclusions
We have observed the natural -decay of 180W with a half-life of Ty and a Q-value of (2516.4 1.1 (stat.) 1.2 (sys.)) keV. In addition, the lack of any signal from the other tungsten isotopes sets new limits on their half-lives. These results offer an improvement of roughly a factor of 50 over the best previously published limits. Finally we would like to note the power and potential of this cryogenic technique, which here enabled us to achieve a very high sensitivity in an application to nuclear physics.
Acknowledgements
We would like to thank S. Nisi and M. Balata for the ICPMS measurements and M. Laubenstein for the spectroscopy analysis at the Gran Sasso Laboratories. Thanks also to C. Goldbach for the Ge measurements at Modane and to the University of Durham for the ICPMS and X-ray luminescence analysis. This work was supported by PPARC, BMBF, the EU Network HPRN-CT-2002-00322 on Applied Cryodetectors, the EU Network on Cryogenic Detectors (contract ERBFMRXCT980167), the DFG SFB 375 on Particle Astrophysics and two EU Marie Curie Fellowships.
References
- (1) G. Audi and A. H. Wapstra, Nuclear Physics A 595 (1995) 409-480.
- (2) A. H. Wapstra G. Audi and C. Thibault, Nuclear Physics A 729 (2003) 129-676.
- (3) K. J. R. Rosman and P. D. P. Taylor, Pure and Applied Chemistry 70 (1998) 217.
- (4) J. Völkening, M. Köppe and K. G. Heumann, International Journal of Mass Spectrometry and Ion Processes, 107 (1991) 361.
- (5) F. A. Danevich et al., Physical Review C 67 (2003) 014310.
- (6) J. B. Birks, Theory and Practice of Scintillation Counting (1967), Pergamon, New York.
- (7) S. Cebrian et al., Physics Letters B 556 (2003) 14-20.
- (8) G. Angloher et al., Astroparticle Physics 18 (2002) 43-55.
- (9) G. Angloher et al., submitted to Astroparticle Physics, astro-ph/0408006.
- (10) C. Arnaboldi et al., Astroparticle Physics 20 (2003) 91-110.
- (11) P. de Marcillac, N. Coron, G. Dambier, J. Leblanc, J. Moalic, Nature 422 (2003) 876.
- (12) F. Pröbst et al., to be submitted.
- (13) C.J.Ottley, D.G. Pearson and G.J. Irvine in Plasma Source Mass Spectrometry: Applications and Emerging Technologies, edited by J G Holland and S D Tanner, Royal Society of Chemistry, Cambridge (2003) 221-230.
- (14) C. Arpesella, Nucl. Phys. B (Proc. Suppl.) 28 A (1992) 420.
- (15) V. B. Mikhailik, I. K. Bailiff, H. Kraus, P. A. Rodnyi and J. Ninkovic, Radiation Measurements 38 (2004) 585-588.
- (16) F. Pröbst et al., J. Low Temp. Phys. 100 (1995) 69.
- (17) J. Ninkovic et al., submitted to Nucl. Instrum. and Methods A Proceedings of the SCINT 2003 conference.
- (18) Table of Isotopes, edited by R. B. Firestone et al., 8th ed. (1996) Wiley, New York.