The NIMROD collaboration
Tracing the Evolution of Temperature in Near Fermi Energy Heavy Ion Collisions
Abstract
The kinetic energy variation of emitted light clusters has been employed as a clock to explore the time evolution of the temperature for thermalizing composite systems produced in the reactions of 26A, 35A and 47A MeV 64Zn with 58Ni, 92Mo and 197Au. For each system investigated, the double isotope ratio temperature curve exhibits a high maximum apparent temperature, in the range of 10-25 MeV, at high ejectile velocity. These maximum values increase with increasing projectile energy and decrease with increasing target mass. The time at which the maximum in the temperature curve is reached ranges from 80 to 130 fm/c after contact. For each different target, the subsequent cooling curves for all three projectile energies are quite similar. Temperatures comparable to those of limiting temperature systematics are reached 30 to 40 fm/c after the times corresponding to the maxima, at a time when AMD-V transport model calculations predict entry into the final evaporative or fragmentation stage of de-excitation of the hot composite systems. Evidence for the establishment of thermal and chemical equilibrium is discussed.
pacs:
25.70.Pq, 24.60.Ky, 05.70.JkI Introduction
The light particle emission which occurs during violent collisions of two heavy nuclei carries essential information on the early dynamics and on the degree of equilibration at each stage of the reaction. To obtain more specific information on the reaction dynamics and on the thermal evolution of multi-fragmenting systems produced in near Fermi energy collisions suraud89 ; tamain96 ; chomaz01 , we have recently focused on efforts to investigate the nucleon and light cluster emission which occurs prior to disassembly as the system thermalizes and equilibrates. In some previous works, we have employed coalescence model analyses to probe the early dynamic evolution of the reacting system cibor00 ; hagel00 . In this paper, we report on the use of similar techniques to explore the temperature evolution of hot nuclei produced in a series of reactions of 26A, 35A and 47A MeV 64Zn projectiles with 58Ni, 92Mo and 197Au target nuclei using a combined 4 Charged Particle – 4 Neutron Ball detection system. The data provide experimental evidence for an initial rapid thermalization of the incident energy, into a participant matter subsystem. The double isotope ratio temperature first rises to a maximum, then decreases as further particle emission, expansion and diffusion of the excitation energy into the remainder of the composite system occurs. A close correlation between the peak temperatures and spectral slope temperatures for early emitted particles is also observed, suggesting local chemical and thermal equilibration for this early emitting system. Temperatures which are comparable to those of limiting temperature systematics natowitz02_1 are reached about 30 to 40 fm/c after the peak temperatures are observed.
II Experimental Details
The reactions of 26A, 35A and 47A MeV 64Zn projectiles with 58Ni, 92Mo and 197Au target nuclei were studied at the K-500 Super-Conducting Cyclotron at Texas A&M University, using the 4 detector array NIMROD. NIMROD consists of a 166 segment charged particle array set inside a neutron ball. The charged particle array is arranged in 12 concentric rings around the beam axis. The eight forward rings have the same geometrical design as the INDRA detector, but have less granularity pouthas95 . In those rings, the individual segments are fronted by ionization chambers (IC) filled with 30 Torr of CF4 gas. Front and back windows were made of 2.0 m aluminized Mylar foil. In each of these forward rings, two of the segments have two Si detectors( 150 and 500 m thick) between the IC and CsI detectors (super telescopes) and three have one Si detector(300 m thick). Each super telescope is further divided into two sections. The CsI detectors are 10 cm thick Tl doped crystals read by photomultiplier tubes. For these detectors, a pulse shape discrimination method is employed to identify light particles bernachi89 . In all telescopes particles are, identified in atomic number. In the super telescopes, all isotopes with atomic number Z 10 are clearly identified.
The energy calibration of the Si detectors was carried out using both a 228Th alpha particle source and the observed punch through energies of identified reaction products. The punch through energies were calculated using a range-energy table hubert80 . Since the energy losses of the lighter particles, in particular the high energy Hydrogen isotopes, are rather small in the Si detectors, evaluation of the energy deposited in the CsI crystal from the energy loss in the Si detectors requires special care for higher energy particles. Therefore, an additional energy calibration was performed to measure energy spectra from the reaction 64Zn + 92Mo at 47A MeV. In this run, Si detectors of thicknesses 1mm, backed by CsI detectors of three different lengths (1cm, 3cm and 5cm), were used to measure the inclusive energy spectra of light charged particles. The energy spectra were measured at all angles corresponding to those of the 12 rings of NIMROD. The combination of thicker Si E detectors and observation of high energy punch-through points for the particles which traversed these thinner CsI detectors allowed us to determine the energy spectra with a high degree of confidence. We then used the 64Zn + 92Mo at 47A MeV as a standard reaction to determine the CsI energy calibrations for all other runs.
Neutron multiplicity was measured with the 4 neutron detector surrounding the charged particle array. This detector, a neutron calorimeter filled with Gadolinium doped pseudocumene, consists of two hemispherical end caps and a cylindrical mid-section. The mid-section is divided into four separate 90 degree quadrants. The hemispheres are 150cm in diameter with beam pipe holes in the center and they are upstream and downstream of the charged particle array. Thermalization and capture of emitted neutrons in the ball leads to scintillation which is observed with phototubes providing event by event determinations of neutron multiplicity but little information on neutron energies and angular distributions. Further details on the detection system, energy calibrations and neutron ball efficiency may be found in reference wada04 .
During the experiment, data were taken employing two different trigger modes. One was a minimum bias trigger in which at least one of the CsI detectors detected a particle. The other was a high multiplicity trigger which required detected particles in 3-5 CsI detectors (depending upon the reaction studied).
III Data Analysis
An inspection of the two dimensional arrays depicting the detected correlation between charged particle multiplicity and neutron multiplicity in NIMROD (not shown), reveals a distinct correlation in which increasing charged particle multiplicity is associated with increasing neutron multiplicity. Although there are significant fluctuations reflecting both the competition between different decay modes and the neutron detection efficiencies, these correlations provide a means for selecting the more violent collisions. For the analysis reported in this paper, we have selected events corresponding to the largest observed neutron and charged particle multiplicities. This selection corresponds to the 10% of the minimum bias trigger events with the highest total multiplicity and emphasizes the lower impact parameter collisions. We refer to these events as violent collisions. Many of the techniques applied in this analysis have been discussed previously in greater detail in references cibor00 ; hagel00 ; cibor01 . Only a brief summary of these is included in the present work.
III.1 Moving source analysis
A common technique to characterize light particle emission in this energy range is to fit the observed spectra assuming contributions from three sources; a projectile-like (PLF)source, an intermediate velocity (IV)source and a target-like (TLF)source. For asymmetric collisions, such fits typically exhibit a PLF source dominance localized at high rapidity, an IV source dominance at mid-rapidity and TLF source emission localized at low rapidity cibor00 ; hagel00 ; awes81 ; wada89 ; viola99 . In the present work, except for the most forward detector rings, the data are dominated by particles associated with the IV and TLF sources and a good reproduction of the observed spectra is achieved. In this analysis, the source velocities, temperatures, particle multiplicities and emission barriers for the three different sources were the parameters searched.
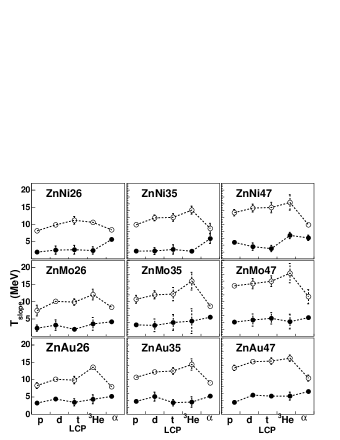
In Figure 1, the slope temperature parameters for emission from the IV and TLF sources, derived from the fits, are shown for the nine reactions studied. For both sources the measured spectra result from a summation of the spectra of particles emitted over a range of time. Thus the observed slope temperature values are affected by the relative emission probabilities over that time period. The IV source slope temperatures for p, d, t, 3He and 4He range from T to 17 MeV for the
different systems studied. The temperatures from the particles with A 3 are quite similar. They follow the trends of earlier reported values for pre-equilibrium emission at such projectile energies awes81 ; wada89 ; fox88 . The IV source temperatures derived from the alpha spectra are typically lower than those measured for the other particles. These softer slopes for the alpha particles appear to reflect larger relative contribution of lower energy alphas which are attributed to the IV source in the fitting procedure. The slope parameters for the TLF sources are much lower, in the range of T MeV. For this source, the apparent temperatures for alpha emission are the highest. Such an effect has previously been noted and attributed to the relatively higher emission probabilities for alpha particles in the early stage of the evaporation cascade hagel88 ; gonin90 .
III.2 Temperature Determinations
Given the continuous dynamic evolution of the system, source fit parameters should be considered as providing only a schematic picture of the emission process. Nevertheless, the information derived can be very instructive. We have employed such analyses to estimate the multiplicities and energy removed at various stages of the reaction. To follow the time evolution of the system in more detail, a more sophisticated analysis of the particle emission is necessary. Both theoretical models lukasik93 ; ono99 and experiments he98 ; gelderlos95 indicate that the early collision dynamics leads to a correlation between emission time and energy for the early emitted particles. This correlation can be exploited to follow the time evolution of the system. We have previously used this correlation in coalescence model studies of several systems cibor00 ; hagel00 ; cibor01 . For the present systems, extensive calculations have been made employing the AMD-V model of Ono ono99 . Many of the results of the AMD-V calculations for the present systems are compared to experimental observables in reference wada04 . In the present work, we have employed the calculated correlation between particle energy and time predicted by those AMD-V calculations to calibrate the emission time scales for these reaction systems.
At intermediate energies, the observed spectral slope parameters derived from the source fits are not adequate as measures of the temperature evolution, as the observed spectra are convolutions of the spectra at different emission times and excitation energies and include high energy particles which are emitted prior to the achievement of thermal equilibrium. For a system at chemical and thermal equilibrium at a suitably low density, Albergo et al. albergo85 have shown that the temperature of the emitting system can be derived directly from the first chance emission
double isotope yield ratios of two adjacent isotopes of two different elements. In a more recent work by Kolomiets et al. kolomiets97 , essentially the same result is derived when only thermal equilibrium is initially assumed. Therefore, to characterize the temperature at a particular emission time, we have employed double isotope yield ratio measurements. In the case of strong system evolution, double isotope yield ratio temperatures derived from integrated yields are certainly suspect if the isotopes being utilized are in fact produced at very different times or by different mechanisms. However, if chemical equilibrium is achieved and the particles corresponding to particular emission times can be selected, derivations of double isotope yield ratio temperatures as a function of emission time should allow us to follow the temperature evolution of the system.
To focus on the early evolution of the temperature, we have first selected clusters observed at mid-rapidity, i.e., specifically those detected at angles between 70o and 80o in the IV source frame. In this way, we attempt to isolate the emission associated with the IV source which occurs during the thermalization stage of the reaction cibor00 ; hagel00 ; cibor01 . We have then made double isotope ratio temperature determinations as a function of ejectile velocity in the IV frame. The velocities used are the “surface velocities” of the emitted particles. The surface velocity, , is defined as the velocity of an emitted species at the nuclear surface, prior to acceleration in the Coulomb field awes81 ; hagel00 . , is obtained in our analysis by subtraction of the Coulomb barrier energy derived from the source fits. Since the early emitted light particle energies are strongly correlated with emission times, and evaporative or secondary emission contribute to the spectra primarily at the lower kinetic energies, the yields of higher energy particles should be relatively uncontaminated by later emission processes. This is an important advantage in such double isotope yield ratio determinations. At mid-rapidity there is little contribution from the PLF source. There is, however some observed contribution from the TLF source at low velocities in the IV source frame. Since the three source fits are only approximations to the emission from the continuously evolving system, particles in this low velocity range may be viewed alternatively as the last particles emitted from the IV source or the earliest from the TLF source. In the following analysis yields assigned to the TLF source have been subtracted from the experimental yields.
The temperatures employed are THHe, derived from the yields of d, t, 3He and 4He clusters. For particles emitted from a single source of temperature, T, and having a volume Maxwellian spectrum (), where is the particle energy, the HHe double isotope yield ratio evaluated for particles of equal , is times the ratio derived from either the integrated particle yields or the yields at a given energy above the barrier albergo85 . Thus
| (1) |
where the constants 14.3 and 1.59 reflect binding energy, spin, masses and mass differences of the ejectiles. If Y represents a cluster yield, for clusters with the same surface velocity.
III.3 Calibration of Timescales
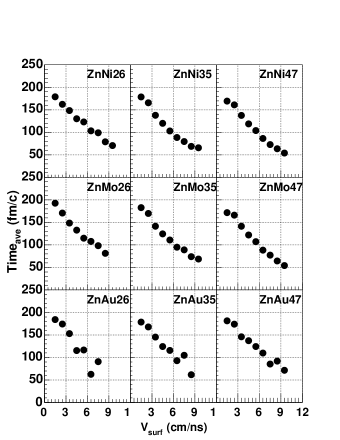
To calibrate the time-scale associated with our data,we have employed results of the AMD-V calculations wada04 . In the AMD-V calculations, the particle emission starts at times near 50 fm/c, and varies depending on projectile velocity and entrance channel masses. From that point, the calculations predict an initial rapid decrease of the average kinetic energies of the emitted particles with increasing time of emission. This is followed by a much slower rate of decrease at later times, 140 to 200 fm/c for the systems studied. The time of the transition from rapid to relatively slow kinetic energy depends on projectile velocity and entrance channel mass. Such trends are typically observed in transport model calculations. For the four systems studied, we have derived from AMD-V calculations, which covered the range of time from the time of contact up to to 300 fm/c, the correlation between average emission times of emitted neutrons and protons and their energies. For each reaction the resultant time-surface velocity relationship is represented in Figure 2. As is seen there, the calculations indicate a near linear decrease of Vsurf , from near projectile velocity into the 3 to 3.5 cm/ns range as the average emission times increase from fm/c to 150 fm/c. In the following we have employed these correlations to determine the average emission times corresponding to particular observed values of Vsurf in the experiment. However, since below 3.5 cm/ns the experimental data contain large contributions from TLF evaporative emission, the sensitivity of the emission energy to time is significantly reduced, and we do not attempt to assign emission times for particles with surface velocities below 3.5 cm/ns.
IV Results and Discussion
We present, in Figure 3, experimental results for the double isotope ratio temperatures as a function of velocity in the IV frame. For each system investigated, the double isotope ratio temperature determination exhibits a high maximum temperature in the range of 10-27 MeV. These maximum temperatures are much higher than the limiting temperatures determined from caloric curve measurements in similar reactions natowitz02_1 . In each case, the apparent temperature decreases monotonically on either side of this maximum. The AMD-V model calculations ono99 ; wada04 indicate a significant slowing in the rate of kinetic energy change in the 3-3.5 cm/ns velocity range. The shaded vertical bars in Figure 3 indicate that velocity value. These points signal the end of the IV (or pre- equilibrium) emission stages. At lower velocities, the slower nuclear de-excitation modes evaporation, fission and/or fragmentation determine the properties of the ejectile spectra. At these lower velocities, values of THHe are 3 to 4 MeV, similar to those spectral integrated values seen in other experiments kolomiets97 ; xi98_1 ; xi98_2 ; viola04 ; wada97 . These values are also very similar to THHe temperatures calculated when the sequential evaporation code GEMINI charity88 is used to simulate the de-excitation of the TLF source hagel88 . We take this as further evidence that the spectra at these lower velocities still contain contributions from late stage evaporation. Temperatures derived from the yield ratios in this velocity range require corrections for secondary decay effects.
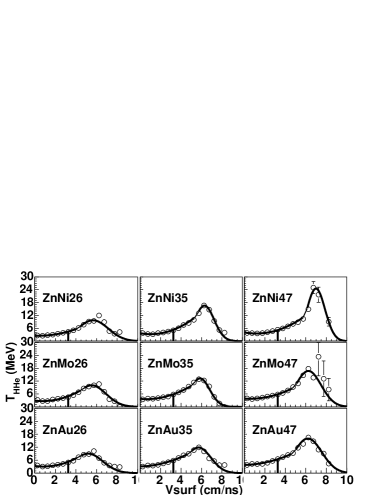
Figure 4 presents the derived THHe temperatures as a function of time. While all nine reactions show a qualitatively similar evolution with time, we now see that, for each energy, the time at which the maximum in the temperature curve is reached increases with increasing target mass and decreases with increasing projectile energy. The former observation suggests a longer period required for establishment of a thermal and/or chemical equilibrium as the total system size increases while the latter observation suggests a more rapid thermalization of the initial projectile energy for the initially faster projectiles. The dynamic transport calculations indicate that the condition of thermal equilibrium of the whole system is not yet established as the earliest ejectiles are emitted. Non equilibrium effects may be most evident in the particularly high apparent peak temperatures for the 35A and 47A MeV 64Zn + 58Ni case. The AMD-V calculations for the different systems predict a higher degree of transparency in those reactionswada04 .
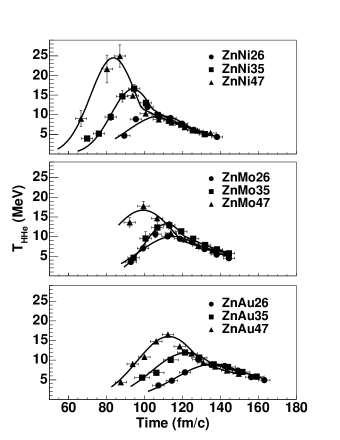
Figure 4 also indicates that the time of entry into the evaporation or disassembly stage, taken to be the time corresponding to surface velocities of 3.5 cm/ns, increases with target mass, from fm/c for the Ni target to fm/c for the Au target. We note that at such times the temperatures are very similar to the limiting temperatures derived from a systematic investigation of caloric curve measurements natowitz02_1 . Except for the 64Zn + 58Ni reactions at 35A and 47A MeV, the time for the initial cooling stage, i.e., the time difference between that corresponding to the maximum in the temperature and that corresponding to the start of the evaporation stage, is 30 to 40 fm/c.
IV.1 Interpretation of Temperature Evolution Curves
The experimental temperature curves show an initial rise to a maximum and a subsequent decline. It is tempting to interpret the initial rise as reflecting the early rate of conversion of projectile kinetic energy into thermal energy of the composite system. However, it appears more likely that the double isotope temperature is not accurately reflecting the temperature of the emitting system at earlier times. The time required for the establishment of chemical equilibrium is presumably longer than that required for thermalization. We are not able to separate these with the present data. Rather, in this section we address the interpretation of the temperatures and the degree to which they can be taken as reflecting thermal and chemical equilibration, at least locally if not globally.
IV.2 Comparison of THHe with Tslope from source fits
If both thermal and chemical equilibrium are achieved and the density is not too high majka97 , an agreement between the thermal temperature and the double isotope ratio temperature THHe can be expected.
For the TLF source the fit slope parameters, Tslope presented in Figure 1 are normally lower than the latest time THHe temperatures seen in Figure 4. This is not surprising since the source fit can be expected to return only an apparent temperature reflecting the entire cooling stage of the TLF source. In our previous work hagel88 ; gonin90 ; wada89 , we have found that the slope parameters for the alpha particle emission from the TLF source most closely approximates the intial thermal temperature of this source, reflecting the higher fraction of the alpha emission in the earlier part of the de-excitation cascade. The alpha particle slope parameters are presented in column 5 of Table I. The relationship between these thermal fit apparent temperatures and the late time chemical temperatures obtained from the TLF isotope ratio temperatures, as presented in column 6, is quite reasonable, given the associated uncertainties.
| Target | Projectile | T | Max THHe | Tslope(TLF) | THHe(TLF) | E | Tmax |
| Energy | IV | alpha | (cm/ns) | Apart=Atot | |||
| (MeV/u) | (MeV) | (MeV) | (MeV) | (MeV) | (MeV/u) | (MeV) | |
| 58Ni | 26.0 | 5.92 | 9.49 | ||||
| 35.0 | 8.17 | 11.1 | |||||
| 47.0 | 11.2 | 13.0 | |||||
| 92Mo | 26.0 | 5.55 | 9.19 | ||||
| 35.0 | 7.73 | 10.8 | |||||
| 47.0 | 10.6 | 12.7 | |||||
| 197Au | 26.0 | 3.96 | 7.76 | ||||
| 35.0 | 5.62 | 9.25 | |||||
| 47.0 | 7.84 | 10.9 |
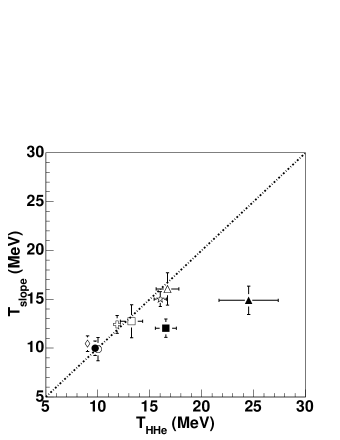
The observed time evolution of THHe also prompts us to inquire about the relationship between the maximum temperatures and the slope temperature parameters which characterize the ejectile kinetic energy spectra of the IV sources. These latter are also determined from the three source fits to the experimental spectra. As is seen in Table I and Figure 5, there is actually a close agreement between these two values for all but the 35 and 47A MeV 64Zn + 58Ni reactions. The apparently high values of the peak temperatures for these last two reactions were already seen above. As noted there, this may reflect non-equilibrium effects resulting from the very high degree of transparency for those two reactions.
At first glance, the good agreement seen for the rest of the reactions still seems surprising because the IV spectrum is known to result from a convolution of the ejectile emission from the evolving system. Thus, it depends on the time-dependent rates of both the ejectile emission and the temperature evolution of the system. However, if the requirement that the global fit to the IV source reproduce the high energy tail of the IV spectrum plays a dominant role in determining the overall slope temperature parameter of the fit, this result is understandable. In such a case, the agreement seen between this thermal slope parameter and the chemical temperature determined from the isotope yield ratios for the lowest energy 26A MeV 64Zn + 58Ni reaction and for the 64Zn + 92Mo and 64Zn + 197Au reactions at all three projectile energies provides a strong indication that a simultaneous thermal and chemical equilibrium is achieved in the emitting system, at least locally, at times corresponding to those of the peak temperatures.
IV.3 Model estimates of peak temperature and source sizes
We have attempted to make a first order estimate of the maximum temperature to be expected. In the AMD calculations for our systems, only a small fraction of the available mass and excitation energy has been removed from the system by pre-equilibrium emission at the times which we associate with the observed maximum temperatures wada04 . For the reaction being considered, we then ignore the mass loss and estimate the maximum thermal excitation energy to be E∗ = ECM + Q, where ECM is the available Center of Mass energy and Q, the fusion reaction Q value. Excitation energies per nucleon of 5.9 to 11.2 MeV/u are obtained in this way. The results of these calculations are presented in column 7 of Table I. At the times corresponding to the maximum observed temperature, the AMD-V calculations show the composite systems to have rebounded from an initial small compression and the system density, , to be at or below normal. If = 1, we can estimate the maximum temperature which we might expect. Here we assume a uniform normal density Fermi gas preston62 with a Fermi Energy which we take from the interpolation or extrapolation of the values reported in reference moniz71 . Since the system is quite excited, we further assume a nucleon effective mass of 1 shlomo91 . Ignoring the small mass loss expected, we calculate the temperature, T, from E, where , the level density parameter, is determined from the Fermi energy. Here = A/15.2 MeV-1 is used moniz71 . The temperatures thus derived are presented in Table I, column 8. While the calculated temperatures reported in column 8 are indeed significantly higher than limiting termperatures of caloric curve measurements, they are not as high as the observed maximum temperatures in column 4.
The calculated values in column 8 follow from an assumed thermalization of the entire system. In a recent investigation, Sood and Puri have employed a QMD transport model to calculate the maximum and average temperatures and densities achieved in symmetric or near symmetric heavy ion collisions at Ebal, the balance energy corresponding to the transition from positive to negative flow sood03 . Their calculation of the maximum temperature, based upon a local density approximation for the matter contained in a sphere of 2 fm radius around the center of mass of the system, clearly indicates that the entire system is not equilibrated at the early times. In general, the available center of mass energies in the calculations of reference sood03 are somewhat higher than those of our reactions with 47A MeV 64Zn and the calculations are made for varying impact parameters. Nevertheless, the maximum double isotope ratio temperatures derived in the present experimental study are quite comparable to those reported in reference sood03, . This is particularly noteworthy because the calculations by Sood and Puri strongly suggest the presence of an initial hot, locally equilibrated, participant zone surrounded by colder spectator matter and the derived temperatures are interpreted as representing a local thermal equilibrium. A similar picture is obtained in the AMD-V calculations of reference wada04 . Further, such a result is consistent with results of earlier experimental studies of pre-equilibrium emission which found that the IV spectra could be equally well modeled either within the framework of nucleon-nucleon collision dynamics or as emission from a hot thermalized participant zone awes81 ; fox88 .
If, in fact, the early system consists of both participant (nascent fireball mekjian78 ) and spectator matter then, initially, the available energy may be distributed only over a subset of the nucleons. Further, the density for this subsystem need not be . Assuming still that such a hot participant zone may be modeled as a uniform density Fermi gas allows us to write the more general expression natowitz02_2 ; viola04
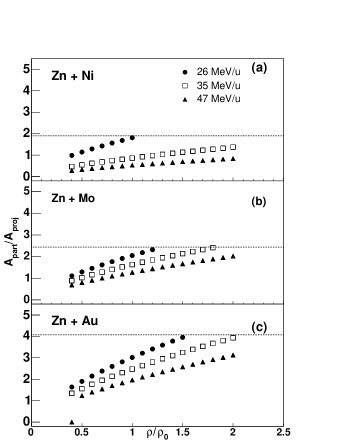
where is the inverse level density parameter at normal density (in an excited nucleus) and Apart is the mass number of the participant zone. Taking to be 15.2 MeV and the observed peak temperatures from column 4 of table I allows us to calculate as a function of for each system studied at each projectile energy. The results are presented in Figure 6 (a)-(c), where the calculated , normalized to the projectile mass, is plotted against . Some initial compression and subsequent expansion is predicted by the AMD-V calculation. The density at the time of the experimental peaking of the temperature is expected to be less than normal density. The results of this calculation indicate that the number of participant nucleons at the time of the peaking of the temperature decreases with increasing projectile energy and increases with increasing target mass. The values of the ratios which would result from participation of the total entrance channel masses are indicated by the horizontal lines in the figure. Most experimental values are well below those. These results suggest the existence of a hot zone at early times. For the case of 47A 64Zn + 197Au, results of the AMD-V calculations reported in referencewada04 indicate the existence of such a zone at early time, with a mass number about twice that of the projectile. As seen in Figure 6, the Fermi gas estimate for this system at below normal densities is quite close to that.
While the possibility of emission from a thermalized hot zone is one of the possible interpretations which has previously been suggested in earlier comparisons of dynamic and thermal pictures of pre-equilibrium emission in similar collisions awes81 ; fox88 , in the present study it is inferred not from the slope parameters of the pre-equilibrium source but rather from the peak value of the temperature, THHe. The double isotope ratio temperature measurements assume chemical equilibrium. We return to this point in the following section.
V Summary and Conclusions
The kinetic energy variation of emitted light clusters has been employed as a clock to explore the time dependence of the temperature evolution of thermalizing composite systems produced in the reactions of 26A, 35A and 47A MeV 64Zn with 58Ni, 92Mo and 197Au. For each system investigated, the double isotope ratio temperature curve exhibits a high maximum apparent temperature, in the range of 10-25 MeV. The maximum values increase with increasing projectile energy and decrease with increasing target mass. These maxima occur at times from 80 to 130 fm/c after the nuclei contact. They are much higher than the limiting temperatures determined from caloric curve measurements in similar reactions natowitz02_1 . For most of the reactions studied, a close correlation is observed between the peak temperatures for early emitted particles, obtained from double isotope ratios, and the spectral slope temperatures for the pre-equilibrium (IV) source. The data indicate that at least a local thermal and chemical equilibrium is established during these times. After peaking, the temperatures decrease rapidly, apparently reflecting particle emission, diffusion of the excitation energy into the remaining system and expansion. For each individual target nucleus, the later portions of the cooling curves for all three projectile energies are very similar, indicating that hot nuclei with similar properties are produced. Temperatures comparable to those derived from limiting temperature systematics are reached 30 to 40 fm/c after the times corresponding to the maxima, at the times when AMD-V transport model calculations predict entry into the final evaporative or fragmentation decay of the hot composite system.
As a final comment, we note that the present data suggest that if the Z=1 and Z=2 ejected light particles are taken to represent the gaseous phase, as is usually assumed, the reaction dynamics of central collisions may itself lead to a natural situation in which the gas is not outside the liquid matter but initially confined inside the liquid matter, perhaps facilitating the establishment of a liquid-gas equilibrium. This could somewhat mitigate arguments that the concept of establishment of a liquid gas equilibrium is not tenable in a nuclear collision as there is no container to constrain the gas. Of course, more recently it has also been argued, on the basis of detailed balance, that the actual physical equilibrium is not necessary moretto02 .
VI Acknowledgements
This work was supported by the United States Department of Energy under Grant # DE-FG03- 93ER40773 and by The Robert A. Welch Foundation under Grant # A330. The work of JSW is also partially supported by the NSFC under Grant # 10105011.
References
- (1) E. Suraud, C. Gregoire and B. Tamain, Prog. Part. and Nucl. Phys. 23 357 (1989).
- (2) B. Tamain and D. Durand University of Caen Report LPCC 96-16 (1996) and references therein.
- (3) P. Chomaz, Proceedings of the INPC 2001 Conference, Berkeley, Ca., July 2001
- (4) J. Cibor, R. Wada, K. Hagel, M. Lunardon, N. Marie, R. Alfaro, W. Q. Shen, B. Xiao, Y. Zhao, J. Li, B. A. Li, M. Murray, J. B. Natowitz, Z. Majka and P. Staszel, Phys. Lett. B473, 29 (2000).
- (5) K. Hagel, R. Wada, J. Cibor, M. Lunardon, N. Marie, R. Alfaro, W. Shen, B. Xiao, Y. Zhao, Z. Majka, J. Li, P. Staszel, B.-A. Li, M. Murray, T. Keutgen, A. Bonasera, and J. B. Natowitz, Phys. Rev. C 62, 034607 (2000).
- (6) J.B. Natowitz, R. Wada, K. Hagel, T Keutgen, M. Murray,Y. G. Ma , A. Makeev, L. Qin , P. Smith and C.Hamilton, Phys. Rev. C 65, 034618 (2002).
- (7) J. Pouthas et al., Nucl. Instr. & Meth. A 357, 418 (1995).
- (8) F. Bernachi et al., Nucl. Instr. & Method A 281, 137 (1989).
- (9) F. Hubert, A.Fleury, R. Bimbot and D. Gardes Annales de Physique Supplement V5 (1980).
- (10) R. Wada, T. Keutgen, K. Hagel, Y. G. Ma, J. Wang, M. Murray, L. Qin, P. Smith, J. B. Natowitz, R. Alfarro, J. Cibor, M. Cinausero, Y. El Masri, D. Fabris, E. Fioretto, A. Keksis, M. Lunardon, A. Makeev, N. Marie, E. Martin, A. Martinez-Davalos, A. Menchaca-Rocha, G. Nebbia, G. Prete, V. Rizzi, A. Ruangma, D. V. Shetty, G. Souliotis, P. Staszel, M. Veselsky, G. Viesti, E. M. Winchester, S. J. Yennello, Z. Majka and A. Ono, Phys. Rev. C 69 044610 (2004).
- (11) J.Cibor et al., in ”Isospin Physics in Heavy-Ion Collisions at Intermediate Energies”, Eds.Bao-An Li and W. Udo Schroeder, NOVA Science Publishers, Inc. (New York), (2001)
- (12) T.C. Awes, G. Poggi, C.K. Gelbke, B.B. Back, B.G. Glagola, H. Breuer and V.E. Viola, Jr., Phys. Rev. C 24, 89 (1981).
- (13) R. Wada, D. Fabris, K. Hagel, G. Nebbia, Y. Lou, M. Gonin, J.B. Natowitz, R. Billerey, B. Cheynis, A. Demeyer, D. Drain, D. Guinet, C. Pastor, L. Vagneron,K. Zaid, J. Alarja, A. Giorni, D. Heuer, C. Morand, B. Viano, C. Mazur, C. Ngo, S. Leray, R. Lucas, M. Ribrag and E. Tomasi, Phys. Rev. C 39, 497 (1989)
- (14) V. E. Viola, K. Kwiatkowski and W. A. Friedman, Phys. Rev. C 59, 2260 (1999).
- (15) D. Fox, D.A. Cebra, J. Karn, C. Parks, A. Pradhan, A. Vander Molen, J. van der Plicht, G.D. Westfall, W.K. Wilson and R.S. Tickle, Phys. Rev. C 38, 146 (1988).
- (16) K. Hagel, D. Fabris, P. Gonthier, H. Ho, Y. Lou, Z. Majka, G. Mouchaty, M.N. Namboodiri, J.B. Natowitz, G. Nebbia, R. P. Schmitt, G. Viesti, R. Wada and B. Wilkins, Nucl. Phys. A486, 429 (1988).
- (17) M. Gonin, L. Cooke, K. Hagel, Y. Lou, J. B. Natowitz, R. P. Schmitt, S. Shlomo, B. Srivastava, W. Turmel, H. Utsunomiya, R. Wada, G. Nardelli, G. Nebbia, G. Viesti, R. Zanon, B. Fornal, G. Prete, K. Niita, S. Hannuschke, P. Gonthier, and B. Wilkins, Phys. Rev. C 42, 2125 (1990).
- (18) J. Lukasik and Z. Majka, Acta. Phys. Pol. 24B, 1959 (1993).
- (19) A. Ono and H. Horiuchi, Phys. Rev. C 53, 2958 (1996) .
- (20) Z.Y. He , G.M. Jin, Z.Y. Li, L. M. Duan, G. X. Dai, B. G. Zhang, H. Y. Wu, W. X. Wen,Y. J. Qi and Q. Z. Luo, Phys. Rev. C 57, 1824 (1998)
- (21) C. J. Gelderlos,R. Sun,N. N. Ajitanand, J. M. Alexander, E. Bauge, A. Elmaani, T. Ethvignot, R. Lacey, M. E. Brandan, A. Giorni, D. Heuer, S. Kox, A. Lleres, A. Menchaca-Rocha, F. Merchez, D. Rebreyand, J.B.Viano, B. Chambon, B. Cheynis, D. Drain and C. Pastor, Phys. Rev. C 52, R2834 (1995).
- (22) S. Albergo, S. Costa, E. Costanzo, and A. Rubbino, Nuovo Cimento A 89, 1 (1985) .
- (23) A. Kolomiets, V. M. Kolomietz, and S. Shlomo, Phys. Rev. C 55, 1376 (1997).
- (24) H. Xi, M. J. Huang, W. G. Lynch, S. J. Gaff, C. K. Gelbke, T. Glasmacher, G. J. Kunde, L. Martin, C. P. Montoya, S. Pratt, M. B. Tsang , W. A. Friedman , P. M. Milazzo, M. Azzano, G. V. Margagliotti, R. Rui, G. Vannini, N. Colonna, L. Celano, G. Tagliente , M. D’Agostino, M. Bruno, M. L. Fiandri, F. Gramegna , A. Ferrero, I. Iori, A. Moroni, and F. Petruzzelli and P. F. Mastinu, Phys. Rev. C 57, R462 (1998).
- (25) H.F. Xi, G.J. Kunde, O. Bjarki, C.K. Gelbke , R.C. Lemmon, W. G. Lynch, D. Magestro, R. Popescu,R. Shomin, M.B. Tsang, A.M. Vandermolen, G.D. Westfall, G. Imme, V. Maddalena, C. Nociforo, G. Raciti, G. Riccobene, F. P. Romano, A. Saija, C. Sfienti, S. Fritz, C. Gro(, T. Odeh, C. Schwarz, A. Nadasen, D. Sisan, and K.A.G. Rao, Phys. Rev. C 58, R2636 (1998).
- (26) R. Wada, R. Tezkratt, K. Hagel, F. Haddad, A. Kolomiets, Y. Lou, J. Li, M. Shimooka, S. Shlomo, D. Utley, B. Xiao, N. Mdeiwayeh, J. B. Natowitz, Z. Majka, J. Cibor, T. Kozik, and Z. Sosin, Phys. Rev. C 55, 227 (1997).
- (27) R. J. Charity, et al. Nucl. Phys. A483, 371 (1988).
- (28) A. D. Sood and R. K. Puri, ArXiv Preprint nucl-th/0311013, Submitted to Phys. Rev. C (2003).
- (29) M. A. Preston, Physics of the Nucleus, Addison- Wesley Publishing Company, Reading, Mass. (1962)
- (30) EJ Moniz, I Sick, R.R. Whitney, J. R. Ficenec, R.P. Kephart, W. Trower, Phys. Rev. Lett. 26, 445 (1971)
- (31) S. Shlomo and J. B. Natowitz Phys. Rev. C 44, 2878 (1991)
- (32) A.Z. Mekjian, Phys. Rev. C 17, 1051 (1978); Phys. Rev. Lett. 38, 640 (1977); Phys. Lett B89, 177 (1980)
- (33) J. B. Natowitz, K. Hagel, Y. Ma, M. Murray, L. Qin, S. Shlomo, R. Wada, and J. Wang, Phys. Rev. C 66, 031601 (2002).
- (34) V. Viola, submitted to Phys Rev. Lett. (2004).
- (35) Z. Majka, P. Staszel, J. Cibor, J. B. Natowitz, K. Hagel, J. Li, N. Mdeiwayeh, R. Wada, and Y. Zhao, Phys. Rev. C 55, 2991 (1997); M. Gonin, L. Cooke, K. Hagel, Y. Lou, J. B. Natowitz, R. P.Schmitt, B. Srivastava, W. Turmel, H. Utsunomiya, R. Wada,G. Nardelli, G. Nebbia, G. Viesti, R. Zanon, G. Prete, P.Gonthier and B. Wilkins, Phys. Lett. B 217, 406 (1989).
- (36) L.G. Moretto, J.B. Elliott, L. Phair and G. J. Wozniak, LBNL-51306, arXiv:nucl-ex/0209009 v1 (2002).