Charge and current-sensitive preamplifiers
for pulse shape discrimination techniques with silicon detectors
Abstract
New charge and current-sensitive preamplifiers coupled to silicon detectors and devoted to studies in nuclear structure and dynamics have been developed and tested. For the first time shapes of current pulses from light charged particles and carbon ions are presented. Capabilities for pulse shape discrimination techniques are demonstrated.
, , , , , , , , , , , , , , , , , , , , , , , , , , , , , , , , , , and
e-mail borderie@ ipno.in2p3.fr
1 Introduction
In a near future, beams of nuclei farther and farther away from stability should become available. This will enlarge the field of nuclear physics studies related to the influence of the N/Z degree of freedom. Investigating the effects of this parameter will however require the identification of both charge and mass numbers of nuclei produced in nuclear collisions, over the largest possible range. To attain this goal pulse-shape discrimination (PSD) of signals from solid state detectors appears as the most promising avenue. This method proposed more than forty years ago[1] was recently investigated in detail in relation with the design of a 4 silicon ball[2, 3, 4, 5]. Moreover potentially improved capabilities have been also discussed using homogeneously doped n-TD silicon detector [6, 7] or PSD-time of flight coupling [8]. In all the recent studies PSD was obtained by using conventional charge-sensitive preamplifiers and by injecting particles or ions into the rear-side (n-side) of totally depleted detectors. This injection mode, first proposed in ref. [1], presents two major advantages: a rising field profile with penetration depth (the highest ionization density is associated to the highest field) and a monotonic increase of charge collection time with charge and mass number of the detected particle or ion, which facilitates identification.
For the study of nuclear structure through direct reactions double sided silicon-strip detectors, with narrow pitch ( 1mm), are generally used to measure the energy and position of recoiling light charged particles [9]. For studies in nuclear dynamics, resolution in position is less crucial, but Z and A identification is needed for both particles and fragments [10].
In this work, charge and current-sensitive preamplifier prototypes for nuclear structure and dynamics experiments have been developed and tested with the aim of improving PSD method by studying in detail current signal shapes from particles and ions over a large energy range. Note that current signal shapes have been recently used in atomic cluster studies to identify partitions of carbon cluster fragmentation [11].
The paper is organized as follows. In section 2 the general guidelines of the design of preamplifiers are introduced. Section 3 is devoted to implementation and characterization of preamplifiers. In section 4 results of beam tests will be presented, discussed and compared to a simple simulation.
2 Preamplifier design guidelines
The requirements which have been considered in the design of preamplifiers are the following:
(1) Preamplifiers must be mounted in vacuum, as close as possible to their corresponding silicon detector to minimize the series inductance from the connection lead. Preamplifiers must have small size and low power consumption.
(2) Keeping the conventional part (charge-sensitive) to measure energies, an additional circuit delivering an accurate image of the current signal (converted into a voltage) is required. Such a signal will permit deeper investigations of PSD capabilities as compared to present risetime signal analysis using charge-sensitive preamplifier.
(3) For structure studies a conversion gain of 15 mV/MeV with an energy range up to 120 MeV is well suited for the detection of particles and light ions (Z). For dynamics studies a lower conversion gain is necessary to cover the large energy range needed 3 GeV for particles and ions.
(4) For structure studies silicon detectors have typical capacitances in the range 10-35 pF whereas for dynamics studies detectors with capacitances in the range 60-200 (600) pF are required. Preamplifiers (with possibly different versions) must match different detectors.
(5) Energy resolution (preamplifier + amplifier + analog to digital conversion) for structure studies (dynamics studies) better than 50 keV for 5 MeV protons (0.5% for 80 MeV carbon ions) is demanded.
3 Current and charge-sensitive preamplifiers
A new type of preamplifier with two outputs has been designed. It will provide simultaneously :
-
an accurate measurement of the overall electrical charge collected from the detector (as for classical spectroscopy) : “charge output”
-
a high bandwidth, precise representation of the detector collection current over time : “current output”
3.1 Principle of operation
3.1.1 General
The device is based on a classical folded cascode charge sensitive preamplifier (CSA) (see figures 1 and 2). The first stage uses a high frequency Field Effect Transistor (Q1) associated to a common base PNP transistor (Q2). The FET has been chosen for its high transconductance (g associated to a reduced cut-off voltage dispersion Vgs(off) . The gm can reach 25 mS for Vgs(off) = -3V. Q2 is fed by a current source (Q3). An emitter follower (Q4) drives the signal to the output stage (Q6-Q7). The feedback capacitor Cf and resistor Rf of the CSA are connected between the emitter of Q6 and the input, while the charge output is driven to the external world through an integrated buffer (BUF600).
The output stage is composed of an emitter follower Q6 fed by a current source (Q5). The current flowing through the feedback network is provided by the emitter of Q6. A common base stage (Q7) has been inserted in the collector path of Q6 in order to convert the output current into a voltage image which is driven out through the emitter follower stage Q8. This voltage represents the “current output” of the amplifier (Vout_IIe(Q7) x RI and Ie(Q6)Ic(Q6)Ie(Q7)Ic(Q7)). Actually, the input impedance of Q1 being very high, this current corresponds to the detector current. The current gain of the preamplifier (Vout_I/Iin) is proportional to the value of RI. However, several other factors affect the actual gain value, the major one being the additional capacitance load present on the emitter of Q7 (stray capacitance + input capacitance of the integrated buffer). This increases the gain by a factor 1+Cp/Cf. Cp has been experimentally determined to be 5 pF. The output stage Q8 also provides an attenuation which can not be neglected. The gain is eventually determined by simulations including the stray capacitances in each preamplifier version. Note that both outputs are matched to 50 with a serial resistor.
3.1.2 Simulated high gain version - structure studies
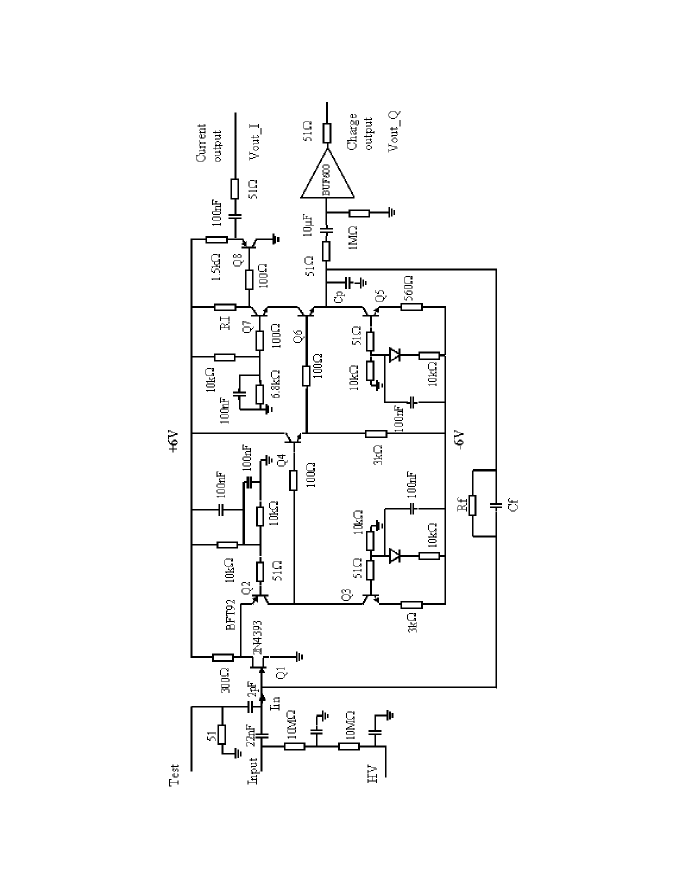
For the charge output, the gain (open output) is equal to 13 mV/MeV with Cf = 3.3 pF, which permits energy measurements up to 120 MeV corresponding to an output swing Vout_Q of 1.5 V. The current gain (transimpedance) has been determined by simulation to 550
3.1.3 Simulated low gain version - dynamics studies
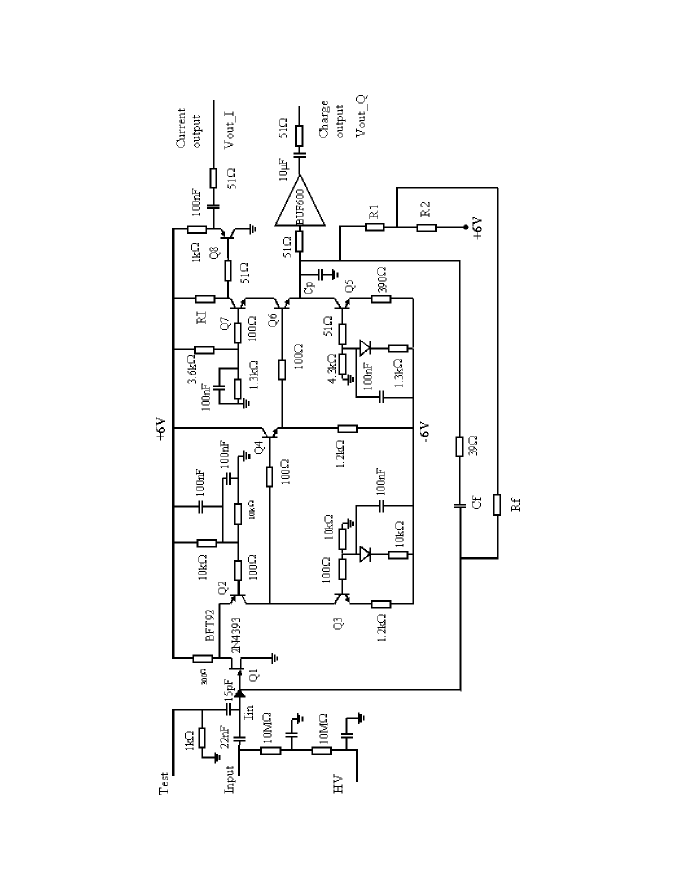
A higher energy dynamic range is needed. This has been achieved by reducing the preamplifier gain (higher Cf) and moving the output operating point towards the negative supply in order to increase the possible voltage swing. This offset has been introduced thanks to the voltage divider R1/R2 (274 k/620 k) referenced to the +6 V supply voltage (rest output voltage equal to -3.7 V). The bias voltages of Q5 and Q7 have been accordingly adjusted. The charge output gain is equal to 1.47 mV/MeV with Cf = 30 pF, leading to an input swing voltage of 3.7 V for an energy of 2.5 GeV. The simulated current gain is 129 with RI = 360 .
3.2 Preamplifier characterization
3.2.1 High gain version
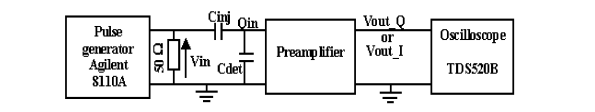
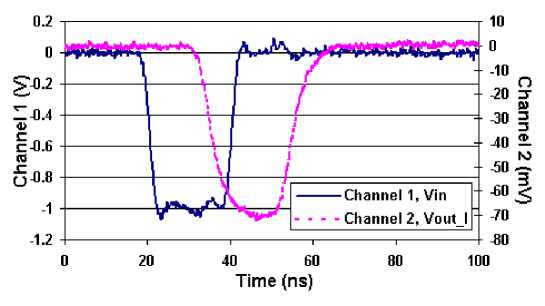
For the charge output the injection mode detailed in figure 3 has been used. The measured charge input is 536 mV for a current injection equivalent to 40 MeV. This corresponds to a gain of 13.4 mV/MeV which is in good agreement with simulation results (see 3.1.2). The decay time constant is 33 s (Rf = 10 M and Cf = 33 pF). Figure 5 shows signals (in relation with the current output) obtained with the injection mode of figure 4.
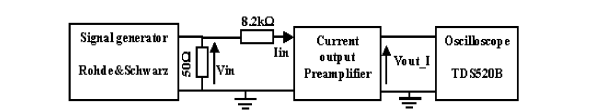
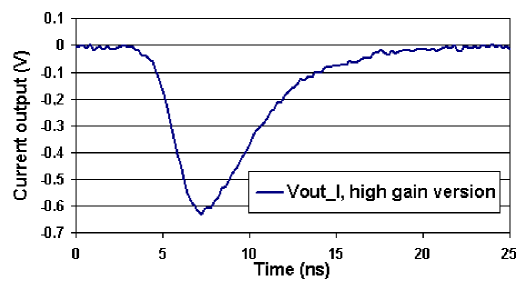
Channel 1 shows the injection signal Vin. The preamplifier input impedance being much lower than the series resistance (8.2 k, the input current (Iin in figure 4) can be easily determined. Channel 2 (figure 5) shows the signal obtained at the “current” output of the preamplifier (Vout_I in figure 1). The measured gain is then 574 V/A. Concerning the time response of the preamplifier, figure 6 shows the signal obtained at the current output (diagram of figure 1) when the circuit of figure 3 is used without Cdet (capacitance used to simulate the detector). In order to be close to a - impulse, a high speed pulse generator has been used. Figure 6 shows the current output signal: a 2 ns rise time is observed.
3.2.2 Low gain version
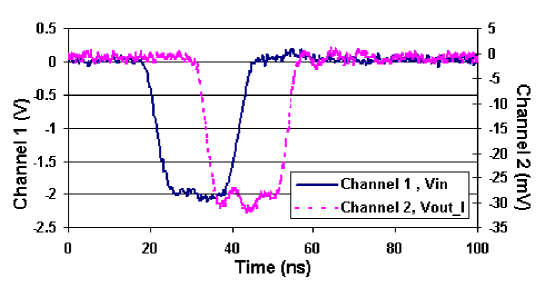
Injection circuits are the same as for subsection 3.2.1. For the charge output the measured gain is 1.4 mV/MeV and the decay time constant is 450s; the bridge R1/R2 increases the RfCf time constant by a factor 1+R1/R2. For the current output figure 7 shows the observed signals. The gain is 115 V/A. This gain is very close to the simulated gain (see 3.1.3.) The proper preamplifier rise time for the low gain version is also 2 ns.
4 Beam tests
4.1 Experimental details
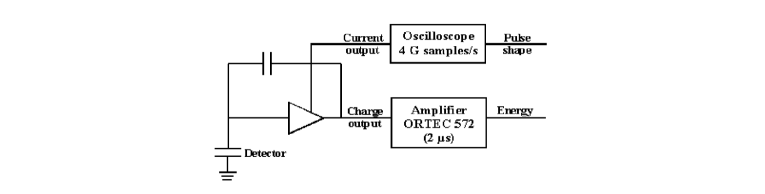
Beam tests have been performed at the TANDEM accelerator of the Institut de Physique Nucléaire in Orsay (France). Protons and deuterons with energies 3 and 5 MeV and carbon isotopes ( and ) with energy 80 MeV were elastically scattered on a 200 g/ Au target. Two totally depleted and overbiased n-type Si detectors in reverse mount (rear contact as entrance window) were used. They were manufactured by Canberra Eurisys (specifications are given in table 1) and processed by the adapted preamplifier prototypes. The high gain (low gain) preamplifier was coupled to the detector dedicated to structure studies (dynamics studies) to detect particles (carbon ions).The distance between the detector and the preamplifier was reduced to minimum using a single connector. The block scheme of the electronics is shown in figure 10. Current pulse measurements were performed with a large bandwidth digital oscilloscope (4 Gsamples/s, 8 bits) connected to the general acquisition system via a GPIB-VME interface; oscilloscope sensitivities were respectively 1, 2 and 5 mV/div. for incident energies on detectors 3, 5 and 80 MeV. A classical spectroscopy chain was used for the charge output.
| Dedicated to | silicon type | s [mm2] | x [m] | [Kcm] | [V] | [V] |
|---|---|---|---|---|---|---|
| structure studies | normal | 64 | 300 | 12.7 | 28 | 90 |
| dynamics studies | n-TD | 200 | 300 | 2.5 | 128 | 190 |
4.2 Results, simulations and discussion
First of all energy resolutions were measured from charge outputs using scattered protons () with energy 5 MeV (80 MeV). Resolution values (FWHM) are 30 keV and 0.3% for respectively protons and , which fully comply with the requirements (see section 2). By comparison with charge outputs, energy values obtained by integrating current signals and using measured current gains (see 3.2) are respectively 4.97 and 4.92 MeV for incident 5.00 MeV protons and deuterons and 79.3 MeV for incident 80 MeV ions; associated measured energy resolutions are in the range 2.5-3.5%.
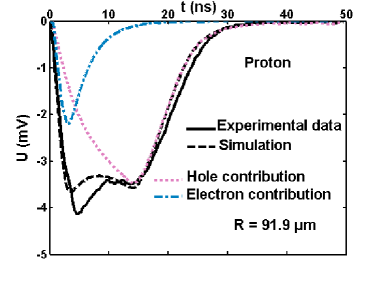
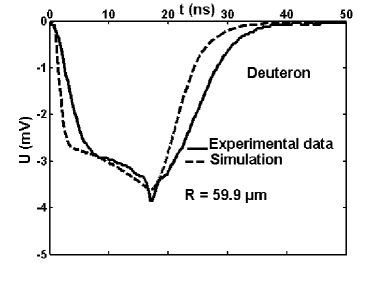
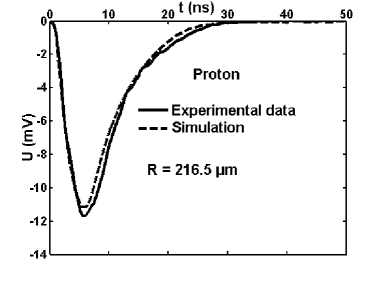
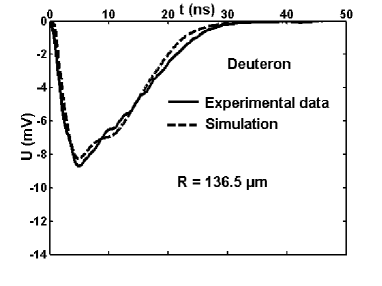
Figures 9 and 10 show experimental signals obtained at the current preamplifier (high gain) output for 3 and 5 MeV protons and deuterons. The displayed signals correspond to the average of about a thousand pulses. At 3 MeV, in particular, we can notice the peculiar shape of signals. We shall come back to this point later. Those results show clearly at 5 MeV that for two different impinging particles (proton and deuteron) with the same energy, the signals from the detector have the same duration but different shapes which can be used for discrimination. With a standard preamplifier (charge output) which integrates current signals, we would not be able to easily discriminate both particles because of the similar rise times.
A simple simulation is compared to the signals. To produce the output current pulse, we need two parts in simulations : one giving the current pulse delivered by the detector and one which simulates the preamplifier. The first one consists in describing the drift, in the electric field, of charge carriers produced all along the track of the particle. Normalized stopping powers for particles (corresponding to energy losses in bins of elementary thickness x= particle range/200) are calculated using SRIM [12]. An electon-hole pair is created by 3.6 eV energy deposit and the mobility for holes and electrons as a function of the electric field is calculated using the empirical equation of reference [13]. Then the current output signal from the preamplifier (homogeneous to a voltage) is obtained calculating the preamplifier response to the time dependent signal from the detector; AWBHDL software developed by CADENCE ELECTRONICS is used. For this second part of the simulation we also need the impedance of the detector seen by the preamplifier. Table 2 shows the values measured for the different elements corresponding to the two detectors; measurements were done using a vector impedance meter (HP 4815 RF) at different frequencies (1, 10, 30, 70 MHz). Results of simulations are compared
| Dedicated to | R [] | C [pF] | L [nH] |
|---|---|---|---|
| structure studies | 2 | 16 | 3 |
| dynamics studies | 4 | 62 | 3 |
to the experimental current signals obtained for 3 (figure 9) and 5 MeV (figure 10) protons and deuterons. The calculated pulses give a good account of the measured signals.
Depending on the range of particles, contributions to signals from hole and electron drifts are more or less visible. The smaller is the range the larger is the difference in time between contributions to the signal from electrons (faster contribution) and holes. An example of the simulated contributions from electrons and holes to the current is displayed for protons in figure 9.
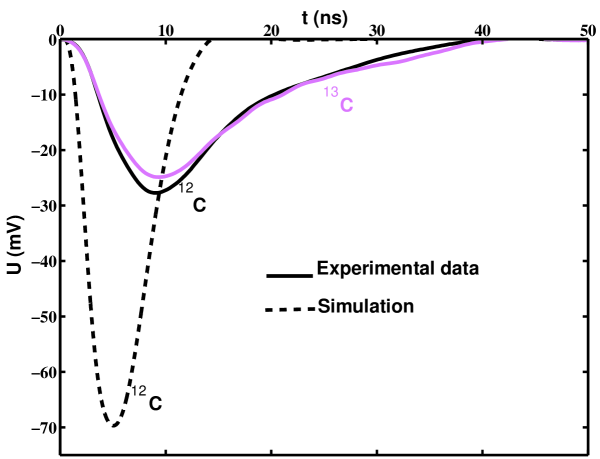
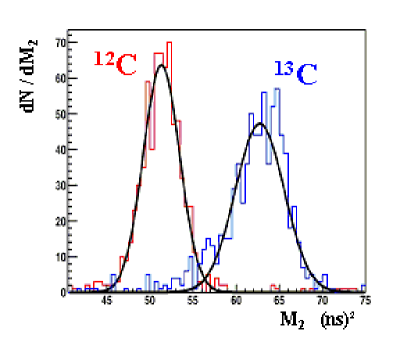
For 80 MeV carbon isotopes, figure 11 displays the observed mean current signals (averaged over about thousand recorded pulses). Once again pulses corresponding to the two isotopes have the same duration but their shapes are slightly different and we can notice in particular the variation of amplitude. An example of identification of the two isotopes using the second moment of current pulses is shown in figure 12. Results of the simple simulation are also given in figure 11 and a big disagreement is observed. This observation is not surprising. Indeed it is well known that for heavy ions the density of ionization is much higher and consequently the extraction of electrons and holes from the zone of high carrier density is delayed and reduced due to a screened electric field (see for example [2] and references therein). Simulations taking those facts into account in a fully consistent way are in progress [14]. The extension of identification possibilities to heavier and more energetic ions is currently under study.
5 Conclusions
Charge and current-sensitive preamplifiers well suited for pulse shape discrimination techniques have been developed and successfully tested. The feasiblity of identification from current pulse shapes for light charged particles is clearly established. Moreover it was shown that a simple simulation, which has to be improved (3D simulation including resistivity variations) can help in the design definition for future detectors. For heavy ions the work presented here is a starting point for more complete investigations including both the constitution of a data base of current signals (different ions at various incident energies) and a better modeling ( complete description in terms of finite elements) of the charge collection in presence of a high ionization density. The obtained results also suggest the replacement of analog methods with digital sampling techniques [15].
6 Acknowledgements
The authors are indebted to CNES-DESER and ONERA-DESP for providing us with their scattering chamber at the TANDEM accelerator.
References
- [1] C. A. J. Ammerlaan et al., Nucl. Instr. and Meth. 22 (1963) 189.
- [2] G. Pausch et al., Nucl. Instr. and Meth. A 337 (1994) 573.
- [3] G. Pausch et al., IEEE Trans. Nucl. Sci. 43 (1996) 1097.
- [4] G. Pausch et al., IEEE Trans. Nucl. Sci. 44 (1997) 1040.
- [5] G. Pausch et al., Nucl. Instr. and Meth. A 443 (2000) 304.
- [6] M. Mutterer et al., IEEE Trans. Nucl. Sci. 47 (2000) 756.
- [7] W. von Ammon, Nucl. Instr. and Meth. B 63 (1992) 95.
- [8] J. Lu et al., Nucl. Instr. and Meth. A 471 (2001) 374.
- [9] Y. Blumenfeld et al., Nucl. Instr. and Meth. A 421 (1999) 471.
- [10] J. Pouthas et al., Nucl. Instr. and Meth. A 357 (1995) 418.
- [11] M. Chabot et al., Nucl. Instr. and Meth. B 197 (2002) 155.
-
[12]
J. F. Ziegler et al., The Stopping and Range of Ions in Matter,
Pergamon Press, New York (1985). - [13] C. Leroy et al., Nucl. Instr. and Meth. A 434 (1999) 90.
- [14] M. Parlog et al., to be published
- [15] L. Bardelli et al., Nucl. Instr. and Meth. A 491 (2002) 244.