Electric charge fluctuations
in central Pb+Pb collisions
at 20, 30, 40, 80 and 158 AGeV
The NA49 Collaboration
Results are presented on event-by-event electric charge fluctuations in central Pb+Pb collisions at 20, 30, 40, 80 and 158 GeV. The observed fluctuations are close to those expected for a gas of pions correlated by global charge conservation only. These fluctuations are considerably larger than those calculated for an ideal gas of deconfined quarks and gluons. The present measurements do not necessarily exclude reduced fluctuations from a quark-gluon plasma because these might be masked by contributions from resonance decays.
C. Alt9, T. Anticic21, B. Baatar8,D. Barna4, J. Bartke6, M. Behler13, L. Betev9, H. Białkowska19, A. Billmeier9, C. Blume7, B. Boimska19, M. Botje1, J. Bracinik3, R. Bramm9, R. Brun10, P. Bunčić9,10, V. Cerny3, P. Christakoglou2, O. Chvala15, J.G. Cramer17, P. Csató4, N. Darmenov18, A. Dimitrov18, P. Dinkelaker9, V. Eckardt14, P. Filip14, D. Flierl9,Z. Fodor4, P. Foka7, P. Freund14, V. Friese7, J. Gál4, M. Gaździcki9, G. Georgopoulos2, E. Gładysz6, K. Grebieszkow20, S. Hegyi4, C. Höhne13, K. Kadija21, A. Karev14, M. Kliemant9, S. Kniege9, V.I. Kolesnikov8, T. Kollegger9, E. Kornas6, R. Korus12, M. Kowalski6, I. Kraus7, M. Kreps3, M. van Leeuwen1, P. Lévai4, L. Litov18, B. Lungwitz9, M. Makariev18, A.I. Malakhov8, C. Markert7, M. Mateev18, B.W. Mayes11, G.L. Melkumov8, C. Meurer9, A. Mischke7, M. Mitrovski9, J. Molnár4, St. Mrówczyński12, G. Pálla4, A.D. Panagiotou2, D. Panayotov18, A. Petridis2, M. Pikna3, L. Pinsky11, F. Pühlhofer13, J.G. Reid17, R. Renfordt9, A. Richard9, C. Roland5, G. Roland5, M. Rybczyński12, A. Rybicki6,10, A. Sandoval7, H. Sann7, N. Schmitz14, P. Seyboth14, F. Siklér4, B. Sitar3, E. Skrzypczak20, G. Stefanek12, R. Stock9, H. Ströbele9, T. Susa21, I. Szentpétery4, J. Sziklai4, T.A. Trainor17, D. Varga4, M. Vassiliou2, G.I. Veres4, G. Vesztergombi4, D. Vranić7, A. Wetzler9, Z. Włodarczyk12 I.K. Yoo16, J. Zaranek9, J. Zimányi4
1NIKHEF, Amsterdam, Netherlands.
2Department of Physics, University of Athens, Athens, Greece.
3Comenius University, Bratislava, Slovakia.
4KFKI Research Institute for Particle and Nuclear Physics, Budapest, Hungary.
5MIT, Cambridge, USA.
6Institute of Nuclear Physics, Cracow, Poland.
7Gesellschaft für Schwerionenforschung (GSI), Darmstadt, Germany.
8Joint Institute for Nuclear Research, Dubna, Russia.
9Fachbereich Physik der Universität, Frankfurt, Germany.
10CERN, Geneva, Switzerland.
11University of Houston, Houston, TX, USA.
12Institute of Physics Świ etokrzyska Academy, Kielce, Poland.
13Fachbereich Physik der Universität, Marburg, Germany.
14Max-Planck-Institut für Physik, Munich, Germany.
15Institute of Particle and Nuclear Physics, Charles University, Prague, Czech Republic.
16Department of Physics, Pusan National University, Pusan, Republic of Korea.
17Nuclear Physics Laboratory, University of Washington, Seattle, WA, USA.
18Atomic Physics Department, Sofia University St. Kliment Ohridski, Sofia, Bulgaria.
19Institute for Nuclear Studies, Warsaw, Poland.
20Institute for Experimental Physics, University of Warsaw, Warsaw, Poland.
21Rudjer Boskovic Institute, Zagreb, Croatia.
Keywords: Relativistic heavy-ion collisions; Charge fluctuations; QGP;
I Introduction
Ultra-relativistic heavy-ion collisions provide the opportunity to study the properties of strongly interacting matter. One of the predicted features of this matter, which one hopes to establish in heavy-ion collisions, is the occurrence of a phase transition between a purely hadronic state and the quark-gluon plasma. Recently several results were reported Afanasiev:2002mx ; Gazdzicki:2004ef which suggest that this transition starts in central Pb+Pb collisions at energies around 30 AGeV Gazdzicki:1998vd ; Gorenstein:2003cu . The search for further signals of deconfinement is in progress and may provide additional support for such an interpretation. Among them a suppression of event-by-event fluctuations of electric charge was predicted Ko.1 ; As.1 as a consequence of deconfinement. Estimates of the magnitude of the charge fluctuations indicate that they are much smaller in a quark-gluon plasma than in a hadron gas. Thus, naively, a decrease of the fluctuations is expected when the collision energy crosses the threshold for the deconfinement phase transition. However, this prediction is derived under the assumptions that the initial fluctuations survive hadronization and that their relaxation times in hadronic matter are significantly longer than the hadronic stage of the collision Ko.1 ; As.1 ; Sh.1 . First data on charge fluctuations in central heavy ion collisions were published by PHENIX Adcox:2002mm and STAR Adams:2003st at the BNL RHIC, and preliminary results at the CERN SPS were shown by NA49 Blume:2002mr . The predicted large suppression of charge fluctuations was not observed. Results by NA49 on transverse momentum and strangeness fluctuations can be found in Refs. Appelshauser:1999ft ; Anticic:2003fd and Afanasev:2000fu ; Roland:2004pu , respectively.
In this work final results on electric charge fluctuations in central Pb+Pb collisions at 20, 30, 40, 80 and 158 AGeV measured by NA49 at the CERN SPS are presented and discussed in view of their significance as a signal of deconfinement. The used measure of charge fluctuations Za.1 is introduced in Sec. II. The experimental set-up is presented in Sec. III and the data sets as well as analysis method are described in Sec. IV. Results are given in Sec. V and are discussed in Sec. VI. The summary is given in Sec. VII.
II The measure of charge fluctuations
The magnitude of the measured charge fluctuations depends not only on the unit of electric charge carried by degrees of freedom of the system (hadrons or quarks and gluons), but depends also on trivial effects, which may obscure the physics of interest. The two most important of these effects are the fluctuations in the event multiplicity, caused mostly by the variation of the impact parameter, and changes in the mean multiplicity due to changes of the acceptance in which fluctuations are studied. In addition to the measure of charge fluctuations Ko.1 several alternative measures such as , Star.1 and Za.1 were proposed to minimize the sensitivity to these effects. In this analysis we use which is constructed from the well established measure of event-by-event fluctuations, defined as Ma.1 :
| (1) |
where:
| (2) |
In these equations denotes a single particle variable, is the number of particles of the event within the acceptance, and over-line and denote averaging over a single particle inclusive distribution and over events, respectively. By construction, for a system which is an independent sum of identical sources of particles the value of is equal to the value of for a single source and does not depend on the number of superimposed sources Ma.1 ; Ma.2 . In this analysis in Eqs. (2) is taken to be the electric charge and the measure is called .
For a scenario in which particles are correlated only by global charge conservation (GCC) the value of is given by Za.1 ; Mrowczynski:2001mm :
| (3) |
where
| (4) |
with and being the mean charged multiplicity in the detector acceptance and in full phase space (excluding spectator nucleons), respectively. Strictly speaking Eq. (3) holds for vanishing net charge. However, as shown in Mrowczynski:2001mm , Eq. (3) serves as a good approximation also for realistic non-zero values of the total net charge.
In order to remove the sensitivity to GCC the measure is defined as the difference:
| (5) |
By construction, the value of is zero if the particles are correlated by global charge conservation only. It is negative in case of an additional correlation between positively and negatively charged particles, and it is positive if the positive and negative particles are anti-correlated Za.1 .
III Experimental Set-up
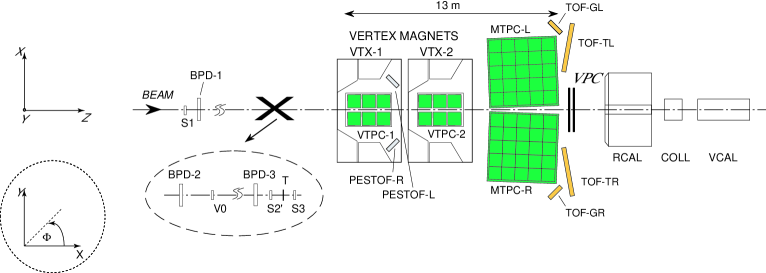
The NA49 experimental set-up Inst is shown in Fig. 1. The main detectors of the experiment are four large-volume Time Projection Chambers (TPCs). Two of these, the Vertex TPCs (VTPC-1 and VTPC-2), are located in the magnetic field of two super-conducting dipole magnets. This allows separation of positively and negatively charged tracks and a measurement of the particle momenta. The nominal magnetic field is adjusted in proportion to the beam energy to ensure a good acceptance at all energies. The other two TPCs (MTPC-L and MTPC-R), positioned downstream of the magnets, are optimized for precise measurement of the ionization energy loss which is used for the determination of the particle masses. Additional information on the particle masses is provided by two Time-of-Flight (TOF) detector arrays which are placed behind the MTPCs. The centrality of the collisions is determined by a calorimeter (VCAL) which measures the energy of the projectile spectators. To cover only the spectator region the geometrical acceptance of the VCAL was adjusted for each beam energy by a proper setting of a collimator (COLL) Inst ; Ap.98 . The Beam Position Detectors (BPD-1, BPD-2 and BPD-3) are used to determine the - and -coordinate of the beam at the target. Alternatively the main vertex position is reconstructed as the common intersection point of reconstructed tracks. A detailed description of the NA49 set-up and tracking software can be found in Ref. Inst .
IV Data Analysis
IV.1 Data
At all energies 50K events were analyzed with a centrality of 7% of the inelastic cross-section except at 158 GeV where the 10% most central events were selected.
To minimize the contributions of non-target collisions only events which satisfy the following two selection criteria were used in the analysis. Firstly, the reconstruction of the primary vertex position based on BPD and TPC data had to be successful. Secondly, the difference between vertex coordinates resulting from the BPD and TPC data should be smaller than mm in - and -coordinate and mm in -coordinate.
Several quality criteria were applied to the particle tracks. All tracks should contain points measured in at least one of the Vertex TPCs and the number of all measured points, , should be larger than 30. Only for these particles charge and momentum determination is considered to be reliable. To avoid double counting of particles only tracks with a measured number of points larger than 50% of all geometrically possible points were accepted. The number of particles originating from weak decays and secondary interactions is reduced by only using tracks for which the - and -position extrapolated to the -coordinate of the target is close to the position of the interaction point ( cm for the - and cm for the -coordinate).
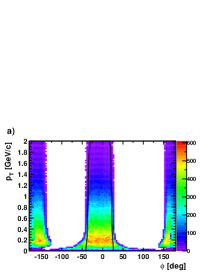
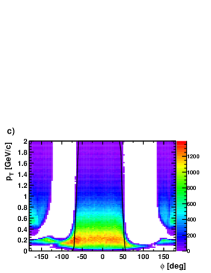
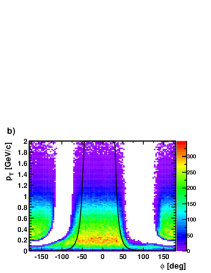
Furthermore particles are required to lie in a well defined acceptance region in , and ( is the rapidity in the center-of-mass system calculated assuming the pion mass, is the transverse momentum and denotes the azimuthal angle). A well defined acceptance is essential for comparison of the results with model predictions and with data from other experiments. The acceptance limits are parametrized by the function:
| (6) |
where , , and are parameters depending on the rapidity and collision energy. The values of the parameters for positively charged tracks in the nominal magnetic field ( pointing upward) are given in Table 1. These parameters also apply to negative tracks or to a reversed magnetic field ( pointing downward) provided in Eq. (6) is replaced by .
As an example we show in Fig. 2 the acceptance in , used for the analysis for and at 20 AGeV and and at 158 AGeV.
| 20AGeV | 30AGeV | 40AGeV | 80AGeV | 158AGeV | ||||||||||||||||
|---|---|---|---|---|---|---|---|---|---|---|---|---|---|---|---|---|---|---|---|---|
| A | B | C | D | A | B | C | D | A | B | C | D | A | B | C | D | A | B | C | D | |
| -0.5 | 0 | 0 | 23 | 4 | 0 | 0 | 35 | -10 | 0 | -1 | 63 | -8 | ||||||||
| -0.3 | 0 | 0 | 25 | -7 | 0 | 0 | 30 | 7 | 0 | 0.07 | 40 | -10 | 0 | 0 | 57 | -10 | ||||
| -0.1 | 0 | -1 | 32 | -7 | 0 | 0 | 31 | -8 | 0 | 0 | 38 | 10 | 0 | 0.07 | 46 | -10 | 0 | 0.09 | 63 | -13 |
| 0.1 | 0 | 0 | 34 | -8 | 0 | 0 | 40 | -8 | 0 | 0 | 43 | 8 | 0 | 0.05 | 52 | -12 | 0 | 0.08 | 67 | -4 |
| 0.3 | 0 | 0 | 41 | -8 | 0 | 0 | 44 | -8 | 0 | 0 | 46 | 7 | 0 | 0 | 58 | -7 | 0 | 0.08 | 65 | -3 |
| 0.5 | 0 | -0.05 | 47 | -8 | 0 | 0 | 46 | -7 | 0 | 0 | 40 | 0 | 0 | -1 | 29 | -2 | 0 | 0.05 | 27 | 0 |
| 0.7 | 0 | -0.1 | 50 | -7 | 0 | 0 | 42 | 0 | 0 | 0 | 22 | 0 | 0 | 0.05 | 26 | 0 | 0 | 0 | 35 | 0 |
| 0.9 | 0 | -0.3 | 53 | -3 | 0 | 0 | 35 | -10 | 0 | 0 | 34 | 6 | 0 | 0.08 | 35 | 0 | 0 | 0.1 | 41 | 0 |
| 1.1 | 0 | -0.2 | 38 | -10 | 0 | 0 | 39 | -13 | 0 | 0 | 46 | 15 | 0.3 | 0.1 | 67 | -27 | 0.34 | 0.43 | 109 | 0 |
| 1.3 | 0 | -0.1 | 42 | -12 | 0 | 0 | 44 | -14 | 0 | 0 | 52 | 15 | 0.3 | 0.3 | 75 | -15 | 0.36 | 0.43 | 100 | 0 |
| 1.5 | 0 | 0 | 43 | -8 | 0 | 0 | 55 | -21 | 0 | 0.1 | 58 | 20 | 0.3 | 0.27 | 85 | 0 | 0.55 | 0.4 | 100 | 0 |
| 1.7 | 0 | 0 | 51 | -18 | 0 | 0.08 | 62 | -2 | 0 | 0.08 | 72 | 0 | 0.3 | 0.18 | 75 | 0 | 0.6 | 0.4 | 88 | 0 |
| 1.9 | 0 | 0 | 63 | -4 | 0 | 0.08 | 67 | 0 | 0 | 0.08 | 68 | 0 | 0.45 | 0.15 | 70 | 0 | 0.61 | 0.35 | 73 | 0 |
| 2.1 | 0 | 0 | 62 | 0 | 0 | 0.05 | 61 | 0 | 0 | 0.09 | 60 | 0 | 0.5 | 0.12 | 50 | 0 | 0.73 | 0.34 | 55 | 0 |
| 2.3 | 0 | 0 | 57 | 0 | 0.6 | 0.05 | 57 | 0 | 0.5 | 0.08 | 50 | 0 | 0.75 | 0.08 | 50 | 0 | 1.7 | 0.28 | 60 | 0 |
| 2.5 | 0.7 | 0 | 54 | 0 | 0.6 | 0 | 46 | 0 | 0.6 | 0.05 | 40 | 0 | 2.2 | 0.08 | 50 | 0 | 2.8 | 0.25 | 60 | 0 |
| 2.7 | 0.7 | 0 | 41 | 0 | 1 | 0 | 33 | 0 | 1.5 | 0.05 | 35 | 0 | 3.2 | 0.08 | 45 | 0 | 5 | 0.2 | 57 | 0 |
| 2.9 | 1.5 | 0 | 30 | 0 | 2.7 | 0 | 32 | 0 | 4.5 | 0.08 | 45 | 0 | 7 | 0.15 | 60 | 0 | ||||
| 3.1 | 5.5 | 0 | 45 | 0 | 7 | 0.1 | 70 | 0 | ||||||||||||

IV.2 Analysis
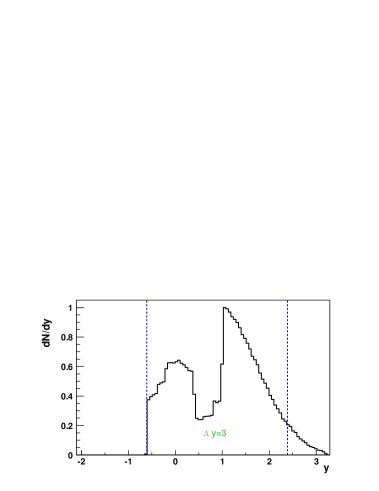
Charge fluctuations are studied as a function of the width of the rapidity interval . These rapidity intervals were centered around 1.27, 1.07, 0.89, 0.89 and 0.89 for the 20, 30, 40, 80 and 158 GeV data, respectively. The measures and were calculated for ten different rapidity intervals increasing in size from to in equal steps and will be plotted either versus or the corresponding ratio The largest rapidity interval contains approximately 90% of all accepted particles. In Fig. 3 the rapidity distribution of the accepted particles at 158 GeV is shown together with the largest rapidity interval used in the analysis.
For each event the positively and negatively charged particles
which fall into each rapidity interval and the corresponding -
acceptance are counted and using these numbers
( and )
the values of are
calculated.
The total charged particle multiplicity,
,
was estimated for each energy
based on the NA49 measurements Afanasiev:2002mx ; Gazdzicki:2004ef .
IV.3 Errors
The statistical error of is calculated by dividing the whole sample of events into 10 subsamples and calculating for each subsample separately. The dispersion of the obtained values divided by has been taken as the statistical error. The systematic errors of are estimated by varying track quality cuts: The values of are calculated for two additional sets of cuts, more ( cm and cm) and less ( cm and cm) restrictive in comparison to the standard cuts. The accepted particle multiplicity decreases by about 25% when changing from less to more restrictive cuts. The difference of these two values is considered as the systematic error. Since the statistical errors are much smaller only the systematic errors are shown in the figures.
V Results
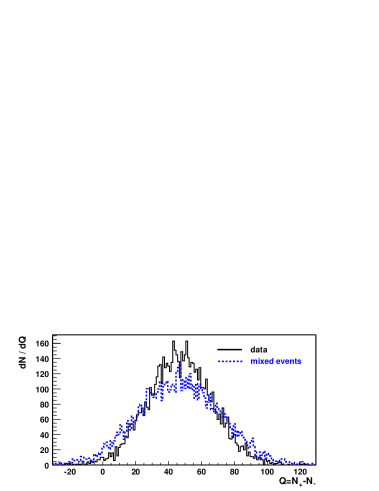
A simple measure of charge fluctuations is the width of the distribution of net-charge in the events. As an example the distribution for central Pb+Pb collisions at 158 AGeV is shown in Fig. 4. This distribution is compared to the net-charge distribution obtained from mixed events (dashed line in Fig. 4) constructed by randomly selecting particles from different events according to the multiplicity distribution measured for the data. The net-charge distribution from mixed events is significantly broader than the net-charge distribution obtained from real events.
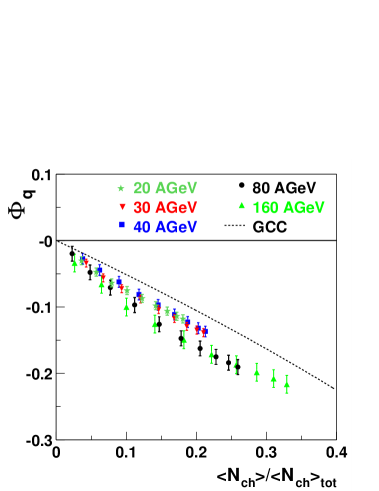
The main source of the observed difference is charge conservation which correlates positively and negatively charged particles in the real, but not in the mixed events. This is demonstrated in Fig. 5 where the values are plotted as a function of the fraction of accepted particles for central Pb+Pb collisions at 20-158 AGeV. The main trend observed in the data, a monotonic decrease with increasing fraction of accepted particles, is approximately reproduced by introducing global charge conservation as the only source of particle correlations (Eq. 3 shown by the dashed line in Fig. 5).
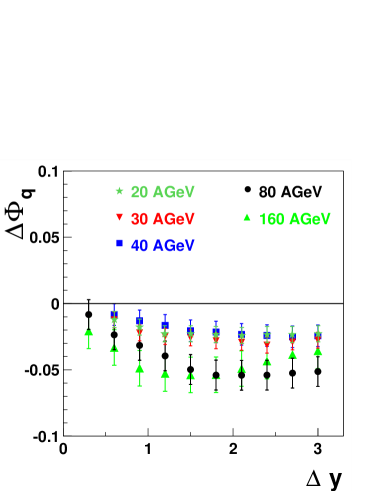
By construction, the previously introduced measure is insensitive to the correlations due to global charge conservation (see Sec. II). The dependence of on the width of the rapidity interval is shown in Fig. 6 for central Pb+Pb collisions at 20, 30, 40, 80 and 158 AGeV. The study of charge fluctuations as a function of was suggested in the original proposal Ko.1 ; As.1 . The measured values of vary between and . They are significantly larger than the values expected for QGP fluctuations ( Za.1 ; Za.2 ). The energy dependences of for the largest rapidity interval () and for the rapidity interval are shown in Fig. 7. A weak decrease of with increasing energy is suggested by the data. The numerical values of for and are given in Table 2. Note that the fraction of the accepted tracks for a fixed rapidity interval changes with collision energy, but this alone should not affect provided the correlation length is smaller than the acceptance interval in .
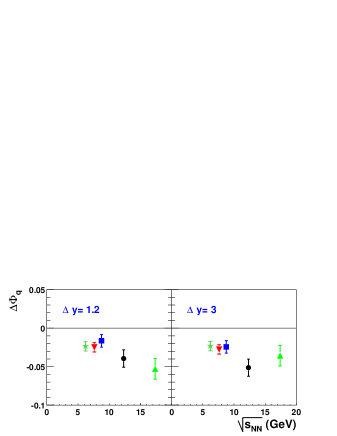
| 20 AGeV | 30 AGeV | 40 AGeV | |
|---|---|---|---|
| -0.0230.0060.0001 | -0.0280.00030.002 | -0.0240.0080.0005 | |
| -0.023 0.006 0.0001 | -0.0250.00020.016 | -0.0160.0080.0003 |
| 80 AGeV | 160 AGeV | |
|---|---|---|
| -0.0510.0110.0002 | -0.0360.0130.0003 | |
| -0.0400.0110.0003 | -0.0530.0130.0004 |
VI Discussion
The study of charge fluctuations in A+A collisions was motivated by the hypothesis that they may be sensitive to the creation of the Quark Gluon Plasma at the early stage of the collisions. To quantify the expected effect a simple QGP model was proposed in Ko.1 . In this model quarks and gluons are assumed to be in local equilibrium. Assuming entropy and net charge conservation during the evolution from the QGP to the final hadron state in each rapidity interval the number of pions and their net charge is calculated. The number of charged pions is taken to be based on isospin symmetry. Using this model it was shown that the electric charge fluctuations are significantly smaller in the case of QGP creation than in the case of formation of confined matter at the early stage of the collisions (see Fig. 8) Ko.1 ; Za.1 .
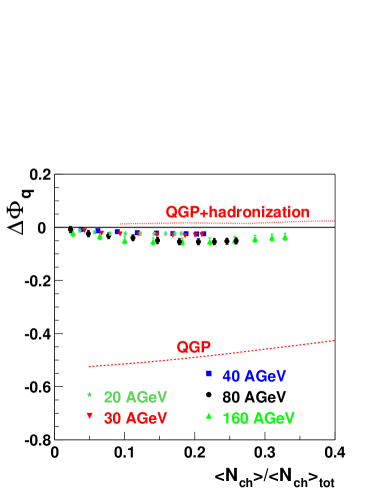
However, this model is not complete. A large fraction of pions originates from decays of resonances Be.1 . This effect is expected to lead to a distortion of the charge fluctuations established after hadronization. To quantify this effect the model was extended as follows. From the total number of produced final state pions the entropy of the system is calculated. This entropy is attributed to the early stage QGP, treated as an ideal gas of massless quarks and gluons. Bose-Einstein- and Fermi-Dirac-statistics are used to calculate equilibrium numbers of quarks and gluons. The rapidity distribution of these partons is centered at and is assumed to be of Gaussian shape with . For the calculations of charge fluctuations the rapidity interval is divided into several (10 and 20) bins and in each bin the entropy and the net-charge of the contained partons is calculated. The resulting values of at the QGP level are shown by the dashed line in Fig. 8. In the next step the QGP entropy is attributed to an ideal gas of mesons. The numbers of , and mesons in each bin are calculated assuming that of all mesons are neutral. Furthermore, all mesons are assumed to decay into two pions. The rapidity distribution of the pions is divided into 20 bins and the is calculated from the number of positively and negatively charged pions in each bin. The results of this model are shown in Fig. 8 by the dotted curve. Note that by construction for the full acceptance.
As expected, the decays of resonances strongly modify the initial QGP fluctuations. The value of increases from values between and (the lower line in Fig. 8) to values close to zero (the upper line in Fig. 8), the value characteristic for a gas of pions correlated by global charge conservation only. The model demonstrates that the distribution of charged particles in the detector acceptance is strongly distorted by the decay of intermediate resonance states. This may explain why the measurements do not show the suppression of the charge fluctuations naively expected in the case of QGP creation.
The influence of resonance decays on charge fluctuations depends on the size of the rapidity interval , in which fluctuations are calculated. If is much bigger than the typical distance in rapidity of the daughter particles, the charge within the interval will not be changed by the decay and therefore the charge fluctuations should not be affected. On the other hand, if is small, a large fraction of daughter particles will leave the interval and the initial net-charge will be significantly changed. The mean rapidity difference of two pions originating from decays of a meson is approximately 1 unit of rapidity. Therefore in order to minimize the decay effect the rapidity interval should be much larger than 1. However, this constraint is difficult to fulfill at SPS and lower energies because the rapidity distribution of all produced particles is not much broader than 1. This explains an approximately constant value of calculated within the QGP+hadronization model as seen in Fig. 8. A rapidity interval which is large enough to be unaffected by the influence of resonance decays would contain almost all particles produced in a collision. The net-charge in this interval would then reflect the number of participant protons and the fluctuations would be determined by fluctuations of the collision centrality and not the particle production mechanism. Thus at SPS energies the measured charge fluctuations are not sensitive to the initial QGP fluctuations. At very high energies (when the rapidity distribution of produced particles is significantly broader than 1) the charge fluctuations may be a valid signature of QGP creation.
VII Summary
Results on event-by-event charge fluctuations in central Pb+Pb collisions
at 20, 30, 40, 80 and 158 AGeV are presented in terms
of the measure.
The measured values are close to zero, as
expected for a gas of pions correlated only by global charge fluctuations.
This value is significantly higher than that predicted for
the creation of a QGP and hadronization into pions with
local conservation of entropy and net-charge.
A model which incorporates intermediate resonances
is described in this paper.
Its results show that the decay of mesons may easily increase
the initial QGP charge fluctuations to
thereby completely masking a possible QGP signal at SPS energies.
The slightly negative value of indicates correlations
between positively and negatively charged particles beyond those from
global charge conservation.
The origin of these additional correlations may be the final state Coulomb
interactions or quantum-statistical effects.
Acknowledgments: This work was supported by the US Department of Energy Grant DE-FG03-97ER41020/A000, the Bundesministerium fur Bildung und Forschung, Germany, the Polish State Committee for Scientific Research (2 P03B 130 23, SPB/CERN/P-03/Dz 446/2002-2004, 2 P03B 02418, 2 P03B 04123), the Hungarian Scientific Research Foundation (T032648, T032293, T043514), the Hungarian National Science Foundation, OTKA, (F034707), the Polish-German Foundation, and the Korea Research Foundation Grant (KRF-2003-070-C00015).
References
- (1) S. V. Afanasiev et al. [The NA49 Collaboration], Phys. Rev. C 66, 054902 (2002) [Axis:nucl-ex/0205002].
- (2) M. Gazdzicki [the NA49 Collaboration], arXiv:nucl-ex/0403023.
- (3) M. Gazdzicki and M. I. Gorenstein, Acta Phys. Polon. B 30, 2705 (1999) [arXiv:hep-ph/9803462].
- (4) M. I. Gorenstein, M. Gazdzicki and K. A. Bugaev, Phys. Lett. B 567, 175 (2003) [arXiv:hep-ph/0303041].
- (5) S. Jeon and V. Koch, Phys. Rev. Lett. 85, 2076 (2000) [arXiv:hep-ph/0003168].
- (6) M. Asakawa, U. W. Heinz and B. Muller, Phys. Rev. Lett. 85, 2072 (2000) [arXiv:hep-ph/0003169].
- (7) E. V. Shuryak and M. A. Stephanov, Phys. Rev. C 63, 064903 (2001) [arXiv:hep-ph/0010100].
- (8) K. Adcox et al. [PHENIX Collaboration], Phys. Rev. Lett. 89, 082301 (2002) [arXiv:nucl-ex/0203014].
- (9) J. Adams et al. [STAR Collaboration], Phys. Rev. C 68, 044905 (2003) [arXiv:nucl-ex/0307007].
- (10) C. Blume et al., Nucl. Phys. A 715, 55 (2003) [arXiv:nucl-ex/0208020].
- (11) H. Appelshauser et al. [NA49 Collaboration], Phys. Lett. B 459, 679 (1999) [arXiv:hep-ex/9904014].
- (12) T. Anticic et al. [NA49 Collaboration], arXiv:hep-ex/0311009.
- (13) S. V. Afanasiev et al. [NA49 Collaboration], Phys. Rev. Lett. 86, 1965 (2001) [arXiv:hep-ex/0009053].
- (14) C. Roland [the NA49 Collaboration], arXiv:nucl-ex/0403035.
- (15) J. Zaranek, Phys. Rev. C 66, 024905 (2002) [arXiv:hep-ph/0111228].
- (16) C. Pruneau, S. Gavin and S. Voloshin, Phys. Rev. C 66, 044904 (2002) [arXiv:nucl-ex/0204011].
- (17) S. Mrowczynski, Phys. Rev. C 66, 024904 (2002) [arXiv:nucl-th/0112007].
- (18) M. Gazdzicki and S. Mrowczynski, Z. Phys. C 54, 127 (1992).
- (19) M. Gazdzicki, Eur. Phys. J. C 8, 131 (1999) [arXiv:nucl-th/9712050].
- (20) S. V. Afanasiev et al. [NA49 Collaboration], Nucl. Instrum. Meth. A 430, 210 (1999).
- (21) H. Appelshauser et al. [NA49 Collaboration], Eur. Phys. J. A 2, 383 (1998).
- (22) F. Becattini and U. W. Heinz, Z. Phys. C 76, 269 (1997) [arXiv:hep-ph/9702274].
- (23) J. Zaranek, University of Frankfurt, Diploma Thesis (2003).