Droplet formation in expanding nuclear matter:
a system-size dependent study
Abstract
Cluster production is investigated in central collisions of Ca+Ca, Ni+Ni, 96Zr+96Zr, 96Ru+96Ru, Xe+CsI and Au+Au reactions at incident energy. We find that the multiplicity of clusters with charge grows quadratically with the system’s total charge and is associated with a mid-rapidity source with increasing transverse velocity fluctuations. When reduced to the same number of available charges, an increase of cluster production by about a factor of 5.5 is observed in the mid-rapidity region between the lightest system (Ca+Ca) and the heaviest one (Au+Au). The results, as well as simulations using Quantum Molecular Dynamics, suggest a collision process where droplets, i.e. nucleon clusters, are created in an expanding, gradually cooling, nucleon gas. Within this picture, expansion dynamics, collective radial flow and cluster formation are closely linked as a result of the combined action of nucleon-nucleon scatterings and the mean fields.
, , , , , , , , , , , , , , , , , , , , , , , , , , , , , , , , , , , , , , , , , , , , , , , , , ,
(FOPI Collaboration)
In energetic central heavy ion collisions it is generally assumed that, after going through an early stage of hot and compressed nuclear matter, the system undergoes a substantial expansion causing local cooling before freezing out. At beam energies above 10A GeV the current picture is that the hot system while cooling passes from a phase involving at least partially deconfined quarks and gluons into a purely confined hadronic phase. At energies below 1A GeV the hot phase is still predominantly a nucleonic gas which, however, in the expansion phase can partially ’liquefy’ i.e. clusterize in analogy to the processes used in clusterization devices for atomic physics [1], although under less controlled conditions. In both energy regimes the aim is to determine basic parameters, such as the critical temperature or the latent heat of the (first order) phase transition. Due to the finite size of the nuclear systems available in accelerator physics and the complexity of the dynamics of heavy ion reactions, convincing progress on this frontier has proven to be a difficult task. Concerning the liquid-to-gas transition onsets of plateau’s in caloric curves [2] have been interpreted [3] in ways that relate indirectly to first order transitions. More direct signatures [4, 5], such as negative heat capacities [6] have been subjected to critical reviewing [7]. Claims to the determination of [8, 9, 10] vary in the proposed values and require model assumptions, that seem to be in conflict with some experimental data [11]. Indications for the existence of a negative compressibility region in the nuclear phase diagram, leading to spinodal instabilities characterized by enhancement of events with nearly equal-sized fragments, have been obtained [12]. The very small cross sections for this phenomenon were justified with microscopic simulations. One of the key assumptions in many works is that multifragmentation is a unique mechanism related directly to subcritical and/or critical phenomena [5]. In recent theoretical simulations using Nuclear Molecular Dynamics (NMD), together with a backtracing method, Bondorf et al. [13] have argued that two mechanisms coexist: a dynamical rupture of spectator-type, relatively cold, fragments and a second process where nucleon-nucleon collisions generate the seeds for completely new fragment creation, coalescing nucleons which were initially far from each other in phase space.
In this Letter we present data for central collisions in symmetric heavy ion systems at 0.4A GeV that strongly support these theoretical findings [13]. In order to better understand the finite-size problem, we have varied the system size from Ca+Ca () to Au+Au (), investigating five systems of different size. We find that the multiplicity of heavy clusters with charge , when reduced to the same number of available charges, grows linearly with system size and is associated with a mid-rapidity source with increasing transverse momentum fluctuations. This is in strong contrast to multifragmentation of quasi-projectiles in the Fermi energy regime or of spectator matter at SIS/BEVALAC energies (0.1-2A GeV) where a high degree of ’universality’ [14, 15] was observed, with among others an apparent system-size independence. As parallel studies of the same systems [16] have shown an increasing degree of stopping as well as increasing generation of flow when passing from light to heavy systems, we can conclude that the increased flow leads to a cooling process favouring gradual ’liquefaction’. This is a non-trivial finding: from earlier experimental studies [17] a suppression of heavy fragment production in systems with strong collective expansion was inferred and theoretical works [18] have predicted that strong flow gradients would prevent coagulation. A similar behavior is seen in two-particle correlations where the effective radii of homogeneity are diminished by flow [19].
The data were taken at the SIS accelerator of GSI-Darmstadt using various heavy ion beams of GeV and the large acceptance FOPI detector [20, 21]. In the experiments involving the systems 40Ca+40Ca, 96Ru+96Ru, 96Zr+96Zr, and 197Au+197Au, particle tracking and energy loss determinations were done using two drift chambers, the CDC (covering laboratory polar angles between and ) and the Helitron (), both located inside a superconducting solenoid operated at a magnetic field of 0.6T. A set of scintillator arrays, Plastic Wall , Zero Degree Detector , and Barrel , allowed to measure the time of flight and, below , also the energy loss. All subdetector systems have full azimuthal coverage. Use of CDC and Helitron allowed the identification of pions, as well as good isotope separation for hydrogen and helium clusters in a large part of momentum space. The identification of heavier clusters (), by nuclear charge only, was restricted to the polar angles covered by the Plastic Wall and the Zero degree detector. In a second setup the Helitron was replaced by an array of gas ionization chambers [20], the PARABOLA, allowing charge identification of heavier clusters up to nuclear charge . The systems 58Ni+58Ni, 129Xe+CsI, 197Au+197Au were studied in this experiment. The data for Au on Au, measured with both setups, were found to be in excellent agreement. Further details on the detector resolution and performance can be found in [20, 21].
Collision centrality selection was obtained by binning distributions of the ratio, [22], of total transverse and longitudinal kinetic energies. In terms of the scaled impact parameter, , we choose the same centrality for all the systems: . We take as effective sharp radius and estimate from the measured differential cross sections for the distribution using a geometrical sharp-cut approximation. In this energy regime selections show better impact parameter resolution for the most central collisions than multiplicity selections [22, 23] and do not imply a priori a chemical bias. Autocorrelations in high transverse momentum population, that are caused by the selection of high values, are avoided by not including the particle of interest in the selection criterion.
The analysis of the particle spectra involves some interpolations and extrapolations ( in the worst case) to fill the gaps in the measured data. The two-dimensional method used to achieve this has been extensively tested with theoretical data generated with the transport code IQMD [28] applying apparatus filters. Details will be published elsewhere [29].
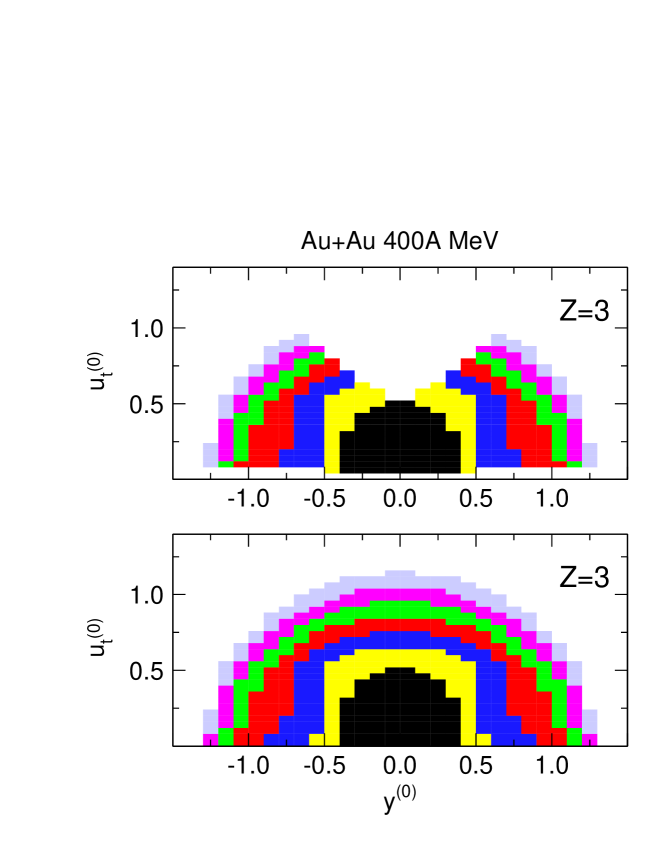
Since the present study is restricted to central collisions of symmetric systems, we require reflection symmetry in the center of momentum () and, use azimuthally averaged data. Choosing the as reference frame and orienting the z-axis in the beam direction the two remaining dimensions are characterized by the longitudinal rapidity , given by and the transverse component of the four-velocity , given by . Following common notation is the velocity in units of the light velocity and . Later we shall also use the transverse rapidity, , which is defined by replacing by in the expression for the longitudinal rapidity. The -axis is laboratory fixed and hence randomly oriented relative to the reaction plane, i.e. we average over deviations from axial symmetry. Throughout we use scaled units and , with , the index p referring to the incident projectile in the .
An example of a reconstructed distribution for emitted Li ions in central collisions of Au on Au is shown in Fig. 1. The lower part of this figure illustrates the result of the extrapolation to using the two-dimensional fit method.

Turning now to the presentation of results, we show in Fig. 2 charged particle multiplicity distributions as a function of nuclear charge . The data for four out of the six measured systems are plotted. As the surface of nuclei has a finite thickness one expects some degree of transparency even in collisions with perfect geometrical overlap. To minimize such ’corona’ effects, we show midrapidity data, . As observed earlier [22], we find that the heavy cluster () multiplicities, , decrease exponentially with the nuclear charge, i.e. , however, the slope parameter is seen to vary with the system-size (see Fig. 2 and Table 1): heavy cluster production is favoured for larger systems.
In the present context we refrain from calling heavy clusters (hc), , ’intermediate mass fragments’ (IMF), because in this energy regime they are, actually, the heaviest fragments (’droplets’) in central collisions. Charge balances show unambiguously that there is no heavy remnant () with a sizeable () probability (that one might be tempted to call ’liquid’). The slope parameters, obtained for the range , are listed in Table 1 both for the mid-rapidity data, , and the data, . For Ca+Ca reliable data beyond could not be obtained. The value for Au+Au can be compared with our earlier [22] value of which was obtained from a fit over a larger range. Although a different method to extrapolate to was used, the main reason for the modest deviation can be traced to the somewhat higher centrality achieved with the present setup compared with the ’PHASE I’ setup used in our earlier work, which covered only polar angles below .
If one were to interprete the slopes as being an indicator of a global freeze-out temperature of systems in chemical equilibrium, the qualitative conclusion would be that smaller systems appear to be hotter. We recall that all systems are studied at the same incident energy and for the same centrality, . However, in complex reactions leading to many outgoing channels with an apparently simple (exponential) statistical distribution, integrated charge distributions give limited information and therefore do not allow to draw convincing conclusions on the possible emergence of a final state in equilibrium.

| System | vart(Li) | ||||
|---|---|---|---|---|---|
| 40Ca + 40Ca | 0.42 | 0.133 | 0.094 | ||
| 56Ni + 40Ni | 1.44 0.07 | 1.63 0.08 | 0.75 | 0.32 | 0.117 |
| 96Zr + 96Zr | 1.441 0.046 | 1.49 0.06 | 1.55 | 0.84 | 0.139 |
| 96Ru + 96Ru | 1.415 0.042 | 1.37 0.06 | 1.65 | 0.89 | 0.144 |
| 108Xe + 133Cs127I | 1.276 0.040 | 1.336 0.044 | 2.29 | 1.35 | 0.147 |
| 197Au + 197Au | 1.224 0.043 | 1.217 0.044 | 4.66 | 2.99 | 0.177 |
More details of the mechanism at work are seen in Fig. 3 where we compare the evolution of the longitudinal and the transverse rapidity distributions (left and right panels, respectively) with system size for the ’gas’ (protons) which is prevalent for the light (surface-dominated) systems, and the ’droplets’ which appear in increasing numbers at mid-rapidity as the system-size increases (lower left panel), accompanied by a broadening of the transverse velocities (lower right panel). We plot the smoothened data emphasizing the gradual evolution with system size. The statistical errors are smaller than the symbol sizes, while the absolute systematic errors are . Relative errors are expected to be smaller by a factor of two or more.
Note that all yields in Fig. 3 are reduced to a constant system size of 100 nuclear charges by multiplying with , where is the total system charge. Closer inspection of the system-size evolutions in these reduced scales reveals two other noteworthy features: 1) The ’missing’ proton vapour in the heaviest system, that served as source of the developping clusters, is limited to smaller transverse rapidities, , see the upper right panel and note the enlarged abscissa scale in the lower right panel. 2) Except for the Ca+Ca system, heavy cluster production is system-size independent around longitudinal rapidities, , see the lower left panel. This latter point is not trivial, although ’universal’ features in the partition of excited spectator matter are well established [14]. In general, however,the collisions investigated in ref. [14] were more peripheral and ’spectators’ could be clearly identified as relatively narrow peaks in the longitudinal rapidity distributions near projectile (or target) rapidity. In the present cases of high centrality, spectator matter, if any, is not readily isolated in the measured rapidity distribution, except for the two-peak structures in the Ca+Ca reaction. But even in that case the evolution towards mid-rapidity is continuous. When we select more peripheral collisions ’spectator’ peaks appear in all systems and we observe [24, 25] at this energy the same universal features as in ref. [14].
A way to summarize the observations and at the same time confronting them with theoretical simulations is presented in Fig. 4. Starting with the lower left panel, we show the system-size dependence of the rapidity-integrated multiplicity, , of heavy clusters. Although we plot again reduced yields (to 100 incoming protons), we observe a remarkable linear increase: the least squares fitted straight line follows the data with an accuracy of (as mentioned earlier, the relative accuracy of the data points is expected to be better than the indicated systematic error bars). This means that the system-size dependence of has a term proportional to or (the system mass squared).
There is a small irregularity associated with the two data points due to Zr+Zr (), resp. Ru+Ru () which represents systems with the same total mass (), suggesting that besides the size dependence there is also an isospin dependence of heavy cluster production. The effect is however at the limit of the error margins and therefore will not be discussed any further in the present work.
Besides the term in , a second piece of information comes from looking at multiplicities, , confined to the midrapidity interval (see lower left panel of Fig. 4): the restricted data run parallel to the integrated data, showing that the quadratic term is associated virtually entirely with the midrapidity region. For comparison we also show the same midrapidity data before acceptance corrections. While the corrections are important, and enhance the effect, it is clear that they are not creating the effect. In the midrapidity region the reduced cluster production is about a factor 5.5 higher for Au+Au than for Ca+Ca. We note that for the lightest system, is still large compared to the most abundant heavy cluster. Of course the linear trends cannot go on indefinitely as the number of heavy clusters per hundred protons cannot exceed 33 by definition. We are far from this trivial limit, however.

We have also reduced by dividing by the sum of charges accumulated at midrapidity (), , rather than by the total system charge, . In this case the straight line fitted to the data (not plotted to avoid overloading the Figure) passes very close to the origin of the axes: the relationship reproduces the six data points with an accuracy of . This means that, well within our systematic errors, we can say that all the mid-rapidity heavy cluster production rises with the square of the number of ’participant’ nucleon number.
The associated observation of increasingly broad transverse rapidity distributions as the system size is increased, shown in Fig. 3, is summarized in the upper left panel of Fig. 4 where the variances of these distributions (taken for data within ) are plotted and also seen to rise linearly with the system size, although with an offset. The observables , and are also listed in Table 1. In a global thermal equilibrium picture the variance of rapidity (velocity) distributions is a measure of the temperature and hence, in this scenario, one would conclude that the heaviest system is the hottest system, in contradiction to our earlier conjecture, inferred from the observed partitions, that the lightest system is the hottest. A way out of this contradiction is to introduce radial flow: generated during the expansion, it is accompanied by a local cooling. This mechanism is seen to be stronger for bigger systems. Radial flow, assessed by modelling hydrodynamic expansion [26], or treated phenomenologically [22], has been introduced by our Collaboration with some success in describing the deviations of momentum space distributions from a global thermal scenario, notably the fragment mass dependences. But some inconsistency in accounting for the cluster yields [22] remained. This difficulty could be due to the failure of correctly accounting for non-equilibrium effects caused by the coronae of the nuclei and, more generally, by partial transparency [16].
In principle, such non-equilibrium effects can be handled by simulation codes based on transport theory [27]. We have used the code IQMD [28] based on Quantum Molecular Dynamics [30], QMD, to see if we could reproduce the features of our data. Clusters are identified after a reaction time of 200 fm/c using the minimum spanning tree algorithm in configuration space with a coalescence radius of 3 fm. For each system-energy we have generated 50000 IQMD events over the complete impact parameter range which were subsequently sorted using the criterion to obtain an event class with comparable centrality to that selected in the experiment. The reduced heavy cluster multiplicities ( integrated or at mid-rapidity) versus system size are plotted in the lower right panel of Fig. 4. As in our earlier studies [22], we find that IQMD, as well as other realizations of QMD [31], underestimates cluster production: the yields in the Figure are multiplied by a factor of three. However, qualitatively, the experimental size dependence is reproduced, including the dominant effect of mid-rapidity emissions in accounting for the linear rise. The associated rise of the variance of the transverse rapidity with system size is reproduced almost quantitatively. In this context it is useful to realize that the nuclear stopping phenomenon, as quantized by the shape of proton and deuteron longitudinal rapidity distributions is rather well described by IQMD [32] at incident energies around MeV. For heavy clusters the simulations also reproduce the yields near projectile (target) rapidity: the underestimation concerns mid-rapidity emissions and might be a general deficiency of semiclassical approaches such as IQMD that tend to converge towards Boltzmann statistics after many single nucleon collisions (leading to mid-rapidity population) rather than conserving the initial Fermi-destribution of nucleons.
To shed some light into the cluster creation mechanism, we have performed, for Au+Au, a calculation where the elementary nucleon-nucleon cross sections were raised by a factor two. The results (full squares marked ’’ in the right panels) show an increased transverse rapidity variance, as one would expect from the increase of the elementary collision frequency, but also a rise of the heavy cluster multiplicity, shown for the interval , supporting our observation that cluster production is in a direct correlation with flow. The introduction of more copious binary interactions increases the adiabaticity (and hence the cooling effect) of the expansion in a twofold way: 1) the local equilibration is faster and 2) the expansion is slower (since the diffusion time is larger). Clearly, we have found evidence for the ’second process’ suggested in [13] where nucleon-nucleon interactions act as seeds for self-organization leading to new clusters.
A key question is whether cluster production is sensitive to relevant features in the nuclear phase diagram, in particular to the existence and location of a critical point and of liquid-vapor coexistence curves. When using the IQMD code with its two available momentum dependent Equations of State, EOS, as input, a so-called ’stiff’ one with an incompressibility MeV around saturation density, or alternatively a ’soft’ EOS, MeV, we find sensitivity of cluster production. While all calculations presented so far in Fig. 4 were done with the soft EOS, one calculation, again for Au+Au, was performed assuming a stiff EOS: see the open squares (marked ’HM’) in the right panels of Fig. 4. The variance is little changed, i.e. it is caused primarily by the nucleon-nucleon collision frequency which is only indirectly affected by switching to another (mean field) EOS. Cluster production in the interval , however, is lowered when assuming a stiff EOS.
It is too early to draw specific conclusions from this potentially interesting finding. What is missing, so far, is the underlying phase diagram implied by IQMD in its various options. Recently it was shown [33] with codes based on Antisymmetrized Molecular Dynamics (AMD) that caloric curves can be predicted in controlled scenarios (fixed volume or pressure). This presents an important and necessary link between microscopic models for equilibrium thermodynamics (and nuclear structure as well) and the complex dynamic situation found in heavy ion collisions.
In summary, cluster production has been investigated in central collisions of Ca+Ca, Ni+Ni, 96Zr+96Zr, 96Ru+96Ru, Xe+CsI and Au+Au reactions at incident energy. We find that the multiplicity of clusters with charge , when reduced to the same number of available charges, grows linearly with system size and is associated with a mid-rapidity source with increasing transverse velocity fluctuations. An increase by about a factor of 5.5 is observed in the mid-rapidity region between the lightest system (Ca+Ca) and the heaviest one (Au+Au). The results, as well as simulations using Quantum Molecular Dynamics, suggest a collision process where droplets are created in an expanding, gradually cooling, nucleon gas. Expansion dynamics, collective radial flow and cluster formation are closely linked resulting from the combined action of nucleon-nucleon scatterings and the mean fields.
Finally, we note that global stopping and directed sideflow data are available for the same systems [16]. The simultaneous reproduction of both ’repulsive’ observables (sideflow) and ’attractive’ observables (radial flow and its effect on the degree of clusterization) with the same transport code will be a challenging task. The reward, hopefuly, will be a more precise mapping of the nuclear phase diagram, including the liquid-vapour transition, than was possible in the past.
This work was supported in part by the French-German agreement between GSI and IN2P3/CEA (project No 97-27).
References
- [1] W. A. de Heer, Rev. Mod. Phys. 65 (1993) 611.
- [2] J. Pochodzalla, et al., Phys. Rev. Lett. 75 (1995) 1040.
- [3] J. Natowitz, et al., Phys. Rev. Lett. 89 (2002) 212701.
- [4] P. Chomaz, F. Gulminelli, Prog. Theo. Phys. Suppl. 146 (2002) 135.
- [5] B. Borderie, J. Phys. G 28 R217 (2002).
- [6] M. D’Agostino, et al., Phys. Lett. B 473 (2000) 219.
- [7] L. Moretto, et al., Phys. Rev. C 66 (2002) 041601(R).
- [8] J.B. Elliott, et al., Phys. Rev. Lett. 88 (2002) 042701.
- [9] M. Kleine Berkenbusch, et al., Phys. Rev. Lett. 88 (2002) 022701.
- [10] V.A. Karnaukhov, et al., Phys. Rev. C 67 (2003) 011601.
- [11] C. Williams, et al., Phys. Rev. C 55 (1997) 2132; Phys. Rev. C 59 (1999) 552.
- [12] B. Borderie, et al., Phys. Rev. Lett. 86 (2001) 3252.
- [13] J.P. Bondorf, D. Idier and I.N. Mishustin, Phys. Lett. B 359 (1995) 261.
- [14] A. Schüttauf, et al., Nucl. Phys. A 607 (1996) 457.
- [15] L. Beaulieu, et al., Phys. Rev. C 54 (1996) 973.
- [16] W. Reisdorf, et al, submitted for publication.
- [17] G.J. Kunde, et al., Phys. Rev. Lett. 74 (1995) 38.
- [18] Sh. Chikazumi, et al., Phys. Rev. C 63 (2001) 024602.
- [19] U. Heinz, B. V. Jacak, Annu. Rev. Nucl. Part. Sci. 49 (1999) 529.
- [20] A. Gobbi, et al, Nucl. Inst. Meth. A 324 (1993) 156.
- [21] J. Ritman, et al, Nucl. Phys. B (Proc.Suppl.) 44 (1995) 708.
- [22] W. Reisdorf, et al, Nucl. Phys. A 612 (1997) 493.
- [23] S.C. Jeong, et al, Phys. Rev. Lett. 72 (1994) 3468.
- [24] B. de Schauenburg, Ph-D thesis, Strasbourg, France, IReS 99-06 (1999).
- [25] W. Reisdorf in Proc. Int. Conf. Clustering Aspects of Nuclear Structure and Dynamics, Rab, June 14-19 (1999), World Scientific Publishing Co., 2000, p.323; eds. M.Korolija, Z.Basrak and R.Caplar.
- [26] M. Petrovici, et al, Phys. Rev. Lett. 74 (1995) 5001.
- [27] G. F. Bertsch, S. Das Gupta, Phys. Rep. 160 (1988) 189.
- [28] C. Hartnack, et al., Eur. Phys. J. A 1 (1998) 151.
- [29] W. Reisdorf et al., to be published.
- [30] J. Aichelin, Phys. Rep. 202 (1991) 233.
- [31] M. B. Tsang, et al, Phys. Rev. Lett. 71 (1993) 1502.
- [32] B. Hong, et al., Phys. Rev. C 66 (2002) 034901.
- [33] T. Furuta, A. Ono, nucl-th/0305050v1