ESTIMATION OF THE AMOUNT OF THE NUCLEAR TRANSFORMATION PRODUCTS FORMED UNDER EXPLOSION-INDUCED COMPRESSION OF A SUBSTANCE TO THE SUPERDENSE STATE
Abstract
In the present work carried out at the Electrodynamics Laboratory “Proton–21” with the use of X-ray electron probe microanalysis (XEPMA) and glow-discharge mass spectrometry (GDMS) techniques, we study the chemical composition of a substance formed as a result of the explosion-induced compression of solid targets and deposited on the surfaces of accumulating screens. We established that the explosion products contain chemical elements which were not included in the composition of the initial materials of targets and accumulating screens or were included in them as impurities in quantities by 3…7 and more orders in magnitude less than those detected after the experiment. We show that the appearance of “new” chemical elements on the surfaces of accumulating screens is not connected, first, with their redistribution from the bulk of a very accumulating screen, a target, or structural details of the experimental chamber which participated in the explosion initiation and, secondly, is not caused by the processes of deposition from the residual atmosphere of the vacuum chamber or by the transfer from the shell walls (from the structural details which were present in the experimental chamber but did not participate in the process of explosion). The estimated values of the total mass and the total number of atoms of all the chemical elements, which appeared as the result of the explosion of one target manufactured of pure Cu, or Pb, or Ag and were located only on the surface of the most enriched central part of an accumulating screen of about 5 mm in diameter, are approximately g and atoms, respectively. We conclude that the regular appearance of chemical elements, which were not included in the composition of the initial materials of targets and accumulating screens, in the explosion products is the consequence of a nuclear transformation of a part of their material, i.e., is the fact testifying to both the running of the nucleosynthesis reactions upon the explosion-induced destruction of targets and to the first realized possibility of controlled creation of the conditions for their running in a laboratory setup.
INTRODUCTION
From 1999 till the present time, the staff of the Electrodynamics Laboratory “Proton–21” carries on the experiments on the explosion-induced compression of a substance, which leads to the creation of superdense states. Till October 2003, over 5000 dynamical impact compressions of solid targets were performed at the Laboratory. The goal of these experiments is the verification of the preliminarily theoretically justified hypothesis of the possibility to initiate, by using the pulse coherent action on a solid substance, the self-organizing process of avalanche-like self-densification up to the state of collapse (of the electron-nucleus plasma), in which the conditions for the running of collective many-particle nuclear reactions arise due to the effective screening of the Coulomb barrier. For the verification of this hypothesis, the Laboratory’s staff constructed the experimental setup which is able to transfer up to 1 kJ of energy to a solid target for a pulse duration of about 10 ns with the help of the electron beam used as a primary carrier of the concentrated energy. At the culmination stage of the process, the microvolume of the target substance was compressed up to a density of above cm-3. In this case, the power density in the region of compression exceeded, by various estimations, W/cm3.
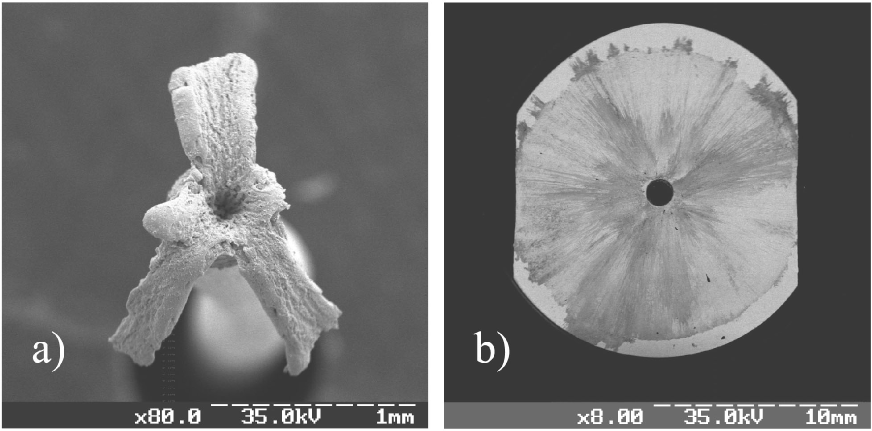
The impact compression of a target was realized in vacuum of about Pa and led to its fracture by the explosion from inside. This process was usually accompanied by the radial dispersion of a target material with its deposition on a special accumulating disk-like screen of about 15 mm in diameter and 0.5 mm in thickness. Fig. 1 presents the photos of both a typical target after the explosion (a) and a typical accumulating screen with deposited products of the explosion (b) which were derived with a scanning electron microscope in the secondary-electron mode. By using the method of scanning electron microscopy (SEM), we established that the products, which remained in the target crater and precipitated on accumulating screens, formed a layer of irregularly distributed drops, splashes, films, particles, and other micro- and nanoobjects with complicated morphology.
Because the explosion products are microobjects, we firstly studied them mainly with local methods. To investigate their element and isotope compositions, we used X-ray electron probe microanalysis (XEPMA), local Auger electron spectroscopy (AES), laser mass spectrometry (LMS), and secondary-ion mass spectrometry (SIMS). By using the methods of mass spectrometry, we discovered deviations of the isotope composition from the natural abundance of isotopes for a number of chemical elements contained in these products Adamenko and Adamenko (2002); Adamenko (2003). While studying the chemical composition of products of the explosion by XEPMA, AES, and SIMS, we registered up to several tens of chemical elements in significant amounts in every analysis [including those cases where both a target and an accumulating screen were made of a single chemical element maximally purified from impurities, e.g., Cu (99.99 mass. %), Ag (99.99 mass. %), Pb (99.75 mass. %), and others]. These elements were not found by high-sensitivity analytical methods in the initial materials of targets and accumulating screens or were present in them as impurities but at concentrations by 3…7 orders and more less than those measured after the experiment Adamenko and Adamenko (2002); Adamenko (2003). Moreover, while studying the specimens by AES, we registered a collection of Auger-peaks which cannot be referred, on the one hand, to artefacts of the analysis and, on the other one, be related to any Auger-peaks of the known chemical elements Adamenko and Adamenko (2002). The mentioned Auger-peaks were referred by us in the scope of the known part of the Periodic table to basically unidentifiable peaks. As one of the variants of the interpretation of the revealed unidentifiable Auger-peaks, the assumption as for their affiliation to long-lived transuranium elements was discussed in Adamenko and Adamenko (2002).
In authors’ opinion, all the above-presented facts point unambiguously to the running of the artificially initiated intense processes of nucleosynthesis and transmutation of chemical elements in the microvolume of the target substance undergone to the impact compression to superhigh densities. The key fact is, undoubtedly, the appearance of chemical elements, which were absent in the composition of the initial materials of targets and accumulating screens (the structural details of the experimental chamber which participated in the process of explosion), in the explosion products. The justification of this fact is the main goal of the present work.
I MATERIALS AND METHODS
To solve the posed problem, we used such methods of quantitative determination of the element composition of a substance as XEPMA and GDMS.
The studies based on XEPMA were carried out on an X-ray REMMA–102 microanalyzer (SELMI, Sumy, Ukraine) equipped with two wavelength dispersion X-ray spectrometers and one energy-dispersion X-ray spectrometer [with a Si(Li) detector]. Spectra were registered at a 35-keV accelerating voltage of the electron beam, a probe current of 0.1 nA, and a residual pressure of Pa in the specimen chamber. The range of energies registered by an energy-dispersion spectrometer was 0.9…30 keV, the energy resolution on the line MnKα at the counting rate up to 1000 pulse/sec was 150 eV, and the typical time of the registration of spectra was 200…400 sec. For the quantitative analysis, we used a standard computer program for the calculation of the concentrations of elements developed by the firm-producer of the device (SELMI).
To analyze the element composition, we used a high-sensitivity glow-discharge mass spectrometer (with Ar plasma) VG 9000 (VG Elemental, UK). The current and voltage of discharge were, respectively, 1.8 mA and 1.1 kV. As a holder, we used a cell for plane specimens without cooling which ensures the analyzed region diameter to be 5 mm. The residual pressures in the specimen chamber and in the spectrometer were, respectively, at most and Pa. The ion beam was accelerated by a voltage of 8 kV. The spectrometer possesses the range of analyzed masses 1…250, and its mass resolution at the half-height of the Cu mass-peak is at the level of 7000…9000. For the quantitative analysis, we used a standard computer program for the calculation of the concentrations of elements developed by the firm-producer of the device (VG Elemental).
In the present work, we studied the accumulating Cu screens in both the initial state and after the deposition of the explosion products on them (see Fig. 1, b). In fact, a screen served as a substrate. The explosion products were deposited on one of its surfaces as a layer which possessed a weakly pronounced relief and was characterized by the axial symmetry. In the central part of an accumulating screen, we can see an area in the form of a pit of m in depth relative to the screen surface and about mm in diameter (Fig. 1, b, and 6). Its formation was caused by the entrainment of the screen material as a result of the explosion of a target. Accumulating screens were used to be as-received, i.e., they were not undergone, prior to the analysis, to any damaging cleaning procedures or those changing their composition. As materials for targets in the present study (wires of 0.5 mm in diameter; see Fig. 1, a), we chose Cu, Pb, and Ag.
For the solution of special tasks, we manufactured assemblies or “sandwiches” gathered from 20–30 accumulating screens closely fitting one another. In this case, we carried out the analysis on the lateral side of an assembly, i.e., on the edges of accumulating screens. Such a structure of specimens and the analysis scheme guarantee a sufficient averaging over inhomogeneities of the composition of materials of the very accumulating screens and over those of the explosion products. We note that a homogeneous specimen was necessary for the correct application of such a destructive method of analysis as GDMS, in which the registration of the ion currents of various chemical elements (isotopes) was implemented by the successive scheme.
II RESULTS AND DISCUSSION
The studies of the composition of products of the explosion of targets, the determination of chemical elements appeared due to the explosion, and the estimation of the number of atoms of such chemical elements were carried out at the Laboratory beginning from the first stages of the Project. The objects of these studies were the layer formed by the explosion products deposited on an accumulating screen or the layer remained in the target crater after the explosion. At first, we believe that local methods of analysis are most suitable for studying these objects. Indeed, the chemical elements which are contained in trace amounts in microobjects can be easily detected by local methods and, at the same time, be beyond the detection limit of even very sensitive integral methods. However, further, the necessity to use also integral methods of analysis becomes obvious. By using namely integral methods for the comparison of the composition of a whole accumulating screen prior to and after the explosion of a target and by considering the composition of the target material transferred on the accumulating screen, we can prove that the appearance of chemical elements in the explosion products which were absent in perceptible quantities in the initial materials of both the target and accumulating screen is the result of nucleosynthesis rather than that of their redistribution from the bulk of the accumulating screen or target.
At the same time, we note that even if the use of integral methods solves the posed problem on the whole, their results do not include completely the results derived by local methods. On the one hand, local methods give the important information as for the abundance area of newly appeared chemical elements and the character of their distribution there. On the other one, the comparison of the estimations of a required quantity which were derived by different methods supplementing one another seems to be very interesting and useful.
On the XEPMA-based determination of the number of atoms of the chemical elements appeared on an accumulating screen as a result of the target explosion, we took pure copper (Cu, 99.99 mass %) as the material of both the target and accumulating screen. As an example, we consider the study of the surface layer of accumulating screen No. 5094. The estimation of the number of atoms of the foreign chemical elements (except for Cu) was realized in two stages. At first, we counted the number of atoms in the particles lying on the screen surface and then in the enriched m-thick surface layer of the matrix; the values derived in this way then were summed. The indicated thickness of the enriched surface layer of the matrix was evaluated from the data on the profiles of concentrations through depth of accumulating screens by SIMS.
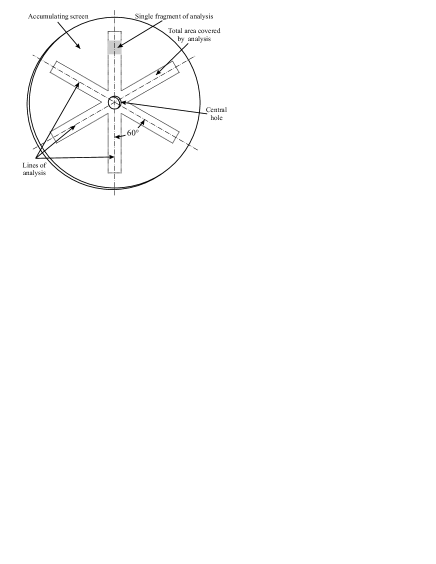
Below we describe the procedure and results of the first stage. The scheme is presented in Fig. 2. An analyzed area was a raster (a square) of m in size. On it, we counted the number of all particles, analyzed their composition with an sharp probe, and determined the number of atoms for each foreign chemical element at each particle. Then the analyzed area was shifted by a step equal to its side length along one of the lines where the analysis was performed. Such lines formed an angle of with one another (see Fig. 2). Having performed this procedure, we registered 417 spectra derived on different particles. By virtue of the axial symmetry, we assumed that all the lines of analysis are equivalent and total analyzed area along them is representative for the whole accumulating screen.
We estimated the total number of particles on the whole accumulating screen surface as
| (1) |
where and are, respectively, the total area of the accumulating screen and the total area of the analyzed region, and is the total number of the analyzed particles. We determined the numbers of atoms of the -th foreign chemical element in the -th particle. Then we calculated the mean number of atoms of the -th foreign chemical element per particle by the formula
| (2) |
With regard for Eq. 2, we were able to estimate the total number of atoms of the i-th foreign chemical element contained in the particles on the whole accumulating screen surface as
| (3) |
The values derived as the result of processing the spectra are given in Table 1.
| Number of | Number of | ||
|---|---|---|---|
| Element | atoms per | Element | atoms per |
| specimen | specimen | ||
| Mg | 3.06E+15 | Y | 2.04E+14 |
| Al | 9.08E+16 | Zr | 2.75E+13 |
| Si | 3.19E+16 | Ag | 6.14E+15 |
| P | 9.07E+15 | Cd | 2.20E+15 |
| S | 1.94E+16 | In | 1.92E+15 |
| Cl | 6.70E+16 | Sn | 1.61E+16 |
| K | 2.19E+16 | Te | 1.39E+15 |
| Ca | 1.28E+16 | Ba | 2.43E+15 |
| Ti | 3.48E+15 | La | 7.16E+14 |
| V | 5.08E+13 | Ce | 2.51E+15 |
| Cr | 2.40E+15 | Pr | 1.52E+14 |
| Mn | 5.89E+14 | Ta | 4.15E+15 |
| Fe | 5.11E+16 | W | 2.27E+16 |
| Co | 3.88E+14 | Au | 5.67E+15 |
| Ni | 2.07E+14 | Pb | 1.90E+17 |
| Zn | 2.87E+16 | ||
| TOTAL | 5.99E+17 |
Finally, by summing all values given in Table 1, we got the total number of atoms of the foreign chemical elements contained in all particles placed on the whole surface of accumulating screen No. 5094 as
| (4) |
By an similar scheme, we determined the number of atoms of the foreign chemical elements contained in the enriched surface layer of the accumulating screen matrix. In this case, we chose a raster to be m in size. The less area was taken in order to more easily find the areas of the screen surface positioned along the lines of analysis and containing no particles. We registered the spectra over the whole area of a raster and the number of these spectra registered from different analyzed areas was 113. We recall that the elementary analyzed region of the surface layer of the accumulating screen was m in size with a thickness of about m (the range of depths of the specimen from which we registered X-ray emission).
As above, first, we calculated the amount of the foreign chemical elements in the analyzed region and then, with regard for the ratio of the area of the the screen surface to that of the analyzed region, recounted in the amount of the foreign chemical elements contained in the surface layer of the matrix of the whole screen. The results are given in Table 2.
| Number of | Number of | ||
|---|---|---|---|
| Element | atoms on | Element | atoms on |
| specimen | specimen | ||
| Al | 2.13E+17 | Ca | 5.44E+15 |
| Si | 6.62E+16 | Mn | 8.77E+14 |
| P | 1.09E+16 | Fe | 3.57E+16 |
| S | 1.01E+17 | Zn | 4.63E+16 |
| Cl | 7.60E+16 | Pb | 6.22E+15 |
| K | 3.10E+16 | ||
| TOTAL | 5.93E+17 |
As above, by summing the values from Table 2, we get that the total number of atoms of the foreign chemical elements contained in the surface layer of the matrix of the whole accumulating screen is
| (5) |
Now with regard for Eq. 4 and Eq. 5, we get that the total number of atoms of the foreign chemical elements appeared on accumulating screen No. 5094 as the result of the explosion of a target and the number of nucleons in them are, respectively,
| (6) | |||||
| (7) |
Analyzing the results derived (see Eq. 4 and Eq. 5), we note that the character of the distribution of foreign chemical elements appeared on the accumulating screen surface is such that exactly a half of them is contained in the particles placed on it and the other half belongs to the surface layer of the matrix of at most m in thickness. It is easy to calculate that the mentioned number of foreign atoms corresponds to their concentration in the analyzed surface layer of the accumulating screen to be about 3 mass %. With regard for the purity of the initial materials of the accumulating screen and target (99.99 mass %), the last fact means that it is senseless to correct the derived value for the content of impurities in the initial material of the screen and in the transferred material of the target.
Thus, the derived value does correspond to the number of foreign atoms appeared on the accumulating screen as the result of the explosion of a target. But if we conclude, by basing on this value that the appeared foreign atoms were generated only in the course of nucleosynthesis, such an assertion can be hardly named sufficiently strict. In our opinion, two quite weak points are present in the above reasoning. On the one hand, the derived value is not the result of a direct measurement, but it is based on a number of statistical hypotheses and model ideas of the morphology of the surface layer of the accumulating screen whose degree of reliability and adequacy can be, generally saying, called in question. In other words, it is very difficult to estimate the accuracy of the derived value, though we are sure that its order is estimated properly. On the other hand, the very procedure of derivation of the required value does not exclude theoretically the possibility of that the foreign atoms can appear on the surface layer of the accumulating screen through the redistribution of impurities from the bulk of the very accumulating screen as the result of target explosion rather than be the result of a nuclear transformation of its material.
In our second investigation, we tried to overcome the mentioned drawbacks of the first experiment. For the analysis of the element composition, we used the highly sensitive method of GDMS. By its gist, this method is integral (we chose the diameter of an analyzed region to be 5 mm), and its application with the purpose to find the number of foreign atoms appeared on the accumulating screen does not require to use any model ideas of the morphology and structure of its surface. In other words, in the evaluation of the required quantity, the method can be used in such a way that this quantity will be found as the result of a direct measurement.
As for the effect of redistribution of the composition of an accumulating screen, we can take it into account, for example, if we take the scheme of analysis such that, within it, the composition of the whole accumulating screen is registered rather than that of the surface layer. In this case, the composition of the accumulating screen should be registered twice: in the initial state and then after the explosion of a target. If the mentioned compositions will be identical, the enrichment of the surface layer of the screen occurs due to the redistribution of its composition over the specimen volume. But if the content of minor elements in the accumulating screen composition increases after the explosion of a target, we can say about the appearance of the atoms of foreign chemical elements and count their amount.
Consider the proposed scheme of analysis. Fig. 3 shows schematically the cross section of an accumulating screen. There we also drew the region of analysis in the case where the analysis procedure begins from that side of the screen on which the film from products of the explosion of a target is deposited. It is obvious that the depth of the analyzed region varies depending on the duration of etching. In the case where the condition
| (8) |
holds, where is the film thickness, the results of measurement correspond to the film composition. If satisfies the condition
| (9) |
where is the specimen thickness, the film composition is affected by that of the substrate in the increasing degree, and the results of measurement lose any significant physical sense. Finally, consider the situation with
| (10) |
In this case, the results of measurement correspond to the composition of an accumulating screen. The indicated case can be uniquely characterized with the geometric factor equal to the ratio of the area of a cross section of the film to the area of a cross section of the whole accumulating screen . It is obvious that satisfies the relation
| (11) |
In view of the real situation, we may take the values of 2 and m for the film thickness and the specimen thickness , respectively. Then the geometric factor
| (12) |
At first sight, it seems that we can determine the total composition of the accumulating screen following the presented scheme of analysis if relation (Eq. 10) is satisfied. However, its realization meets some difficulties related to the fact that a mass spectrometer with magnetic mass analyzer is constructed so that only those ions can be registered at a given moment which are characterized by a specific nominal mass number defined by the magnetic induction of the field in the mass analyzer. Therefore, in order to register the whole mass spectrum of a specimen, we need to successively scan the whole mass range. In this case, of course, it is necessary that the specimen under study be homogeneous by composition, at least, through depth in order that the registered spectrum have any physical meaning. Otherwise, we can find themselves in the situation, e.g., where we etch a specimen throughout and fail to register any mass-peak in the spectrum. Such a situation would occur in the case of a layered specimen, in which the layers from pure chemical elements are placed in the order of a decrease in their mass numbers with increase in depth, i.e., in the order inverse to that of scanning the mass range by the magnetic analyzer.

The above-indicated difficulties can be avoided in the following way. We prepared the specimen as an assembly made of several accumulating screens. It was constructed so that, first, it had a homogeneous composition in the direction from the analyzed surface through depth and, secondly, the analyzed region on the analyzed surface possessed the geometric factor . If both these conditions are satisfied, the procedure of registration of mass-spectra is correct and the results of analysis reflect the composition of accumulating screens.
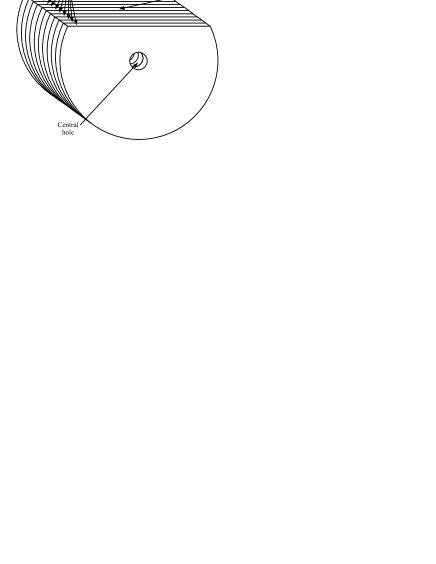
Fig. 4 represents schematically a variant of an assembly made of accumulating screens: the so-called “sandwich” which obviously satisfies the first condition mentioned above. Indeed, while passing through depth from the analyzed surface even at a distance of the order of several hundreds of m, this specimen can be considered to be homogeneous with quite high accuracy.

At last, we should like to clarify the situation concerning the geometric factor upon the determination of the composition of a specimen of the “sandwich” type. The analysis scheme is given in Fig 5. It is obvious that the geometric factor for a “sandwich” satisfies the relation
| (13) |
where is the cross section area of all films being in the analyzed region and is the area of the analyzed region. Since m, we get
| (14) |
It is obvious that
| (15) |
where is the length of all film layers being in the analyzed region. Now the entire problem is reduced to the determination of . In Fig. 5, all the layers being in the analyzed region are enumerated from 1 to 10. Assume that the 1st layer is shifted relative to the center of the analyzed region by . Then, we can write
| (16) |
where is the length of the -th layer, which can be found by the Pythagoras theorem. By substituting Eq. 16 in Eq. 15, we can find . It turns out that does not depend on and has the same value for any from the interval :
| (17) |
Finally, by substituting Eq. 17 and Eq. 14 in Eq. 13, we find the value of the geometric factor on a “sandwich”:
| (18) |
Thus, we may infer that a construction of the “sandwich” type specimen and the proposed scheme of analysis satisfy two conditions formulated above, which means that we can correctly determine the composition of accumulating screen in the “sandwich” type specimen.
| Specimen | Mass loss, mg | |
|---|---|---|
| number | Screen | Target |
| 6383 | 4.73 | 4.86 |
| 6799 | 3.22 | 1.72 |
| 6775 | 4.90 | 2.16 |
| 6776 | 5.11 | 1.44 |
| 6778 | 5.09 | 3.52 |
| 6779 | 4.39 | 3.79 |
| 6783 | 3.85 | 1.09 |
| 6784 | 3.04 | 3.13 |
| 6788 | 4.41 | 3.02 |
| 6793 | 3.75 | 1.24 |
| Average | 4.25 | 2.60 |
In the second investigation, the initial material of accumulating screens was, as earlier, Cu, and we took Pb for targets. By the GDMS data, the total content of impurities in lead was 0.04 mass %. By the results of weighting, the mean losses of the target mass after the explosion, , and the mass of the accumulating screen dispersed by the explosion plasma, , were about 2.60 and 4.25 mg, respectively (see Table 3). The “sandwich” was gathered from 20 halves of accumulating screens processed by explosions (see Table 3), whose blanks were cut from the same Cu sheet. As the specimen of the initial material of an accumulating screen, we took blank No. 6815 cut from the same sheet.
The composition of the initial material of an accumulating screen was determined four times by GDMS on the blank mentioned above. The averaged results of measurements are presented in Table 4, where we also show the composition of the accumulating screen after the explosion of the Pb target which was averaged over the results of 4 measurements on the “sandwich.” All 4 measurements were performed on the same place in the central region of the analyzed surface on the “sandwich” (see Fig. 4) successively one after another, i.e., the determined composition corresponds to the central area of the accumulating screen.
| Element | Concentration, mass % | Element | Concentration, mass % | ||||
|---|---|---|---|---|---|---|---|
| Initial | “Sandwich” | Increment | Initial | “Sandwich” | Increment | ||
| H | 1.30E-06 | 4.81E-06 | 3.52E-06 | Rh | 1.26E-05 | 6.43E-05 | 5.17E-05 |
| He | 3.81E-06 | 4.22E-06 | 4.11E-07 | Pd | 1.97E-05 | 4.44E-05 | 2.47E-05 |
| Li | 2.63E-06 | 1.33E-05 | 1.07E-05 | Ag | 2.48E-03 | 2.90E-03 | 4.17E-04 |
| Be | 1.48E-06 | 2.19E-04 | 2.18E-04 | Cd | 7.38E-05 | 1.31E-04 | 5.68E-05 |
| B | 2.64E-05 | 1.16E-04 | 8.95E-05 | In | 6.83E-06 | 1.21E-05 | 5.26E-06 |
| C | 3.80E-04 | 2.22E-03 | 1.84E-03 | Sn | 6.53E-04 | 2.26E-04 | -4.27E-04 |
| N | 5.80E-04 | 4.55E-03 | 3.97E-03 | Sb | 4.68E-04 | 3.86E-04 | -8.15E-05 |
| F | 7.28E-05 | 1.83E-04 | 1.10E-04 | I | 1.66E-06 | 1.27E-05 | 1.11E-05 |
| Ne | 1.67E-06 | 2.25E-06 | 5.84E-07 | Te | 1.48E-04 | 2.65E-04 | 1.17E-04 |
| Na | 1.98E-04 | 7.21E-03 | 7.01E-03 | Xe | 1.48E-05 | 5.63E-05 | 4.15E-05 |
| Mg | 2.49E-05 | 2.60E-04 | 2.35E-04 | Cs | 2.46E-06 | 3.50E-06 | 1.03E-06 |
| Al | 1.99E-06 | 2.48E-04 | 2.46E-04 | Ba | 6.94E-05 | 2.12E-05 | -4.82E-05 |
| Si | 7.50E-07 | 4.57E-04 | 4.56E-04 | La | 1.23E-06 | 1.64E-06 | 4.04E-07 |
| P | 1.80E-02 | 2.40E-02 | 5.96E-03 | Ce | 1.39E-06 | 2.80E-06 | 1.40E-06 |
| S | 3.71E-03 | 5.38E-03 | 1.67E-03 | Pr | 1.33E-06 | 4.72E-06 | 3.39E-06 |
| Cl | 1.08E-03 | 6.54E-02 | 6.43E-02 | Nd | 8.70E-06 | 1.42E-05 | 5.51E-06 |
| K | 6.71E-07 | 1.15E-04 | 1.15E-04 | Sm | 8.60E-06 | 1.69E-05 | 8.31E-06 |
| Ca | 6.91E-04 | 4.25E-03 | 3.56E-03 | Eu | 2.57E-06 | 4.41E-06 | 1.84E-06 |
| Sc | 1.17E-05 | 8.49E-05 | 7.32E-05 | Gd | 8.63E-06 | 1.05E-05 | 1.84E-06 |
| Ti | 8.11E-06 | 1.23E-03 | 1.23E-03 | Tb | 1.16E-06 | 2.28E-06 | 1.12E-06 |
| V | 1.24E-06 | 4.39E-05 | 4.27E-05 | Dy | 6.60E-06 | 6.06E-06 | -5.48E-07 |
| Cr | 1.97E-05 | 9.22E-06 | -1.05E-05 | Ho | 1.32E-06 | 2.53E-06 | 1.21E-06 |
| Mn | 4.77E-05 | 8.67E-05 | 3.91E-05 | Er | 5.46E-06 | 5.25E-06 | -2.09E-07 |
| Fe | 4.76E-03 | 1.15E-02 | 6.76E-03 | Tm | 2.06E-06 | 2.40E-06 | 3.40E-07 |
| Co | 6.61E-06 | 1.09E-04 | 1.02E-04 | Yb | 7.28E-06 | 2.08E-05 | 1.36E-05 |
| Ni | 1.18E-03 | 1.24E-03 | 5.74E-05 | Lu | 1.38E-06 | 8.96E-07 | -4.86E-07 |
| Cu | 9.9960E+01 | 9.9173E+01 | -7.8700E-01 | Hf | 8.36E-06 | 1.14E-05 | 3.08E-06 |
| Zn | 5.27E-05 | 1.49E-04 | 9.63E-05 | Ta | 3.65E-04 | 4.96E-04 | 1.32E-04 |
| Ga | 8.63E-06 | 1.59E-04 | 1.50E-04 | W | 7.59E-06 | 3.41E-03 | 3.40E-03 |
| Ge | 1.21E-04 | 5.63E-04 | 4.42E-04 | Re | 1.54E-05 | 7.93E-06 | -7.49E-06 |
| As | 2.13E-04 | 8.46E-05 | -1.29E-04 | Os | 4.04E-06 | 6.03E-06 | 1.99E-06 |
| Se | 1.19E-04 | 7.37E-04 | 6.18E-04 | Ir | 3.27E-06 | 1.71E-06 | -1.56E-06 |
| Br | 2.13E-05 | 3.39E-05 | 1.26E-05 | Pt | 7.58E-06 | 3.18E-06 | -4.40E-06 |
| Kr | 1.49E-05 | 1.86E-05 | 3.64E-06 | Au | 3.35E-06 | 1.56E-05 | 1.22E-05 |
| Rb | 6.26E-04 | 2.76E-04 | -3.50E-04 | Hg | 4.16E-04 | 9.02E-04 | 4.87E-04 |
| Sr | 2.20E-06 | 3.30E-06 | 1.10E-06 | Tl | 5.09E-06 | 1.57E-05 | 1.06E-05 |
| Y | 2.65E-06 | 5.18E-06 | 2.53E-06 | Pb | 8.20E-04 | 6.86E-01 | 6.86E-01 |
| Zr | 6.11E-06 | 1.20E-05 | 5.90E-06 | Bi | 2.07E-06 | 4.84E-05 | 4.63E-05 |
| Nb | 4.33E-06 | 1.81E-05 | 1.38E-05 | Th | 9.93E-07 | 2.84E-06 | 1.85E-06 |
| Mo | 6.43E-05 | 6.38E-05 | -4.77E-07 | U | 1.34E-06 | 3.82E-06 | 2.49E-06 |
| Ru | 7.17E-06 | 3.98E-06 | -3.19E-06 | ||||
| TOTAL | 1.00000E+02 | 1.00000E+02 | 7.870E-01 | ||||
Prior to the analysis of the derived results, we consider still one aspect. Under the regimes used in the glow-discharge cell (Ar plasma) of a mass spectrometer VG 9000, the etching rate of a specimen was about m/min. To avoid any effect of surface contaminations on the results of analysis, we etched the specimen surface usually for 30…40 min prior to the registration of a spectrum every time. The application of this procedure led to the removal of the surface layer of at least m in thickness which contained, as usual, the enhanced amount of the admixture.
First of all, we will discuss the data given in column “Increment” in Table 4. By definition, they are the difference of the data given in columns “Sandwich” and “Initial.” It is clear that these data must have positive sign for all the chemical elements except for Cu (it became more diluted), because there are no reasons for that the content of minor chemical elements in the accumulating screen decreases after the explosion of a target. In our opinion, there exists only a sole explanation for the indicated fact of a decrease in concentrations. We note that sheet materials are, as usual, inhomogeneous by composition Gulyaev (1977); Kann and Haazena (1987); Mitin (1987). In the case of “sandwich,” we meet a good averaging of the composition of the initial material (20 blanks cut from various parts of a sheet). But, in the case of the initial specimen, the averaging is not sufficient, because we deal with only one blank. Moreover, as known Gulyaev (1977); Kann and Haazena (1987); Mitin (1987), the chemical inhomogeneity is usually manifested in a greater degree for those chemical elements, whose content in the material is low, which happens in the situation under consideration.
It is obvious that the sum of all values in column “Increment” (without the increment for Cu)
| (20) |
has sense of a change in the concentration of minor chemical elements in the analyzed region of the accumulating screen due to the explosion of a Pb target. The increment of the concentration of Pb (see Table 4)
| (21) |
It is clear that we deal with Pb transferred from the target. However, the target lead transferred else some amount of impurities contained in it, for which the obvious relation
| (22) |
is valid. Now, with regard for Eqs. 20–22, the concentration of foreign chemical elements in the analyzed region of the accumulating screen which have appeared due to the explosion of a target and did not belong to the target prior to its explosion satisfies the relation
| (23) |
One can easily see that in Eq. 23 we can safely neglect the third term, i.e., we should not take the admixture transferred by the target Pb into account while calculating the concentration of foreign chemical elements in the analyzed region.
For a better insight into the situation as for foreign chemical elements, we pass from the quantity characterizing their relative amount (it depends on the accumulating screen thickness) to absolute values: namely, we will find the number of their atoms and their total mass. The mass of a part of the accumulating screen, which is located under the area of the analyzed region, is (see Fig. 3)
| (24) |
Now we can easily obtain the total mass of all atoms of foreign chemical elements being in the volume of the analyzed region of the screen as
| (25) |
as well as their total number
| (26) |
where is the summation index passing all the chemical elements from Table 4 except for Cu and Pb, is the mass concentration of the -th foreign chemical element in the analyzed region (the data from column “Increment” in Table 4), is the molar mass of the -th foreign chemical element, and is the Avogadro number. For the number of nucleons being present in the amount of foreign chemical elements given by Eq. 26, we get Prokhorov (1992)
| (27) |
A special attention should be paid to the fact that the values of and are, in fact, the result of direct measurements and are referred exclusively to the analyzed region, i.e., to the full volume of a part of the accumulating screen which is located under the analyzed area positioned in the central part of the screen. In this connection, we are tempted to recount the indicated values for the whole accumulating screen by multiplying them by the ratio of the squares of the diameters of the accumulating screen and the analyzed region . However, it is worth noting that the mentioned procedure is already based on the assumption as for that the distribution of products of the explosion over the accumulating screen surface is close to a homogeneous one. Of course, this assumption should be verified.
We will implement such a verification in the following way. First, we calculate the mass of Pb transferred from the target on the analyzed region:
| (28) |
Now, by supposing a distribution of Pb to be homogeneous, we calculate its mass transferred from the target on the whole accumulating screen:
| (29) |
We note that the derived amount of Pb must be only a fraction of the target mass loss (we recall that the mean target mass loss after its explosion was equal to 2.60 mg in the performed experiment) since it was collected only in the solid angle, at which the accumulating screen is seen from the collapse center. Moreover, the derived amount of Pb is even a fraction of the substance collected in the indicated solid angle, because the screen was covered, besides Pb, by the atoms of foreign chemical elements (the transformed substance of the target). Hence, by virtue of the above-presented reasoning, the derived relation
| (30) |
is inept. Contradiction (Eq. 30) obviously indicates that the assumption used in its derivation as for the homogeneity of the distribution of products of the explosion over the accumulating screen surface is erroneous.
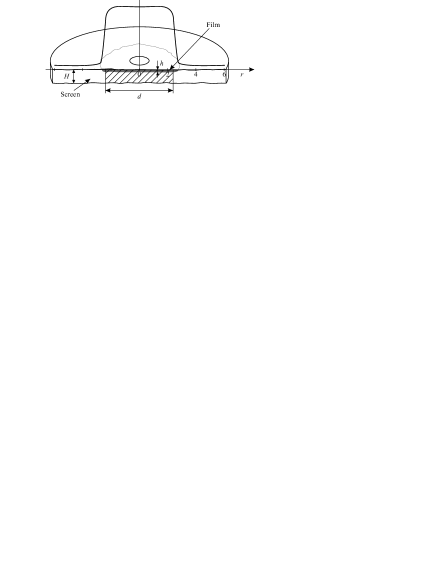
Thus, the performed measurements and estimations yield that products of the explosion of a target are very irregularly distributed over the accumulating screen surface. Most products find themselves in the central part of the screen, and their amount sharply drops on its periphery. In other words, the distribution of foreign chemical elements over the accumulating screen surface has the form schematically shown in Fig. 6.
There are other facts which not only confirm the above-discussed distribution of the target substance over the accumulating screen surface, but correct it. In particular, the composition of the accumulating screen was determined on the “sandwich” not only in the central part of the analyzed region (see Fig. 4), but also on its edge, which corresponds to the peripheral sections of the accumulating screen. For the total concentration of the atoms of all foreign chemical elements, here we get
| (31) |
i.e., this value is 10 times less than the similar value for the analyzed region positioned near the center of the screen (see Eq. 23). Basing on Eq. 31, it is easy to obtain the total mass of all the atoms of foreign chemical elements on the whole accumulating screen as
| (32) | |||||
It is obvious that the number of all the atoms of foreign chemical elements on the whole accumulating screen is more by a factor of 1.8 than their number in the analyzed region near the screen center, i.e.,
| (33) |
The results of measurements of the composition at the “sandwich” edge are useful also in another aspect. If we compare them with those for the “sandwich” center, it is noticeable that the ratio of the concentration of the -th chemical element at the screen center to that on the screen periphery is approximately equal to 7–15 most chemical elements. This ratio tends rather surely to 10 for those chemical elements, whose concentrations are large, i.e., for those which are measured most exactly. We recall that a ratio of 10 characterizes the total concentrations of the atoms of all foreign chemical elements at the screen center (Eq. 23) and at its edge (Eq. 31). In other words, the above-presented facts indicate that
| (34) |
Relation (Eq. 34) means obviously that the separation of chemical elements is absent upon the dispersion of a target substance. In other words, the masses of bits of the substance removed from the target due to the explosion in different directions will be different, but the fraction of the mass of any chemical element contained in them will be identical for all the directions.
The absence of the separation of chemical elements upon the dispersion of a target substance yields that the mass of all the atoms of foreign chemical elements contained in the substance removed from the target, , is to the mass of all the atoms of foreign chemical elements come to the analyzed region, , as the target mass loss is to the mass of all the substance transferred from the target to the analyzed region. Hence, we can easily get
| (35) |
By virtue of the same reasoning, we get the similar estimation for the total number of the atoms of foreign chemical elements contained in the mass removed from the target:
| (36) |
We note that Eq. 35 and Eq. 36 characterize the amount of almost all the substance transformed upon the explosion of a target. It does not include only the part which was not removed from the target and remained on the surface of its crater (see Fig. 1, a).
Finally, the absence of the separation of chemical elements upon the dispersion of the target substance allows us to get one more important characteristic: the fraction of the transformed substance in the total amount of the target substance participated in the explosion, or the efficiency of the process in terms of mass. It is obvious that this quantity is
| (37) |
Now we summarize the results of the second investigation with Pb targets. In this experiment, we analyzed the composition of the whole accumulating screen prior to the explosion and after it rather than the composition of the surface layer of the accumulating screen. The amount of appeared foreign chemical elements was determined as the difference of the amounts of minor chemical elements in the two indicated measurements. The used procedure was, in essence, the direct measurement of the required value and was carried out so that it excluded absolutely the interpretation of the fact of enrichment of of the accumulating screen surface at the expense of the redistribution of impurities from its bulk. The results of this experiment also exclude the possibility of generation of foreign atoms on the accumulating screen due to the transfer of impurities by the target material, because the first value exceeds the second one by at least 3 orders of magnitude (see Eq. 22 and Eq. 23). It is easy to understand that the derived amount of foreign atoms cannot be condensed from the residual atmosphere of the vacuum chamber of the setup. Indeed, it contained at most mg of a substance (the working liquid vapour, rarefied air, hydrocarbons, etc.) in a volume of 0.7 dm3 and at a residual pressure of about Pa. Such an amount is again by 4 orders less than the registered value (see Eq. 25).
Below, we give the estimation of the amount of impurities adsorbed from air by the surface of an accumulating screen. As known, the exposure of the extrapure surfaces of solids in air is accompanied by the formation of a layer of atoms of the chemical elements contained in air on these surfaces (first of all, they are carbon, oxygen, and, in the slight amount, nitrogen). Based on the data of AES Briggs and Seah (1987); Czanderna (1975); Carlson (1975), we can infer that their thickness does not certainly exceed two monolayers of atoms, because otherwise they would shield almost completely Auger-electrons going from the substance of the very accumulating screen (the substrate), which does not occur in reality. It is easy to calculate that, in the indicated approximation, the amount of impurities adsorbed from air on the both sides of the accumulating screen is about mg or mass % in the limits of the analyzed region. The given estimation yields that neither the composition nor the amount of air-based impurities allow one to relate the origin of the discovered atoms of foreign chemical elements on the accumulating screen to the process of adsorption from air. We also note that the essentially inhomogeneous distribution of foreign atoms over the accumulating screen surface does not allow us to explain their appearance by the process of adsorption from the residual atmosphere of the vacuum chamber and/or air or by the initial contamination of the accumulating screen surface. Indeed, in these cases, we must observe the formation of a more or less homogeneous distribution of impurities on the screen surface.
Finally, any transfer of a substance from the shell walls of the experimental chamber onto an accumulating screen was absent, because we took care for the suppression of a ricochet of the dispersed substance of a target from the shell walls onto the screen. The efficiency of the suppression of this process is testified by both the directedness of splashes on accumulating screens (see Fig. 1, b) and the absence of a considerable correlation between the composition of the explosion products on an accumulating screen and the composition of the material of the shell walls. In other words, the results of the performed experiment indicate that the atoms of foreign chemical elements contained in products of the explosion of a target are nothing else but the target substance undergone a nuclear transformation. As for the amount of the atoms of foreign chemical elements on the accumulating screen which was registered in this experiment (see Eq. 33), we note that it agrees well with the results of the first study (see Eq. 6).
Discussing the last experiment, we should like to mention its two basic poor aspects. First of all, upon the measurement of the composition of the initial material of an accumulating screen, its averaging was carried out only in the limits of one sheet blank. It is obvious that the quality of this procedure can be significantly improved, and one can avoid the error defined by the inhomogeneity of a composition of sheet materials. The second poor aspect of the last experiment was a low value of the geometric factor of the used “sandwich” equal to 0.004 (see Eq. 12), which forces us to register a rather small quantity, namely a weak signal from the layer of about m in thickness formed by products of the explosion against the background of a strong signal from the accumulating screen of m in thickness playing the role of a substrate. Of course, we can enhance the accuracy of measurements in this situation.
In the third experiment, we undertook some measures in order to eliminate all drawbacks of the two previous ones. As in the second experiment, we used the highly sensitive method of GDMS (VG 9000, VG Elemental, UK). We took “sandwiches” as the initial specimen and the specimen “processed” by an explosion, which ensured the efficient averaging of a composition of the initial material of accumulating screens. Its geometric factor was increased up to 0.02, i.e., by 5 times. We reached this value by decreasing the screen thickness to m (for lower thicknesses, the screen is broken by the explosion of a target) and applying the products of explosions on both sides of the screen with m. Thus, the region analyzed by a mass spectrometer on the “sandwich” included 25 ends of accumulating screens for both the initial and “processed” specimens. In experiments, we used the target and the accumulating screen made of Ag and Cu, respectively. By weighting, we found that the mean mass losses of the target and the accumulating screen were, respectively, 3.10 and 3.28 mg (see Table 5).
First, we analyzed the initial material of the Ag target by GDMS. According to the averaged result of two measurements, the total content of impurities in it was about 0.269 mass % with Cu as the main component (0.217 mass %). Because this copper does not “contaminate” the copper accumulating screen, we may estimate the target admixture transferred onto the accumulating screen during the explosion, , as 0.052 mass % of the amount of the transferred Ag (the difference of the values given above).
| Specimen | Mass loss, mg | Specimen | Mass loss, mg | ||
|---|---|---|---|---|---|
| number | Screen | Target | number | Screen | Target |
| 8689 | 6.05 | 3.88 | 8663 | 3.14 | 3.48 |
| 8693 | 3.06 | 4.52 | 8680 | 6.99 | 2.62 |
| 8621 | 5.18 | 4.15 | 8675 | 1.23 | 1.13 |
| 8668 | 3.84 | 3.46 | 8652 | 8.37 | 2.16 |
| 8666 | 0.39 | 2.03 | 8698 | 2.01 | 1.68 |
| 8683 | 0.60 | 3.29 | 8695 | 2.40 | 4.34 |
| 8665 | 5.36 | 4.29 | 8651 | 4.24 | 4.09 |
| 8682 | 4.14 | 4.61 | 8672 | 0.01 | 1.35 |
| 8653 | 2.57 | 2.26 | 8676 | 3.79 | 4.06 |
| 8671 | 3.83 | 3.44 | 8654 | 1.12 | 1.01 |
| 8657 | 0.56 | 2.36 | 8697 | 0.88 | 1.77 |
| 8679 | 2.14 | 3.33 | 8699 | 2.57 | 2.47 |
| 8655 | 5.13 | 3.37 | 8656 | 4.68 | 3.56 |
| 8677 | 2.61 | 2.93 | 8678 | 2.21 | 1.91 |
| 8688 | 2.76 | 2.46 | 8681 | 1.56 | 1.27 |
| 8691 | 4.72 | 3.49 | 8664 | 3.44 | 3.08 |
| 8685 | 2.92 | 3.19 | 8696 | 5.99 | 4.12 |
| 8687 | 4.67 | 3.80 | 8652 | 2.92 | 6.76 |
| Average | 3.28 | 3.10 | |||
In Table 6, we present the data on changes of the element composition of accumulating Cu screens after the experiments with a silver target. All the designations and data have the same sense as in Table 4. Each value of the compositions of the initial and processed specimens is averaged over 4 measurements. Columns “Increment” include the amounts of minor chemical elements (for each element separately) appeared as a result of the explosion of a target. We note that, in this case, there are no negative values. This fact testifies to the correctness of our assumption as for both the origin of negative values of the increments for a number of chemical elements in the previous experiment and the efficiency of solving the problem of averaging of a chemical inhomogeneity of sheet materials upon the determination of their composition by means of the use of specimens of the “sandwich” type. The total amount of minor chemical elements appeared after the explosion is
| (38) |
This value includes the silver transferred from the target,
| (39) |
After the subtraction of it, we get that the amount of a substance formed as the result of the nucleosynthesis:
| (40) |
In the last value, the admixture transferred by Ag (5.36 mass %) from the target is
| (41) |
That is, we can neglect it, because this value does not exceed the accuracy limits for the measured quantity. It is worth noting that values Eqs. 38–40 derived by us exceed the values of the same quantities from the previous experiment (see Eqs. 20, 21, and 23) by almost one order. It is doubtless that this circumstance is caused by the increase in the geometric factor and favours the increase in the accuracy of determination of the quantities under study.
| Element | Concentration, mass % | Element | Concentration, mass % | ||||
|---|---|---|---|---|---|---|---|
| Initial | “Sandwich” | Increment | Initial | “Sandwich” | Increment | ||
| H | 8.69E-05 | 9.76E-05 | 1.07E-05 | Rh | 2.07E-06 | 8.48E-06 | 6.42E-06 |
| Li | 1.28E-04 | 5.38E-04 | 4.10E-04 | Pd | 1.10E-05 | 1.61E-05 | 5.08E-06 |
| Be | 3.72E-07 | 6.30E-06 | 5.93E-06 | Ag | 1.57E-03 | 5.37E+00 | 5.36E+00 |
| B | 1.79E-04 | 5.84E-04 | 4.05E-04 | Cd | 1.02E-05 | 4.82E-05 | 3.79E-05 |
| C | 2.07E-04 | 2.68E-04 | 6.06E-05 | In | 3.02E-06 | 4.85E-06 | 1.84E-06 |
| N | 5.53E-04 | 6.52E-04 | 9.91E-05 | Sn | 5.25E-04 | 1.18E-03 | 6.56E-04 |
| O | 5.00E-04 | 5.74E-04 | 7.45E-05 | Sb | 4.47E-06 | 6.45E-05 | 6.00E-05 |
| F | 4.08E-05 | 4.51E-05 | 4.35E-06 | Te | 3.06E-05 | 7.80E-05 | 4.74E-05 |
| Na | 3.85E-03 | 8.50E-03 | 4.66E-03 | I | 8.78E-07 | 1.18E-06 | 2.98E-07 |
| Mg | 1.33E-04 | 1.11E-03 | 9.75E-04 | Cs | 4.26E-05 | 1.00E-04 | 5.74E-05 |
| Al | 1.04E-03 | 5.26E-02 | 5.15E-02 | Ba | 7.55E-06 | 6.04E-04 | 5.96E-04 |
| Si | 3.75E-05 | 8.70E-03 | 8.66E-03 | La | 3.10E-07 | 3.83E-07 | 7.33E-08 |
| P | 3.55E-02 | 3.60E-02 | 5.27E-04 | Ce | 4.92E-07 | 5.03E-07 | 1.09E-08 |
| S | 6.01E-03 | 1.00E-02 | 3.99E-03 | Pr | 3.66E-07 | 3.84E-07 | 1.77E-08 |
| Cl | 6.58E-03 | 4.20E-02 | 3.54E-02 | Nd | 4.35E-06 | 4.48E-06 | 1.30E-07 |
| K | 2.44E-05 | 5.58E-05 | 3.14E-05 | Eu | 1.73E-07 | 1.11E-06 | 9.37E-07 |
| Ca | 2.79E-04 | 4.20E-02 | 4.17E-02 | Sm | 2.77E-06 | 2.89E-06 | 1.27E-07 |
| Sc | 1.26E-06 | 6.65E-06 | 5.39E-06 | Gd | 4.83E-07 | 7.96E-07 | 3.13E-07 |
| Ti | 1.21E-04 | 7.75E-04 | 6.54E-04 | Tb | 2.32E-07 | 2.63E-07 | 3.14E-08 |
| V | 2.15E-05 | 1.78E-04 | 1.57E-04 | Dy | 1.66E-06 | 1.74E-06 | 7.81E-08 |
| Cr | 3.16E-05 | 4.02E-04 | 3.71E-04 | Ho | 8.13E-08 | 4.55E-07 | 3.74E-07 |
| Mn | 8.34E-05 | 8.64E-05 | 2.98E-06 | Er | 2.84E-06 | 8.95E-06 | 6.11E-06 |
| Fe | 6.70E-03 | 1.25E-01 | 1.18E-01 | Tm | 2.61E-07 | 3.40E-07 | 7.85E-08 |
| Co | 5.23E-05 | 1.44E-04 | 9.17E-05 | Yb | 1.83E-06 | 2.40E-06 | 5.73E-07 |
| Ni | 1.34E-03 | 2.42E-03 | 1.08E-03 | Lu | 3.47E-07 | 3.78E-07 | 3.14E-08 |
| Cu | 9.9631E+01 | 9.3706E+01 | -5.9250E+00 | Hf | 7.29E-07 | 6.79E-06 | 6.06E-06 |
| Zn | 2.96E-01 | 5.52E-01 | 2.56E-01 | Ta | 1.59E-06 | 1.79E-03 | 1.79E-03 |
| Ga | 3.28E-05 | 3.91E-05 | 6.37E-06 | W | 5.06E-03 | 3.86E-02 | 3.36E-02 |
| Ge | 1.62E-05 | 3.19E-05 | 1.57E-05 | Re | 1.83E-07 | 1.86E-06 | 1.68E-06 |
| As | 2.11E-06 | 3.00E-06 | 8.89E-07 | Os | 1.01E-06 | 2.52E-05 | 2.42E-05 |
| Se | 1.44E-04 | 2.00E-04 | 5.63E-05 | Ir | 6.63E-07 | 1.07E-06 | 4.04E-07 |
| Br | 8.03E-06 | 1.25E-05 | 4.47E-06 | Pt | 8.74E-07 | 9.05E-07 | 3.15E-08 |
| Rb | 2.48E-06 | 2.49E-06 | 1.25E-08 | Au | 1.48E-06 | 3.32E-06 | 1.85E-06 |
| Sr | 2.34E-07 | 1.19E-06 | 9.58E-07 | Hg | 4.23E-05 | 5.31E-03 | 5.27E-03 |
| Y | 5.73E-07 | 5.76E-07 | 3.60E-09 | Tl | 4.90E-07 | 7.99E-06 | 7.50E-06 |
| Zr | 1.98E-06 | 3.19E-06 | 1.21E-06 | Pb | 7.10E-04 | 3.40E-02 | 3.33E-02 |
| Nb | 6.37E-06 | 8.00E-06 | 1.63E-06 | Bi | 2.60E-05 | 2.97E-04 | 2.71E-04 |
| Mo | 1.52E-05 | 4.06E-04 | 3.91E-04 | Th | 2.49E-07 | 9.85E-07 | 7.36E-07 |
| Ru | 1.09E-06 | 1.87E-06 | 7.81E-07 | U | 1.93E-07 | 3.37E-07 | 1.43E-07 |
| TOTAL | 1.000E+02 | 1.000E+02 | 5.96E+00 | ||||
By using the procedure described above, we calculated the total mass of all the atoms of foreign chemical elements formed as the result of the nucleosynthesis and presented in the volume of the analyzed region of the screen,
| (42) |
and their total number
| (43) |
We note that this number of atoms was synthesized in two series of experiments since the nucleosynthesis products were applied on both sides of each accumulating screen. Hence, in the performed experiments, we registered
| (44) |
synthesized atoms on an accumulating screen in the area of 5 mm in diameter which is positioned in the central region. Their mass
| (45) |
As for nucleons contained in the amount of foreign atoms equal to Eq. 44, their number
| (46) |
The relative error of the measured values is in the limits of 10–20%. Comparing Eq. 45 and Eq. 25, we note that the mass of regenerated atoms per explosion is almost the same for Pb and Ag targets, but their number is considerably less for Ag targets (see Eq. 44 and Eq. 26). This fact indicates that the explosion of an Ag target generates, on the average, the atoms of heavier chemical elements.
We also present the mass of Ag transferred from the target onto the analyzed region as the result of one explosion:
| (47) |
Unfortunately, we did not perform measurements on the edge of the “sandwich” in the last experiment, because we did not attach any special significance to them at that time. The results of measurements gave small numbers of the atoms of foreign chemical elements and seemed to be unconvincing for the justification of the running of the nucleosynthesis reactions upon the explosion of a target. Therefore, basing on these results, we cannot calculate and present the values characterizing the amount of the regenerated substance deposited on the whole accumulating screen. However, in view of the absence of separation of chemical elements upon the dispersion of a target substance, we estimated the mass of all the synthesized atoms contained in the mass removed from the target
| (48) |
Their number
| (49) |
Finally, for this experiment, the parameter of efficiency of the process of transformation of the target substance in terms of mass is
| (50) |
Comparing values Eqs. 50 and 37, we emphasize the lower efficiency of the process of transformation for a silver target.
By summarizing, we note that three independent experiments which were performed by two methods (the first method is local, and the second is highly sensitive integral) established the fact of the appearance of foreign chemical elements in products of the explosion of a solid target. We have demonstrated that these atoms are the products of a nuclear transformation of the target substance subjected to the action of a superintense impact compression. The estimates of the amounts of the substance formed due to the nuclear transformation well agree with one another.
III CONCLUSIONS
The main results and conclusions concerning the experimental investigations of the explosion-induced destruction of solid targets subjected to the compression up to superhigh densities, which were performed by XEPMA and GDMS in the present work are as follows.
-
•
By the example of three independent analyzes performed by XEPMA and GDMS, we have demonstrated the fact of discovery of the atoms of foreign chemical elements in products of the explosion of a solid target. Prior to the explosion, these elements did not belong to the materials of the target and screen (the structural details of the experimental chamber which participated in the process of explosion). We have shown that their origination is not related to the processes of deposition from the residual atmosphere of the vacuum chamber or to the transfer from the shell walls (the structural details which were present in the experimental chamber but did not participate in the process of explosion) but is the result of a nuclear transformation of the target substance due to the impact compression up to superhigh densities.
-
•
By direct measurements, we determined the amounts of the nucleosynthesis products deposited on accumulating screens in the experiments with copper, lead, and silver targets. Their total mass and the total number of their atoms are, respectively, mg and . The estimates of the amount of a substance formed as the result of a nuclear transformation which were derived by different methods are in good agreement with one another.
-
•
We have investigated the distribution of the nucleosynthesis products deposited on the accumulating screen and shown that they are present as microparticles and films in the surface layer of about m in thickness. Moreover, their overwhelming part is positioned in the central region of the screen, about 5 mm in diameter. Their concentration drops significantly towards the screen periphery.
-
•
We have shown that no separation of chemical elements occurs in the explosion products deposited on accumulating screens upon the dispersion of a target substance.
-
•
We have determined the quantitative characteristics of the efficiency for the process of nuclear transformation of a target substance. For example, the fractions of the regenerated mass of a target participated in the explosion are 13 and 10 % for the Pb and Ag targets, respectively.
References
- Adamenko and Adamenko (2002) S. Adamenko and A. Adamenko, in Proceedings of Int. Symp. New Projects and Lines of Research in Nuclear Physics (World Scientific, 2002), pp. 33–44.
- Adamenko (2003) S. Adamenko, Visnyk NANU (Bulletin of National Academy of Sciences of Ukraine) pp. 23–26 (2003).
- Gulyaev (1977) A. Gulyaev, Metals Science (Metallurgiya, Moscow, 1977).
- Kann and Haazena (1987) R. Kann and P. Haazena, eds., Physical Metallurgy, vol. 1 (Metallurgiya, Moscow, 1987).
- Mitin (1987) B. Mitin, ed., Powder Metallurgy and Sprayed Coatings (Metallurgiya, Moscow, 1987).
- Prokhorov (1992) A. Prokhorov, ed., Physical Encyclopedia (Bol’shaya Ross. Entsikl., Moscow, 1992), chap. Nuclide, p. 669.
- Briggs and Seah (1987) D. Briggs and M. Seah, Practical surface analysis by Auger and x-ray photoelectron spectroscopy (Wiley, New York, 1987).
- Czanderna (1975) A. Czanderna, Methods of surface analysis (Elsevier, Amsterdam, 1975).
- Carlson (1975) T. Carlson, Photoelectron and Auger spectroscopy (Plenum, New York, 1975).