INDRA and ALADIN collaborations
Model-independent tracking of criticality signals in nuclear multifragmentation data
Abstract
We look for signals of criticality in multifragment production in heavy-ion collisions using model-independent universal fluctuations theory. The phenomenon is studied as a function of system size, bombarding energy, and impact parameter in a wide range of INDRA data. For very central collisions () we find evidence that the largest fragment in each event, , plays the role of an order parameter, defining two different regimes at low and high incident energy, respectively, according to the scaling properties of its fluctuations. Data for a wide range of system masses and incident energies collapse on to an approximately universal scaling function in each regime for the most central collisions. The forms of the scaling functions for the two regimes are established, and their dependence on the total mass and the bombarding energy is mapped out. Data suggest that these regimes are linked to the disappearance of heavy residues in central collisions.
I Introduction
It has long been hoped that the study of nuclear multifragmentation reactions as observed in intermediate energy heavy-ion collisions de Souza et al. (1991); Bowman et al. (1991); Ogilvie et al. (1991); Tsang et al. (1993); Peaslee et al. (1994) can give valuable information on the nuclear matter phase diagram and equation of state Bertsch and Siemens (1983); Fai et al. (1985); Peilert et al. (1989). The principal guide-wire for this research has been the search for signs of something analogous to a liquid-gas phase transition in data on intermediate mass fragment (IMF) production, ever since the observation of power laws in fragment mass-yield distributions Finn et al. (1982); Minich (1982), reminiscent of the condensation of liquid drops in a critical vapour Fisher (1967). This effort was encouraged by the failure of statistical models of hot nuclear decay Friedman and Lynch (1983); Charity et al. (1988); Durand et al. (1992) to explain the observed fragment yields Bowman et al. (1991); Llope et al. (1995) unless they suppose the break up of the system at low densities Friedman (1990); Gross (1990); Bondorf et al. (1995) where the phase transition may occur Bertsch and Siemens (1983).
Signals of the phase transition in experimental data on multifragmentation may be revealed by anomalously large fluctuations of fragment observables Campi (1988); Mekjian et al. (1998); Richert and Wagner (2001). The main obstacles to such endeavours insofar as experimental data are concerned are the huge statistical fluctuations inherent to small systems such as atomic nuclei, and the still-open question of the mechanism(s) of fragment production in heavy ion collisions at intermediate energies Moretto and Wozniak (1993); Lott et al. (1992); Toke et al. (1995); Dempsey et al. (1996); Kunde et al. (1996); Larochelle et al. (1996); Marie et al. (1997); Łukasik et al. (1997); Nebauer et al. (1999); Plagnol et al. (1999); Lefort et al. (2000); Djerroud et al. (2001); Frankland et al. (2001a, b); Borderie et al. (2001); Bellaize et al. (2002); Colin et al. (2003); Charvet et al. (2004). Indeed in all experimental studies of the question, at the same time as one is searching for evidence of the phase transition of a piece of hot nuclear matter Frankland et al. (2001b), one is (implicitly or not) obliged to elucidate the manner in which such an excited system may be formed in the course of certain reactions Frankland et al. (2001a). The solidity of any experimental evidence for a link between multifragmentation and the nuclear matter phase diagram will be undermined by any remaining ambiguity about the dominant mechanism of fragment production in the selected sample of experimental events, and it would be preferable to be able to address the question of “phases” in nuclear multifragmentation independently of reaction mechanism.
It is for this reason that the theory of the universal character of order parameter fluctuations in finite systems proposed by Botet and Płoszajczak Botet et al. (1997); Botet and Płoszajczak (1999, 2000, 2001) provides an attractive opportunity to address the question of phase transitions induced by heavy-ion collisions in the least ambiguous way possible. According to their work, it is possible to obtain pertinent information on the relationship between the formation of clusters in a system and the phase transition(s) of said system without needing to characterise the state of the system under study to the extent of, for example, supposing it to be in thermodynamical equilibrium at the time of cluster formation. One needs only to study the properties of the clusters: specifically, all pertinent information can be obtained from a sufficiently precise measurement of the event-by-event distributions of cluster multiplicity and the size of the largest cluster produced. The attractiveness of such an approach in the domain of nuclear fragmentation reactions is obvious, for the reasons given above: although the mechanism of fragment production remains an open question, for several years now large solid-angle multidetector arrays such as INDRA have provided high-quality data on the multiplicity and the size (charge) of the fragments produced in such reactions.
A first application of the universal fluctuations theory to INDRA data for central collisions of Xe+Sn from 25 to 50 MeV was published in Botet et al. (2001). In this paper we will present the results of the same analysis applied to a wide range of systems measured with INDRA. As in Botet et al. (2001) we observe a signature compatible with the existence of different regimes at different bombarding energies. This behaviour disappears for less central collisions. By applying the analysis to data for colliding systems with total mass number between 73 and 394 we will show the mass dependence of the energy of transition between the two regimes, as well as presenting a systematic study of the universal scaling functions observed in the low- and high-energy regimes.
II Universal fluctuations of the order parameter in finite systems
Universal scaling laws of fluctuations (the -scaling laws) have been derived for equilibrium systems, and shown to apply also in certain out-of-equilibrium situations. In a system in which the second-order critical behaviour can be identified, the relation between order parameter, criticality and scaling law of fluctuations has been established and the relation between the scaling function and the critical exponents has been found. Details can be found in Botet and Płoszajczak (2001).
Experimental observables that may be related to a critical order parameter can be identified through their -scaling behaviour. The -scaling is observed when two or more probability distributions of the observable for a system of ’size’ collapse onto a single scaling curve independent of system size when plotted in terms of the scaling variables:
| (1) |
where is the mean value of the distribution and . plays the role of a scale parameter and can replace as a measure of the size of the system. A less strong (necessary but not sufficient) condition for -scaling is that the variance of the distribution should scale with its mean value as
| (2) |
so that in a log-log plot of versus data should fall on a straight line of slope .
The scaling law Equation 1 with is associated with low temperature (“ordered”) systems, or with observables which are not related to an order parameter. Scaling with is seen at high temperature (“disordered” system) and also for critical systems. For to be an order parameter it must exhibit a corresponding change of -scaling regime when some suitable control parameter (e.g. available energy, temperature, bond-breaking probability, etc.) is varied.
Here it is worth saying a word about the comparison of experimental distributions using Eq.1 and the determination of -scaling regimes for data. As the transformation from experimental observable to the scaling variable is a linear transformation, the form of the distribution is the same as that of . However, the presence of the exponent in the scale factor means that two identical distributions will appear different (their widths will be different) if they are scaled using a value of which is not the one relating the mean values and variances of the two distributions via Eq.2. For example, consider two Gaussian distributions whose widths and mean values are related via Eq.2 with . In this case the use of Eq.1 with, for example, would not lead to a universal scaling function: the widths of the two scaled distributions would be different, and, because of the normalisation of , the height of the distributions would differ also. It should also be noted that the relationship between the mean and the variance of a set of distributions, i.e. the value of if Eq.2 holds, is quite independent of the form of the distributions: a given value of does not imply a certain type of distribution, and vice versa.
More detailed information on the state of the system and the fragmentation process may be found in the form of the scaling functions , Eq. 1. For systems far from a critical point, the central limit theorem tells us that for an observable being the sum of uncorrelated random variables, one should observe asymptotically a Gaussian distribution for fluctuations of about its mean value. If on the other hand is an extremal value such as the largest among a set of uncorrelated random variables, then asymptotically its distribution should be that of Gumbel’s first asymptote Gumbel (1958). For critical systems such general results do not exist, as, due to the presence of correlations at all length-scales, the order parameter distribution must depend on the precise details of the interaction in this case. An asymptotic form of the large- scaling function tail was derived in Botet and Płoszajczak (2000), where close to a critical point the order parameter distribution was expected to fall off like with , meaning that large deviations of the order parameter from its mean value are strongly suppressed.
There are two generic families of fragment production scenarios for which the second-order phase transition has been identified, with two different order parameters. These are
-
•
the fragment multiplicity for fragmentation scenarios such as the fragmentation-inactivation binary (FIB) model Botet and Płoszajczak (1992).
-
•
the size of the largest cluster or fragment in the so-called aggregation scenarios such as percolation or Fisher droplet models Botet and Płoszajczak (2000).
Therefore the elimination of one of these two easily measurable experimental quantities as not having the order parameter -scaling behaviour described above should give important information on the fragment production process, by allowing to exclude one of the two scenarios.
III Presentation of data
III.1 Experimental details
In order to study as exhaustively as possible the question of the existence of an order parameter or other “phase-like” behaviour in heavy-ion collisions, we have profited from the wide range of very high quality data which has been obtained with the INDRA 4 array Pouthas et al. (1995a); Steckmeyer et al. (1995); Pouthas et al. (1995b) at the GANIL (Caen) and GSI (Darmstadt) accelerator facilities. This charged product detector covers about 90% of the 4 solid angle. The total number of detection cells is 336 arranged according to 17 rings centred on the beam axis. The first ring () was composed of 12 fast NE102/NE115 phoswich detectors during the experiments at the GANIL facility. For the GSI experiments these were replaced by 12 telescopes composed of a 300 m thick silicon detector and a 14 cm thick CsI(Tl) scintillator. Rings 2 to 9 cover the angular range from to and are made of three detector layers: a low pressure gas-ionization chamber (5cm of C3F8 at 20 to 50 mbar, depending on the experiment and the polar angle), a 300 m thick silicon detector and a 14 to 10 cm thick CsI(Tl) scintillator. The remaining 8 rings cover the angular range from to and have two detection layers: ionization chamber and 7.6 to 5 cm thick CsI(Tl) scintillator. Fragments with up to the charge of the projectile are identified with unit resolution in the forward region, when they are stopped in the scintillator detectors. Beyond , the charge resolution is one unit up to , and a few charges for larger . Over the whole angular range, a very good isotope identification is obtained for to , except for particles with low energies where ambiguities are unresolved.
The energy calibration of the CsI(Tl) scintillators was obtained for light charged particles (LCP) by means of the elastic and inelastic scattering of secondary LCP beams (p,d,t,3He,4He) produced by the fragmentation of a 95 MeV 16O beam in a thick C target. These particles were then momentum selected by the “alpha magnetic spectrometer” of GANIL and scattered in a C or Ta target installed in the INDRA reaction chamber. A typical energy resolution was about 4%. Typical identification thresholds are a few 100 keV for light particles, 0.7 MeV for , and 1.4 MeV for . A complete technical description of INDRA, its calibration and its electronics can be found in Steckmeyer et al. (1995); Pouthas et al. (1995b, a); Tăbăcaru et al. (1999); Pârlog et al. (2002a, b); Trzciński et al. (2003).
III.2 Overview of data
The data presented here cover a wide range of quasi-symmetric systems studied with the INDRA array, with different total masses and bombarding energies. They are:
-
Ar+KCl
32, 40, 52 and 74 MeV;
-
Ni+Ni
32, 40, 52, 63, 74, 82 and 90 MeV;
-
Xe+Sn
25, 32, 39, 45, 50, 65*, 80* and 100* MeV;
-
Au+Au
40*, 60* and 80* MeV.
The systems marked with an asterisk were measured during the experimental campaign at the GSI facility. We have concentrated on symmetric colliding systems in order to benefit from the maximum overall efficiency of the INDRA array in this case. Before presenting the analysis of this data set in terms of universal fluctuations we will give an overview of the chief characteristics of these reactions.
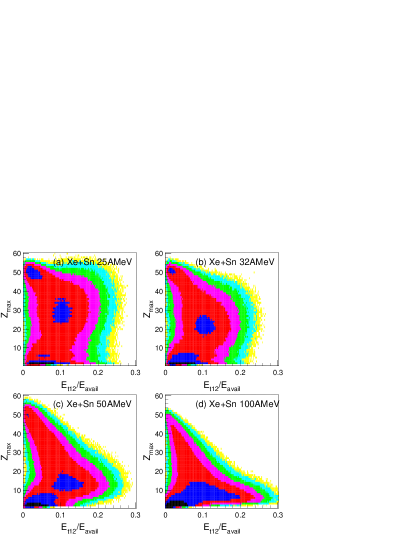
Figure 1 shows experimental data for the Xe+Sn system. The contour plots show the number of events measured corresponding to each value of the size of the largest detected fragment, , and of the fraction of the available energy converted into transverse energy of light charged particles, . This latter quantity has been shown Łukasik et al. (1997); Plagnol et al. (1999); Métivier et al. (2000); Bocage et al. (2000) to be principally related to the geometry of heavy-ion collisions in this energy domain, and is particularly well-suited to sorting events measured with the INDRA detector with little bias, because the efficiency of the array for light charged particle detection is whatever the centrality/reaction mechanism. The data shown were recorded with an on-line trigger requiring that at least four detectors fired in coincidence, while in the off-line analysis we required at least four correctly identified charged products in each considered event. Very similar plots were obtained for all other data studied in this paper, as for example the data for the Ni+Ni system shown in Figure 2. They give an overview of the evolution of reaction mechanisms with beam energy and impact parameter.
For the least violent collisions (small ) two strong contributions to the total cross-section are observed, depending on whether the projectile-like fragment was detected () or not (). For most of these collisions the target-like residue is too slow-moving to be detected and/or correctly identified by the INDRA array. With increasing beam energy, the contribution from projectile-like fragments appears to decrease in importance. This is due to the increasingly forward-focused kinematics of the reactions and the smaller grazing angle at higher energy, which mean that projectile-like fragments from peripheral collisions are more likely to be deflected to angles too small for them to be detected in the first ring of the INDRA array (see III.1).
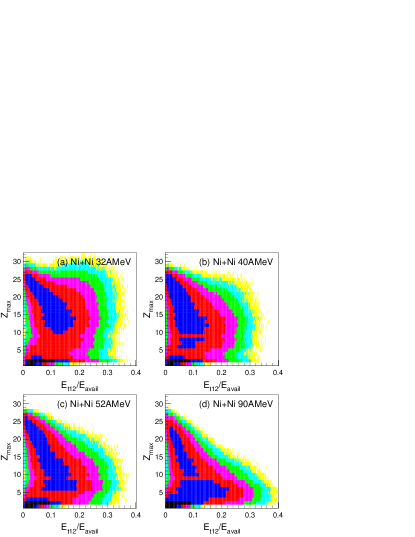
For more central collisions (larger ) the outcome of the reaction depends on bombarding energy and the mass of the colliding nuclei. For the Xe+Sn system at the lowest incident energies (Figures 1a-b), the cross-section for all but the most peripheral collisions is dominated by events for which the heaviest detected fragment has around one half of the charge of the projectile nucleus, and there is a discontinuous evolution in cross section between the most peripheral collisions and these events. This is due to the onset of fission of projectile-like nuclei above a certain threshold excitation energy which is attained in mid-peripheral and more central reactions Bocage et al. (2000). At higher bombarding energies (Figures 1c-d) a more continuous evolution of projectile-like residue size with the collision violence is seen. For a lighter system such as Ni+Ni (Figures 2a-b) a continuous ridge goes from the most peripheral toward more central collisions showing that the size of the projectile-like residues decrease continuously with decreasing impact parameter, as fission is not a predominant decay channel even at high excitation energies for such light nuclei. The correlations between and for the Ar+KCl system (not shown) are very similar to those for Ni+Ni, whereas for the Au+Au system they resemble those for Xe+Sn at 50 and 100 MeV except that for the most peripheral collisions a clear contribution from the fission of gold quasiprojectiles is seen.
Finally let us remark the similarity between Figures 1a and 2a, concerning the production of heavy residues at low incident energy. Both figures show that there are two distinct contributions to the total yield for residues with close to that of the projectile. The first was discussed in the previous paragraph and is due to projectile-like fragments produced in peripheral collisions (small values). This is the dominant contribution. Nevertheless there is a second contribution which is associated with a broad distribution of large residue sizes as well as an equally broad distribution of values corresponding to mid- to central collisions. The appearance of these experimental correlations suggests that the mean value of the charge of the heaviest detected fragment, , first decreases with increasing collision violence and then increases for the most “central”
collisions at the lowest beam energy for these two systems.
According to Figures 1 and 2 such reactions make a relatively important contribution to the production of heavy residues in central collisions of Ni+Ni and Xe+Sn at 32 and 25 MeV respectively. When the incident energy increases (40 MeV for Ni+Ni, Figure 2b, and 32 MeV for Xe+Sn, Figure 1b) the size and yield of the associated residues decrease making this contribution harder to distinguish. From Figures 2c-d and Figures 1c-d it appears that the cross-sections associated with these reactions become very small above MeV, for the Ni+Ni system, or above MeV, for the Xe+Sn system (for the Ar+KCl system, not shown here, this contribution is discernible up to 52 MeV). However, more sensitive analyses (e.g. see below for Xe+Sn) can reveal the survival of such reactions at higher incident energies.
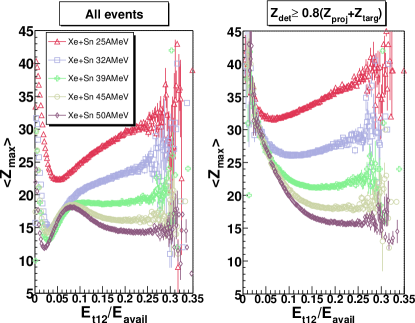
Figure 3 shows the evolution of with collision centrality for the Xe+Sn system between 25 and 50 MeV. It can be seen that the mean charge of the heaviest fragment produced in each event increases with increasing centrality for 25, 32, and, very slightly, 39 MeV. It should be noted that this tendency is observed whether one considers all (Figure 3 left panel) or only well-measured (right panel - ratio of total detected charge, , to total charge of projectile and target required to be at least 80%) events. The requirement of well-measured events reveals the monotonous decrease of the mean charge of projectile-like fragments in peripheral collisions () by excluding from the average those events where neither target-like nor projectile-like fragments were detected (compare Figure 1).
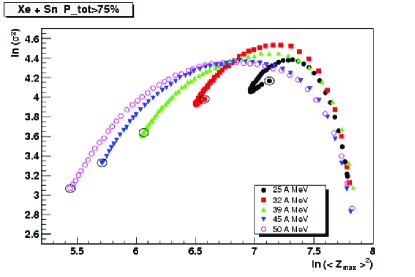
Another way of excluding poorly-measured events is to keep only those for which most of the momentum of the incident beam particles is reconstructed from the detected nuclei. This gate on data has the effect of retaining all events for which at least a good reconstruction of the quasi-projectile residue and products was obtained, for the most peripheral collisions, whilst in the most central collisions we achieve an almost complete reconstruction of the event. In this way we can follow, in Figure 4, the correlated evolution of the variance and the mean of the distribution as a function of collision violence: from peripheral collisions leading to a slightly excited quasi-projectile (large and small variance) to the most central collisions (indicated by a ring around the last data point for each beam energy). Each point in this figure corresponds to cuts defined by slicing the minimum-bias distribution into 100 bins, each containing an equal number of events. Thus each point represents 1% of the measured cross-section, although due to our requirement of well-measured events the most peripheral (least well measured) events are absent. It allows to see how in the most central collisions two different behaviours are observed depending on the incident beam energy: below 39 MeV in the 3-5% most central collisions the mean charge of the largest fragment actually begins to increase again, whilst the correlation between this mean value and the variance of the distribution is not the same as for the majority of other impact parameters.
This figure suggests that at beam energies 39 MeV the origin of the heaviest fragment is not the same in central collisions as for the rest of the reactions. The increase of for the most central collisions at these energies suggests a contribution from (incomplete) fusion reactions where the heaviest fragment detected is an evaporation residue. The disappearance of this phenomenon for 39 MeV can be interpreted as signalling the disappearance of fusion-evaporation residues, and marking the onset either of fusion-multifragmentation Frankland et al. (2001a) or of transparency in central collisions (incomplete stopping) Nebauer et al. (1999); Ono et al. (2002); Le Fevre et al. (2004).
IV Analysis of data in terms of universal fluctuations
IV.1 Selection of central collisions
We begin our analysis by extending the results of Botet et al. (2001), for central collisions of Xe+Sn, to a wider range of systems measured with the INDRA multidetector array. As was discussed in Sec. I, the analysis of universal fluctuations in multifragmentation data does not require to know (or to suppose) how fragments are formed. However the comparison of events with very different collision geometries is unlikely to give meaningful results. Therefore we will limit our study to very central collisions for which the geometrical overlap between projectile and target is as close as possible to total. The need to select equivalent classes of events for a large range of system masses and beam energies with as little dependence as possible on detector efficiency led us to use the total transverse energy of light charged particles, .
The sorting variable has been studied specifically for the INDRA detector Plagnol et al. (1999); Frankland et al. (2002). It was shown that, for a given projectile-target system, the minimum-bias inclusive distributions of for different beam energies scale as a function of the available centre of mass energy, consistent with being mainly sensitive to the geometry of the collisions, i.e. that it is a good indicator of collision centrality. Moreover, as it was pointed out in Sec. III.2, the efficiency of the INDRA detector for light charged particles is almost independent of the type of reaction under study, allowing to use this variable to sort all data considered in this paper in the same way.
In addition, in this way we avoid any direct link between the studied observables (size of the largest fragment in each event and fragment multiplicity) and the variable used for the selection of events. We are therefore in the best possible situation to avoid distortion of the data due to autocorrelations with the experimental filter Llope et al. (1995).
The data analysed in the following with the largest values of correspond to 1% of the total number of events recorded during the experiment with a minimum-bias condition ( in the geometrical approximation of Cavata et al. (1990) where the maximum impact parameter is smaller than the sum of the radii of projectile and target due to the experimental trigger condition). We were able to check whether the largest detected charged fragment of each event is really the largest, using the total detected charge of the event, .
IV.2 Establishing an “order parameter” for nuclear multifragmentation with no model-dependent hypotheses
Generic models of cluster production may be classed into two types. The first, the class of "fragmentation" scenarios in which a system is broken up by a series of binary splittings or some other physical process, has for its order parameter the number or multiplicity of clusters. For such models, it is the multiplicity which exhibits different -scaling regimes if the system has different phases. The second class of models, in which clusters are built up by "aggregation" of smaller constituents, has for its order parameter the size of the largest cluster. As INDRA does not measure the mass but only the atomic number of fragments, we will assume in the following that the largest fragment of each event corresponds to , the fragment with the largest atomic number.
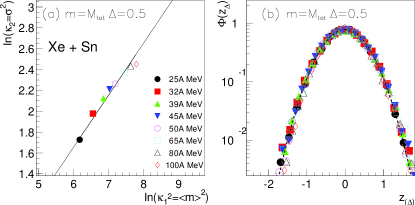
Figure 5 shows the data for the total multiplicity of charged products with , , for central collisions of Xe+Sn from 25 to 100 MeV. In Figure 5a we plot the natural logarithm of the variance of the measured distributions as a function of the natural logarithm of the square of the mean value. The estimated statistical errors of these quantities are smaller than the symbols used. If fluctuations obey the universal scaling law Eq. 2, then the data must fall on a straight line of slope in this plot. It can be seen in Figure 5a that this is true to a fair approximation, and that the variance of the multiplicity distribution grows with increasing bombarding energy as .
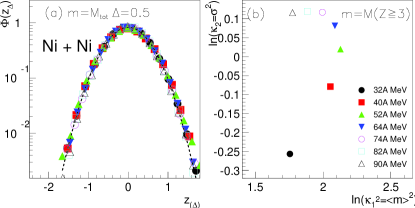
Figure 5b shows that the multiplicity distributions for different bombarding energies collapse to a unique distribution (scaling function) when expressed in terms of the second scaling law (Equation 1 with ), as suggested by Figure 5a. It should be noted that examination of an observable’s scaling properties in this way is far more constraining than that of Fig. 5a, when the statistics of the data samples allow it. The observed scaling function is very well approximated by a Gaussian distribution (dashed curve on the figure). The scaling properties of total multiplicity fluctuations are therefore the same for all bombarding energies in the range 25–100 MeV. This is true not only for the Xe+Sn data but also for all the data we have studied in this paper: see for example the data for 58Ni+58Ni collisions in Figure 7a. Therefore the total multiplicity of charged particles for central collisions in this energy range does not show any evidence of ’anomalous’ or ’critical’ behaviour.
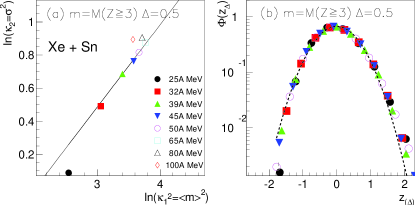
The multiplicity is dominated by the multiplicity of light charged particles, , which is typically 3–4 times greater than the multiplicity of IMF (). However, similar conclusions as for can be drawn for the IMF multiplicity, , for which the Xe+Sn data are presented in Figure 6, the Ni+Ni data in Figure 7b. Figure 6a shows that the widths of distributions for Xe+Sn at bombarding energies 32 to 65 MeV increase with the mean multiplicity according to a scaling law, and this is confirmed by Figure 6b. The width for the 25 MeV system falls below this “systematic” trend, which may indicate that this energy is close to the threshold for multifragmentation in central collisions (the mean multiplicity for this system is approximately 3 fragments with ), leading to reduced fluctuations of the fragment multiplicity. Recent data obtained with INDRA for the same system at bombarding energies from 8 to 20 MeV will allow to study this point in more detail.
Nevertheless the multiplicity of fragments does show some slightly more interesting features than : let us remark the “back-bending” in Figure 6a for bombarding energies MeV, indicating the decrease of mean fragment multiplicity at the highest bombarding energies. The same behaviour is seen more clearly in Figure 7b for Ni+Ni collisions above 52 MeV. Let us note in passing that the available energy for the maximum of fragment production in the Ni+Ni system is here much lower (13 MeV) than that reported in Sisan et al. (2001) (17.5 MeV).
This type of “rise and fall” behaviour has been observed in many different data sets Ogilvie et al. (1991); Tsang et al. (1993); Peaslee et al. (1994); Sisan et al. (2001). The absolute value of the maximum mean multiplicity and the energy at which it occurs in central collisions are not only system-dependent Sisan et al. (2001) but also selection-dependent Llope et al. (1995) and detector-dependent. It should be noted that in the framework of the universal fluctuations theory this rise and fall is not consistent with the fragment multiplicity being an order parameter. Rather, in the energy domain for which fluctuations of show a regular scaling behaviour (32–65 MeV for Xe+Sn), it can be seen that this scaling is always of the second kind () and in this domain the multiplicity distributions all collapse to a unique, quasi-Gaussian scaling function (Figure 6b).
Therefore, neither the total charged multiplicity nor the fragment multiplicity have fluctuations which indicate the presence of different “phases” for central collisions in this energy range. It should be noted, however, that we cannot exclude the possibility of a different behaviour of observables to which we do not have access in this data, for example the true total multiplicity including neutrons. Neither does our result exclude the possibility that in other fragmentation reactions, e.g. at higher bombarding energies and/or in spectator decays rather than central collisions, the total or fragment multiplicity may be the pertinent order parameter. For our data on central collisions between 25 and 100 MeV however we will from now on only consider the other possible order parameter for fragmentation, the size of the largest fragment.
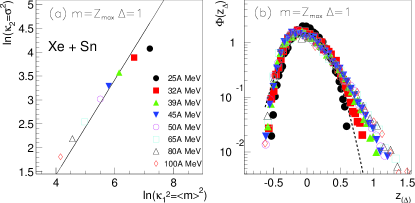
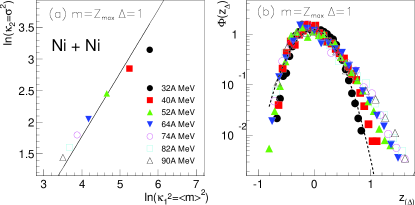
Looking at the log-log plot of the first two cumulant moments of (Figure 8a) we can suspect some evolution of the scaling behaviour of this observable’s fluctuations with increasing beam energy: the data do not appear to fall on a single straight line, but rather seem to be grouped into two “branches” with different slopes. Although most of the data in Figure 8a lie close to a line of slope , this does not correspond to a universal scaling law, as all data in Figure 8b do not collapse onto a single universal curve under the first scaling law (Equation 1 with ). This confirms that there is a change in the scaling behaviour of fluctuations with increasing energy. The charge of the largest fragment in each event, and not the fragment multiplicity, seems therefore to be a good candidate for the order parameter of multifragmentation in central collisions at these energies.
IV.3 Evolution of the scaling behaviour of order parameter fluctuations with incident energy
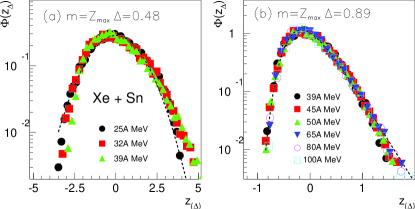
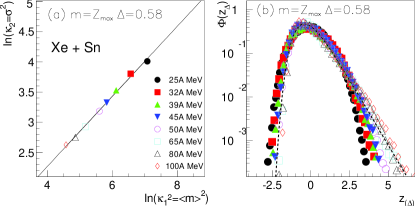
Figure 8b shows that the scaled distributions for Xe+Sn collisions from 45 MeV upwards are nearly identical even in the large- tails which are 2 orders of magnitude less probable than the most probable value of . The 39 MeV data can also be included in this group if the small differences in the tail of the distribution are neglected. However, the 32 MeV distribution is clearly significantly narrower, while the distribution for 25 MeV is evidently of a different form, as can be seen both in the tails and around the maximum (see comments on the comparison of experimental distributions with this technique in Sec.II).
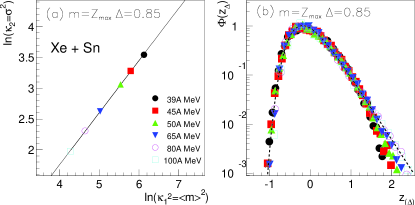
Using the values of extracted from Fig.8a using a linear fit to the two ’branches’ (25-39 MeV and 39-100 MeV) we find a good scaling of distributions using at the lowest beam energies (Figure 9a), whereas for the higher energies the fluctuations of the size of the largest fragment increase like (Figure 9b). An approximately equally good scaling for 39 MeV data is achieved in both cases, and this energy may be considered as close to a transition between the two regimes. Figure 9 also shows that the shape of the scaling function changes with increasing beam energy: it is nearly Gaussian at low energy (the dashed curved in Figure 9a represents a best fit to all data with a Gaussian distribution), but at higher energies it is rather asymmetric with a near-exponential tail for greater than its most probable value (see Sec. IV.5).
These observations establish the size (or charge) of the largest fragment as the most likely “order parameter” for fragment production in central collisions in this energy range. They also show that data can be assigned to one of two regimes depending on the -scaling properties of this order parameter. At low energies systems obey the second-scaling law associated with an ordered phase, while at higher energies the first-scaling law is observed, typical of a disordered phase (large fluctuations) Botet and Płoszajczak (2000). It should be noted that these regimes are defined, not by the average size of the largest fragment produced for a given incident energy (which would be a typical way to define e.g. liquid and gas phases), but rather by the way in which the fluctuations of this quantity evolve compared to its mean value. The identification of the largest fragment size as order parameter also indicates some similarity between fragment production in central collisions and the aggregation models with the second-order phase transition mentioned in Sec. II, whereas the monotonous behaviour of total and fragment multiplicities excludes “shattering” fragmentation models such as FIB Botet and Płoszajczak (1992).
Another, not necessarily incompatible, interpretation of the different regimes is suggested by Fig. 4. As we remarked in Sec. III.2 this figure suggests that at beam energies 39 MeV the heaviest fragment in central collisions is an evaporation residue of an (incomplete) fusion reaction. The data presented in Fig. 8a for incident energies 25-50 MeV correspond to the points highlighted by a circle in Fig. 4. Therefore the transition from a to a branch can be interpreted as being linked to the disappearance of fusion-evaporation residues, and signalling either the onset of fusion-multifragmentation (phase transition) or the onset of transparency in central collisions (incomplete stopping).
It should be noted that the transition energy of around 39 MeV for the Xe+Sn system is slightly higher than that found in Botet et al. (2001) (32 MeV). This is due to the different method of selection of ’central collisions’. In this paper we define central collisions based on the amount of energy deposited into the light charged particles’ degrees of freedom (). As we are dealing with finite systems this reduces the energy available for the fragment degrees of freedom, due to energy conservation. This is consistent with the fact that when central collisions are selected based on fragment degrees of freedom (the fragment kinetic energy flow angle selection of Lecolley et al. (1994); Marie et al. (1997); Frankland et al. (2001a)) the multifragmentation regime is observed at lower incident energy for the same system (32 MeV for Xe+Sn in Frankland et al. (2001b)), as is the transition to the scaling regime.
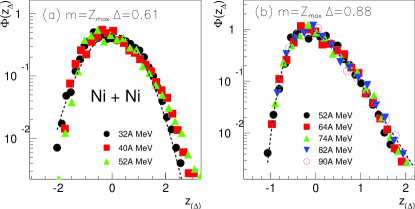
The observed scaling properties of fluctuations are confirmed by the Ni+Ni data, as shown by Figure 10 and Figure 11. Most data follow a scaling law for fluctuations, except at the lowest energies. The data do not all collapse to a single scaling function in terms of a law (Figure 10b), but only for bombarding energies MeV (Figure 11b). The similarity between the scaling functions observed for the two different systems should be noted, both in the “ordered” () and “disordered” () regimes (Figures 9 & 11 and Table 1).
IV.4 System-size dependence of energy of transition from “ordered” to “disordered” regime
We observe for the Xe+Sn and Ni+Ni data that the energy ranges corresponding to the different regimes are not the same for two systems of different total mass, the “transition” occurring around 39 MeV for Xe+Sn and 52 MeV for Ni+Ni. The “disordered” regime begins at lower incident (or available) energy for the heavier system. This tendency is confirmed by the data for Ar+KCl and Au+Au (figures 12 and 13).
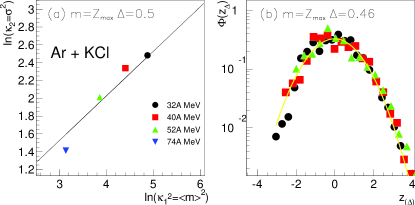
The former has a total mass smaller than both Xe+Sn and Ni+Ni. The largest fragments produced in central collisions of 36Ar+KCl follow quite closely a scaling behaviour for beam energies up to at least 52 MeV (Figure 12a), while the data for 74 MeV, which deviate from the overall trend, may indicate a transition to the regime occurs somewhere between these last two available data points. The data for 32–52 MeV exhibit very similar near-Gaussian probability distributions. Although we can not have much confidence in a scaling law established for only two data points let us remark in passing that the scaling behaviour observed for data at 52 and 74 MeV is approximately a scaling with a scaling function of a form similar to that observed for the other “disordered” regime data, indicating that the transition energy for this system is probably somewhere between 52 and 74 MeV, higher than for the heavier systems.
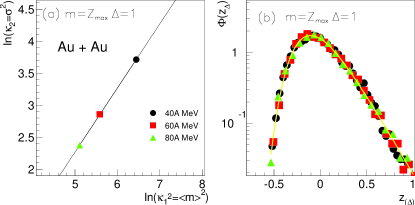
On the other hand, for the much heavier 197Au+197Au system a scaling law is observed for fluctuations of the size of the largest fragment in each event for all studied beam energies (Figure 13). Even at the lowest energy (40 MeV) the scaling of the entire distribution with the other energies is excellent. For this system it may be that the beam energy of the transition from the regime, if it exists, to occurs at a lower energy than the lowest energy available for study in our data, which may explain why we do not observe an “ordered” regime for this system. Of course it is equally possible that no such regime exists for this system. Indeed, following the interpretation of Sec.IV.3 in terms of the disappearance of fusion-evaporation residues, we would not expect fusion to occur for a system as heavy as Au+Au at any incident energy.
We therefore observe that the bombarding energy (or available energy) at which there is a transition from the “ordered” to the “disordered” regime decreases with increasing total mass of the system under study. This is represented in Figure 14.
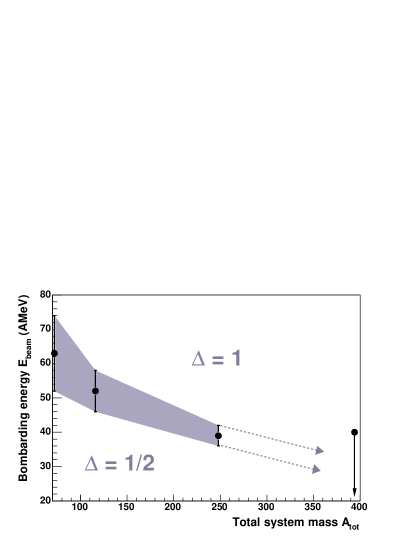
If one interprets our results in the framework of the universal fluctuations theory, i.e. in terms of a 2nd order phase transition, one would expect the energy at which one phase is replaced by the other to be related to the critical temperature of the corresponding system. The definition of this quantity for finite, charged, systems such as nuclei has received much theoretical attention. On the one hand, in the absence of Coulomb forces, a pseudo-critical temperature (corresponding to a large peak in the finite system specific heat) may be defined which is smaller than the infinite matter value , and increases as the size of the system approaches the infinite matter limit Jaqaman et al. (1984). On the other hand, calculations including the Coulomb repulsion show that the maximum temperature that an equilibrated hot nucleus can support , , decreases for heavier nuclei, due to their increasing nuclear charge Levit and Bonche (1985). A recent systematic study of a wide range of data on so-called caloric curves by Natowitz et al Natowitz et al. (2002) has shown that the temperature and excitation energy at which a plateau is observed in these curves decreases with increasing mass of the primary excited nucleus, and that such behaviour is consistent with theoretical predictions for the limiting temperatures, .
In the present analysis we chose not to study this question in more detail, as to do so would require: (i) to show that the fragment production is thermally-driven; (ii) to identify the thermal (sub-)system in each case; and (iii) to deduce the mass, charge, excitation energy and temperature of this (sub-)system. Each step would require us to make important hypotheses about the formation and decay properties of fragments in the collisions under study, taking us far from our initial goal of determining as much information as possible on the nature of fragment production with a minimum number of suppositions. Moreover, the observed effect, which depends on the entrance channel total mass and available/bombarding energy may have a completely different origin. Therefore we will limit ourselves to the observation that the transition from “ordered” to “disordered” regime takes place at a lower available energy for systems of greater total mass.
IV.5 Detailed study of the form of the scaling functions
| System | (AMeV) | () | ||||
|---|---|---|---|---|---|---|
| Xe+Sn | 25–39 | 0.48 | 0.45 | 0.66 | 27 | – |
| Ni+Ni | 32–52 | 0.61 | 0.48 | 0.64 | 72 | – |
| Ar+KCl | 32–52+ | 0.46 | 0.33 | 0.64 | 63 | – |
| Au+Au | 40–80 | 1.00 | 0.83 | 1.39 | 1.8 | 0.92.09(1.3) |
| Xe+Sn | 39–100 | 0.89 | 0.85 | 1.20 | 11 | 1.20.03(1.2) |
| Ni+Ni | 52–90 | 0.88 | 0.84 | 1.30 | 45 | 1.54.04(7) |
The results of the analysis for all the systems presented here are summarized in Table 1. Systems have been grouped according to their observed -scaling behaviour, at the lowest beam energies and at the highest. In order to get some quantitative information on the form of the scaling function in each case, we calculated the overall coefficient of skewness, , and the kurtosis, , for each system in each regime, using the following definitions Roe (1992)
| (3) |
| (4) |
Larger skewness values indicate more asymmetric distributions, while the kurtosis measures the deviation of the distribution from the Gaussian form ( being a perfect Gaussian). The values shown in the table confirm our observation that the higher-energy, -scaling data present more asymmetric, less Gaussian probability distributions than those at lower energy. It can also be seen that, quantitatively, the scaling functions corresponding to the two regimes for systems of different masses have very similar forms, confirming the fact that data for different systems do indeed collapse on to a single distribution.
In the “ordered” regime the fluctuations of the size of the largest fragment show a significant deviation from a Gaussian distribution, on the contrary to the near-perfect Gaussian distributions that we observe for total and fragment multiplicities (Figures 5, 6 and 7). For the “disordered” regime the deviation from the Gaussian form is large and the shape of the distribution function is well reproduced by a Gumbel distribution,
| (5) |
This is shown by the dashed curves in Figures 9b and 11b, and the grey curve in Figure 13b, which represent the best fits to these data using Equation 5. The overall agreement can be seen to be quite good, and excellent for the Au+Au data where is achieved. Some significant deviations can be seen however in the tail of the distributions for the lighter systems Ni+Ni and Xe+Sn: the data seem to have a faster-than-exponential fall-off for large (positive) fluctuations about the mean value.
To confirm this in a quantitative manner we performed fits to the tails of these functions with the asymptotic scaling function form (see Table 1). They show that the exponent is very close to 1 for the Au+Au data, confirming the observation of an exponential tail compatible with the Gumbel distribution, while for Ni+Ni and Xe+Sn data we find . Let us remark in passing that, just as seems to increase toward the asymptotic value of 1 with increasing system mass in the “disordered” regime, it is possible that also has a systematic mass dependence, and decreases towards an asymptotic value of 1 (exponential tail) for the heaviest system.
We have clearly and quantitatively established the form of the scaling functions in the two regimes, and in the data presented here we do not observe any deviation from these “canonical” forms, quasi-Gaussian at low energy and quasi-Gumbel at high energy. We do not, therefore, have any information on the nature of the transition between the two regimes: as we discussed in Section II we cannot be certain of the form of the scaling function at the critical point, but one may see a sharp decrease of the large- tails (faster than ), or an order parameter distribution (OPD) with an exponential large- tail but significantly different from the Gumbel distribution around the maximum and below Botet and Płoszajczak (in preparation). On the other hand, for a first-order phase transition with a passage through the coexistence region, although the scaling behaviour of the OPD is not well established Botet and Płoszajczak (2000); Carmona et al. (2002), by definition in this case the order parameter should present a bimodal (double-humped or very wide) distribution. More detailed study of existing and new data around the transition energy of 39 MeV (for the Xe+Sn system) may yet reveal such features.
IV.6 Dependence of the observed scaling behaviour on the violence/centrality of collisions
The results presented above come from a wide-ranging set of data concerning different system energies and masses, but they represent only 1% of the total measured cross-section due to our centrality cut. The representativity of the observed scaling behaviour is far from certain in this case, as it is well known that data selected by cuts in distribution tails are prone to serious autocorrelation effects due to conservation laws Phair et al. (1992); Llope et al. (1995). We therefore have to study the dependence of our findings on the strictness of our centrality cuts. In Figure 15 the data for the same Xe+Sn collisions as in Figure 9b have been analyzed with a slightly relaxed centrality cut, . The effect on the apparent value of can be seen from the cumulant moments plot, Figure 15a: relaxing the centrality condition gives an apparent scaling law with a smaller value of , which is here instead of (see Table 1). A similar dependence on the estimated centrality of collisions was observed in Botet et al. (2001), and interpreted in terms of a smaller excitation energy of fragmenting systems in less central collisions. However, as Figure 15b shows, the -scaling actually begins to break down for these less central data, as can be seen in the high- tail of the “scaling” function.
If the centrality condition is relaxed even further, (Figure 16), we first observe that now apparently all of the data for Xe+Sn is compatible with an approximate second-scaling law (), without any change of scaling regime between 25 and 100 MeV. However we can not assign the data to a single “ordered” regime because in fact this is not true -scaling: the different distributions no longer collapse to a universal curve (Figure 16b).
Therefore we observe universal fluctuations and behaviour of the observable compatible with it being an order parameter for nuclear multifragmentation only for very central collisions of symmetric systems for which one may suppose a near-to-total overlap of the projectile and target in the entrance channel. We have not, up to now, observed an equivalent scaling for quasi-projectile residues in mid-peripheral to peripheral collisions. This may be because in such reactions the fragment production is far more sensitive to entrance channel effects, which vary greatly as a function of the colliding nuclei and their energies. If so, a meaningful comparison between different systems is harder to achieve, at least with our rather “global” approach. In head-on collisions, on the other hand, the fragmentation of the projectile and target may be virtually a statistical (although not necessarily thermal) process, far less sensitive to the details of the reaction, and therefore more amenable to reveal features which are independent of the system under study.
V Summary
We have studied nuclear multifragmentation data obtained with the INDRA 4 array for collisions of symmetric systems of total mass at bombarding energies from 25 to 100 MeV. Using the total transverse energy of light charged particles, , as a measure of collision violence, we deduced the evolution of these reactions with beam energy, impact parameter and system size from the experimentally measured correlations between the charge of the largest fragment detected in each event, , and . For all data presented in this work these correlations are dominated by reactions leading to a projectile-like fragment whose size decreases with increasing collision violence. In the case of the heaviest projectiles (Xe, Au) fission of the moderately excited quasi-projectile modify this picture. For higher excitation energies the opening of the quasi-projectile multifragmentation channel may exhibit a bimodal behaviour which has been evidenced Tamain et al. (2003) in selecting complete detection events. On the other hand, in central collisions for a few percent of the measured cross-section “heavy” residues are produced in the systems Ar+KCl, Ni+Ni and Xe+Sn, suggesting incomplete fusion of projectile and target, for beam energies which are not too high ( MeV for Ar+KCl, MeV for Ni+Ni, MeV for Xe+Sn).
Using a model-independent analysis based on the theory of universal fluctuations of the order parameter for finite systems, we tested the most violent collisions for signals that the fragment production may be related to a phase transition. Following the results of Botet et al. (2001) we first confirmed that, of the two possible order parameters for a critical fragmentation process, it is the charge (size) of the largest fragment, , and not the total or IMF multiplicities or , which has a behaviour of the scaling properties of its fluctuations compatible with its being an order parameter for a critical fragmentation process. Indeed, we have shown that the event-by-event distribution of allows to sort data into two fluctuation-scaling regimes defined by the value of the scaling exponent , which is approximately equal to at low energies and tends towards the asymptotic value 1 at high energies with increasing total system size. These regimes are equally well characterised by a distinctive form of the scaling function . At low energies this function, although more symmetric than that seen at higher energy, is significantly different from the Gaussian form. The deviation is quantitatively the same for the three different-sized systems (Ar+KCl, Ni+Ni and Xe+Sn) for which we observed this low-energy regime. In the high-energy regime the scaling function is more asymmetric and tends towards the asymptotic form of the Gumbel distribution with increasing system mass. This evolution concerns mainly the large- tail of the distribution which falls off more slowly for heavier systems, becoming exponential. For the Au+Au system is an almost perfect Gumbel distribution.
The bombarding energy at which the passage from one regime to the other is situated decreases as the total system mass (and charge) increases. This is the contrary of the expected behaviour if this transition were related to the critical temperature of the systems under study, which would increase with the mass, but is on the other hand consistent with the observation of decreasing limiting temperatures for finite nuclei Natowitz et al. (2002) due to the increase in Coulomb energy for heavy nuclei. However, we can only speculate whether this is the reason for our observation, as our analysis does not depend on any model of fragment production such as supposing it to be equilibrated or thermally-driven, and therefore it does not give any information on whether these conditions are met or not. On the other hand, data strongly suggest that the dependence on entrance channel mass and bombarding energy of the two regimes is closely linked to the disappearance of heavy residues in central collisions.
Although this analysis allows to establish the existence of two distinct regimes in multifragmentation reactions based on the scaling properties of the fluctuations of the largest fragment, it has not given any information on the passage from one regime to the other. In the data studied so far we observe only order parameter distributions which are compatible with weakly-correlated systems, i.e. far from the critical point. It may be that the general survey of a wide range of data presented here is not sufficiently detailed to reveal such features, or that data taken in small bombarding energy steps around the “transition energy” is necessary to track the evolution of the order parameter distribution. Such additional data for the Xe+Sn system have been measured recently and are currently under analysis. It is our feeling that the present work constitutes a solid basis for further study of the question of criticality in nuclear multifragmentation data.
Acknowledgements.
We would like to thank M. Płoszajczak for fruitful discussions and the support and interest he has shown in our work. We thank also the staff of the GANIL and GSI Accelerator facilities for their support during the experiments. This work was supported by the European Community under contract No. ERBFMGECT950083, and by the Commissariat à l’Energie Atomique, the Centre National de la Recherche Scientifique, the Ministère de l’Education Nationale, the Conseil Régional de Basse Normandie and the Association Française des Femmes Diplômées des Universités.References
- de Souza et al. (1991) R. T. de Souza et al., Phys. Lett. B268, 6 (1991).
- Bowman et al. (1991) D. R. Bowman et al., Phys. Rev. Lett. 67, 1527 (1991).
- Ogilvie et al. (1991) C. Ogilvie et al., Phys. Rev. Lett. 67, 1214 (1991).
- Tsang et al. (1993) M. B. Tsang et al., Phys. Rev. Lett. 71, 1502 (1993).
- Peaslee et al. (1994) G. F. Peaslee et al., Phys. Rev. C49, R2271 (1994).
- Bertsch and Siemens (1983) G. Bertsch and P. J. Siemens, Phys. Lett. B126, 9 (1983).
- Fai et al. (1985) G. Fai, L. P. Csernai, J. Randrup, and H. Stocker, Phys. Lett. B164, 265 (1985).
- Peilert et al. (1989) G. Peilert et al., Phys. Rev. C39, 1402 (1989).
- Finn et al. (1982) J. E. Finn et al., Phys. Rev. Lett. 49, 1321 (1982).
- Minich (1982) R. W. Minich, Phys. Lett. B118, 458 (1982).
- Fisher (1967) M. E. Fisher, Physics (N.Y.) 3, 255 (1967).
- Friedman and Lynch (1983) W. Friedman and W. G. Lynch, Phys. Rev. C28, 16 (1983).
- Charity et al. (1988) R. J. Charity et al., Nucl. Phys. A483, 371 (1988).
- Durand et al. (1992) D. Durand et al., Nucl. Phys. A541, 266 (1992).
- Llope et al. (1995) W. J. Llope et al., Phys. Rev. C51, 1325 (1995).
- Friedman (1990) W. Friedman, Phys. Rev. C42, 667 (1990).
- Gross (1990) D. H. E. Gross, Rep. Prog. Phys. 53, 605 (1990).
- Bondorf et al. (1995) J. P. Bondorf, A. S. Botvina, A. S. Iljinov, I. N. Mishustin, and K. Sneppen, Phys. Rep. 257, 133 (1995).
- Campi (1988) X. Campi, Phys. Lett. B208, 351 (1988).
- Mekjian et al. (1998) A. Mekjian et al., Phys. Rev. C57, 1361 (1998).
- Richert and Wagner (2001) J. Richert and P. Wagner, Phys. Rept. 350, 1 (2001).
- Moretto and Wozniak (1993) L. G. Moretto and G. J. Wozniak, Ann. Rev. Nucl. Part. Sci. 43, 379 (1993).
- Lott et al. (1992) B. Lott et al., Phys. Rev. Lett. 68, 3141 (1992).
- Toke et al. (1995) J. Toke et al., Phys. Rev. Lett. 75, 2920 (1995).
- Dempsey et al. (1996) J. F. Dempsey et al., Phys. Rev. C54, 1710 (1996).
- Kunde et al. (1996) G. J. Kunde et al., Phys. Rev. Lett. 77, 2897 (1996).
- Larochelle et al. (1996) Y. Larochelle et al., Phys. Rev. C53, 823 (1996).
- Marie et al. (1997) N. Marie et al. (INDRA collaboration), Phys. Lett. B391, 15 (1997).
- Łukasik et al. (1997) J. Łukasik et al. (INDRA collaboration), Phys. Rev. C55, 1906 (1997).
- Nebauer et al. (1999) R. Nebauer, J. Aichelin, et al. (INDRA collaboration), Nucl. Phys. A658, 67 (1999).
- Plagnol et al. (1999) E. Plagnol et al. (INDRA collaboration), Phys. Rev. C61, 014606 (1999).
- Lefort et al. (2000) T. Lefort et al. (INDRA collaboration), Nucl. Phys. A662, 397 (2000).
- Djerroud et al. (2001) B. Djerroud et al., Phys. Rev. C64, 034603 (2001).
- Frankland et al. (2001a) J. D. Frankland et al. (INDRA collaboration), Nucl. Phys. A689, 905 (2001a).
- Frankland et al. (2001b) J. D. Frankland et al. (INDRA collaboration), Nucl. Phys. A689, 940 (2001b).
- Borderie et al. (2001) B. Borderie et al. (INDRA collaboration), Phys. Rev. Lett. 86, 3252 (2001).
- Bellaize et al. (2002) N. Bellaize, O. Lopez, J. P. Wieleczko, D. Cussol, G. Auger, C. Bacri, F. Bocage, B. Borderie, R. Bougault, B. Bouriquet, et al. (INDRA collaboration), Nucl. Phys. A 709, 367 (2002).
- Colin et al. (2003) J. Colin, D. Cussol, J. Normand, N. Bellaize, R. Bougault, A. M. Buta, D. Durand, O. Lopez, L. Manduci, J. Marie, et al. (INDRA collaboration), Phys. Rev. C 67, 064603 (2003).
- Charvet et al. (2004) J. L. Charvet, R. Dayras, D. Durand, O. Lopez, L. Nalpas, A. van Lauwe, C. Volant, D. Cussol, and D. Doré, Nucl. Phys. A730, 431 (2004).
- Botet et al. (1997) R. Botet, M. Płoszajczak, and V. Latora, Phys. Rev. Lett 78, 4593 (1997).
- Botet and Płoszajczak (1999) R. Botet and M. Płoszajczak, J. of Sol-Gel Science and Technology 15, 167 (1999).
- Botet and Płoszajczak (2000) R. Botet and M. Płoszajczak, Phys. Rev. E62, 1825 (2000).
- Botet and Płoszajczak (2001) R. Botet and M. Płoszajczak, Nucl. Phys. Proc. Suppl. 92, 101 (2001), eprint [http://arXiv.org/abs]hep-ph/0009233.
- Botet et al. (2001) R. Botet et al., Phys. Rev. Lett. 86, 3514 (2001).
- Gumbel (1958) E. Gumbel, Statistics of extremes (Columbia University Press, 1958).
- Botet and Płoszajczak (1992) R. Botet and M. Płoszajczak, Phys. Rev. Lett. 69, 3696 (1992).
- Pouthas et al. (1995a) J. Pouthas, B. Borderie, R. Dayras, E. Plagnol, M.-F. Rivet, F. Saint-Laurent, J.-C. Steckmeyer, et al., Nucl. Instr. and Meth. in Phys. Res. A357, 418 (1995a).
- Steckmeyer et al. (1995) J. C. Steckmeyer, D. Cussol, J. Duchon, J. Gautier, J. Laville, P. L. Botlan, A. Leconte, J. Lelandais, V. Métivier, P. Mosrin, et al., Nucl. Instr. and Meth. in Phys. Res. A361, 472 (1995).
- Pouthas et al. (1995b) J. Pouthas, A. Bertaut, B. Borderie, P. Bourgault, B. Cahan, G. Carles, D. Charlet, D. Cussol, R. Dayras, M. Engrand, et al., Nucl. Instr. and Meth. in Phys. Res. A369, 222 (1995b).
- Tăbăcaru et al. (1999) G. Tăbăcaru, B. Borderie, A. Ouatizerga, M. Parlog, M.-F. Rivet, et al. (INDRA collaboration), Nucl. Instr. and Meth. in Phys. Res. A428, 379 (1999).
- Pârlog et al. (2002a) M. Pârlog, B. Borderie, M.-F. Rivet, G. Tabacaru, A. Chbihi, M. Elouardi, N. Leneindre, O. Lopez, E. Plagnol, L. Tassan-Got, et al. (INDRA collaboration), Nucl. Instr. and Meth. in Phys. Res. A482, 674 (2002a).
- Pârlog et al. (2002b) M. Pârlog, B. Borderie, M.-F. Rivet, G. Tabacaru, A. Chbihi, M. Elouardi, N. Leneindre, O. Lopez, E. Plagnol, L. Tassan-Got, et al. (INDRA collaboration), Nucl. Instr. and Meth. in Phys. Res. A482, 693 (2002b).
- Trzciński et al. (2003) A. Trzciński, J. Łukasik, W. F. J. Müller, W. Trautmann, B. Zwiegliński, G. Auger, C. O. Bacri, M. L. Begemann-Blaich, N. Bellaize, R. Bittiger, et al. (INDRA and ALADIN collaborations), Nucl. Inst. Meth. A501, 367 (2003).
- Métivier et al. (2000) V. Métivier et al. (INDRA collaboration), Nucl. Phys. A672, 357 (2000).
- Bocage et al. (2000) F. Bocage et al. (INDRA collaboration), Nucl. Phys. A676, 391 (2000).
- Ono et al. (2002) A. Ono, S. Hudan, A. Chbihi, and J. D. Frankland, Phys. Rev. C66, 014603 (2002).
- Le Fevre et al. (2004) A. Le Fevre et al. (INDRA and ALADIN collaborations), Nucl. Phys. A735, 219 (2004).
- Frankland et al. (2002) J. D. Frankland et al. (INDRA collaboration), in Proc. XL Int. Wint. Meet. On Nuclear Physics, edited by I.Iori (Ricerca scientifica ed educazione permanente, 2002), eprint [http://arXiv.org/abs]nucl-ex/0202026.
- Cavata et al. (1990) C. Cavata et al., Phys. Rev. C42, 1760 (1990).
- Sisan et al. (2001) D. Sisan et al., Phys. Rev. C63, 027602 (2001).
- Lecolley et al. (1994) J. Lecolley et al., Phys. Lett. B391, 317 (1994).
- Jaqaman et al. (1984) H. Jaqaman, A. Mekjian, and L. Zamick, Phys. Rev. C29, 2067 (1984).
- Levit and Bonche (1985) S. Levit and P. Bonche, Nucl. Phys. A437, 426 (1985).
- Natowitz et al. (2002) J. B. Natowitz et al., Phys. Rev. C65, 034618 (2002), eprint [http://arXiv.org/abs]nucl-ex/0106016.
- Roe (1992) B. Roe, Probability and statistics in experimental physics (Springer-Verlag New York, Inc., 1992).
- Botet and Płoszajczak (in preparation) R. Botet and M. Płoszajczak (in preparation).
- Carmona et al. (2002) J. M. Carmona, J. Richert, and P. Wagner, Phys. Lett. B531, 71 (2002).
- Phair et al. (1992) L. Phair et al., Nucl. Phys. A548, 489 (1992).
- Tamain et al. (2003) B. Tamain, M. Pichon, et al. (INDRA collaboration), in Proc. IWM2003 (Int. Work. on Multifragmentation and Related Topics) (Istituto Nazionale di Fisica Nucleare, 2003).