Centrality and pseudorapidity dependence of charged hadron
production at intermediate in Au + Au collisions
at GeV
J. Adams
University of Birmingham, Birmingham, United Kingdom
M.M. Aggarwal
Panjab University, Chandigarh 160014, India
Z. Ahammed
Variable Energy Cyclotron Centre, Kolkata 700064, India
J. Amonett
Kent State University, Kent, Ohio 44242
B.D. Anderson
Kent State University, Kent, Ohio 44242
D. Arkhipkin
Particle Physics Laboratory (JINR), Dubna, Russia
G.S. Averichev
Laboratory for High Energy (JINR), Dubna, Russia
Y. Bai
NIKHEF, Amsterdam, The Netherlands
J. Balewski
Indiana University, Bloomington, Indiana 47408
O. Barannikova
Purdue University, West Lafayette, Indiana 47907
L.S. Barnby
University of Birmingham, Birmingham, United Kingdom
J. Baudot
Institut de Recherches Subatomiques, Strasbourg, France
S. Bekele
Ohio State University, Columbus, Ohio 43210
V.V. Belaga
Laboratory for High Energy (JINR), Dubna, Russia
R. Bellwied
Wayne State University, Detroit, Michigan 48201
J. Berger
University of Frankfurt, Frankfurt, Germany
B.I. Bezverkhny
Yale University, New Haven, Connecticut 06520
S. Bharadwaj
University of Rajasthan, Jaipur 302004, India
V.S. Bhatia
Panjab University, Chandigarh 160014, India
H. Bichsel
University of Washington, Seattle, Washington 98195
A. Billmeier
Wayne State University, Detroit, Michigan 48201
L.C. Bland
Brookhaven National Laboratory, Upton, New York 11973
C.O. Blyth
University of Birmingham, Birmingham, United Kingdom
B.E. Bonner
Rice University, Houston, Texas 77251
M. Botje
NIKHEF, Amsterdam, The Netherlands
A. Boucham
SUBATECH, Nantes, France
A. Brandin
Moscow Engineering Physics Institute, Moscow Russia
A. Bravar
Brookhaven National Laboratory, Upton, New York 11973
M. Bystersky
Nuclear Physics Institute AS CR, 250 68 Řež/Prague, Czech Republic
R.V. Cadman
Argonne National Laboratory, Argonne, Illinois 60439
X.Z. Cai
Shanghai Institute of Applied Physics, Shanghai 201800, China
H. Caines
Yale University, New Haven, Connecticut 06520
M. Calderón de la Barca Sánchez
Brookhaven National Laboratory, Upton, New York 11973
J. Carroll
Lawrence Berkeley National Laboratory, Berkeley, California 94720
J. Castillo
Lawrence Berkeley National Laboratory, Berkeley, California 94720
D. Cebra
University of California, Davis, California 95616
P. Chaloupka
Nuclear Physics Institute AS CR, 250 68 Řež/Prague, Czech Republic
S. Chattopdhyay
Variable Energy Cyclotron Centre, Kolkata 700064, India
H.F. Chen
University of Science & Technology of China, Anhui 230027, China
Y. Chen
University of California, Los Angeles, California 90095
J. Cheng
Tsinghua University, Beijing 100084, China
M. Cherney
Creighton University, Omaha, Nebraska 68178
A. Chikanian
Yale University, New Haven, Connecticut 06520
W. Christie
Brookhaven National Laboratory, Upton, New York 11973
J.P. Coffin
Institut de Recherches Subatomiques, Strasbourg, France
T.M. Cormier
Wayne State University, Detroit, Michigan 48201
J.G. Cramer
University of Washington, Seattle, Washington 98195
H.J. Crawford
University of California, Berkeley, California 94720
D. Das
Variable Energy Cyclotron Centre, Kolkata 700064, India
S. Das
Variable Energy Cyclotron Centre, Kolkata 700064, India
M.M. de Moura
Universidade de Sao Paulo, Sao Paulo, Brazil
A.A. Derevschikov
Institute of High Energy Physics, Protvino, Russia
L. Didenko
Brookhaven National Laboratory, Upton, New York 11973
T. Dietel
University of Frankfurt, Frankfurt, Germany
W.J. Dong
University of California, Los Angeles, California 90095
X. Dong
University of Science & Technology of China, Anhui 230027, China
J.E. Draper
University of California, Davis, California 95616
F. Du
Yale University, New Haven, Connecticut 06520
A.K. Dubey
Insitute of Physics, Bhubaneswar 751005, India
V.B. Dunin
Laboratory for High Energy (JINR), Dubna, Russia
J.C. Dunlop
Brookhaven National Laboratory, Upton, New York 11973
M.R. Dutta Mazumdar
Variable Energy Cyclotron Centre, Kolkata 700064, India
V. Eckardt
Max-Planck-Institut für Physik, Munich, Germany
W.R. Edwards
Lawrence Berkeley National Laboratory, Berkeley, California 94720
L.G. Efimov
Laboratory for High Energy (JINR), Dubna, Russia
V. Emelianov
Moscow Engineering Physics Institute, Moscow Russia
J. Engelage
University of California, Berkeley, California 94720
G. Eppley
Rice University, Houston, Texas 77251
B. Erazmus
SUBATECH, Nantes, France
M. Estienne
SUBATECH, Nantes, France
P. Fachini
Brookhaven National Laboratory, Upton, New York 11973
J. Faivre
Institut de Recherches Subatomiques, Strasbourg, France
R. Fatemi
Indiana University, Bloomington, Indiana 47408
J. Fedorisin
Laboratory for High Energy (JINR), Dubna, Russia
K. Filimonov
Lawrence Berkeley National Laboratory, Berkeley, California 94720
P. Filip
Nuclear Physics Institute AS CR, 250 68 Řež/Prague, Czech Republic
E. Finch
Yale University, New Haven, Connecticut 06520
V. Fine
Brookhaven National Laboratory, Upton, New York 11973
Y. Fisyak
Brookhaven National Laboratory, Upton, New York 11973
K.J. Foley
Brookhaven National Laboratory, Upton, New York 11973
K. Fomenko
Laboratory for High Energy (JINR), Dubna, Russia
J. Fu
Tsinghua University, Beijing 100084, China
C.A. Gagliardi
Texas A&M University, College Station, Texas 77843
J. Gans
Yale University, New Haven, Connecticut 06520
M.S. Ganti
Variable Energy Cyclotron Centre, Kolkata 700064, India
L. Gaudichet
SUBATECH, Nantes, France
F. Geurts
Rice University, Houston, Texas 77251
V. Ghazikhanian
University of California, Los Angeles, California 90095
P. Ghosh
Variable Energy Cyclotron Centre, Kolkata 700064, India
J.E. Gonzalez
University of California, Los Angeles, California 90095
O. Grachov
Wayne State University, Detroit, Michigan 48201
O. Grebenyuk
NIKHEF, Amsterdam, The Netherlands
D. Grosnick
Valparaiso University, Valparaiso, Indiana 46383
S.M. Guertin
University of California, Los Angeles, California 90095
A. Gupta
University of Jammu, Jammu 180001, India
T.D. Gutierrez
University of California, Davis, California 95616
T.J. Hallman
Brookhaven National Laboratory, Upton, New York 11973
A. Hamed
Wayne State University, Detroit, Michigan 48201
D. Hardtke
Lawrence Berkeley National Laboratory, Berkeley, California 94720
J.W. Harris
Yale University, New Haven, Connecticut 06520
M. Heinz
Yale University, New Haven, Connecticut 06520
T.W. Henry
Texas A&M University, College Station, Texas 77843
S. Hepplemann
Pennsylvania State University, University Park, Pennsylvania 16802
B. Hippolyte
Yale University, New Haven, Connecticut 06520
A. Hirsch
Purdue University, West Lafayette, Indiana 47907
E. Hjort
Lawrence Berkeley National Laboratory, Berkeley, California 94720
G.W. Hoffmann
University of Texas, Austin, Texas 78712
H.Z. Huang
University of California, Los Angeles, California 90095
S.L. Huang
University of Science & Technology of China, Anhui 230027, China
E.W. Hughes
California Institute of Technology, Pasedena, California 91125
T.J. Humanic
Ohio State University, Columbus, Ohio 43210
G. Igo
University of California, Los Angeles, California 90095
A. Ishihara
University of Texas, Austin, Texas 78712
P. Jacobs
Lawrence Berkeley National Laboratory, Berkeley, California 94720
W.W. Jacobs
Indiana University, Bloomington, Indiana 47408
M. Janik
Warsaw University of Technology, Warsaw, Poland
H. Jiang
University of California, Los Angeles, California 90095
P.G. Jones
University of Birmingham, Birmingham, United Kingdom
E.G. Judd
University of California, Berkeley, California 94720
S. Kabana
Yale University, New Haven, Connecticut 06520
K. Kang
Tsinghua University, Beijing 100084, China
M. Kaplan
Carnegie Mellon University, Pittsburgh, Pennsylvania 15213
D. Keane
Kent State University, Kent, Ohio 44242
V.Yu. Khodyrev
Institute of High Energy Physics, Protvino, Russia
J. Kiryluk
Massachusetts Institute of Technology, Cambridge, MA 02139-4307
A. Kisiel
Warsaw University of Technology, Warsaw, Poland
E.M. Kislov
Laboratory for High Energy (JINR), Dubna, Russia
J. Klay
Lawrence Berkeley National Laboratory, Berkeley, California 94720
S.R. Klein
Lawrence Berkeley National Laboratory, Berkeley, California 94720
A. Klyachko
Indiana University, Bloomington, Indiana 47408
D.D. Koetke
Valparaiso University, Valparaiso, Indiana 46383
T. Kollegger
University of Frankfurt, Frankfurt, Germany
M. Kopytine
Kent State University, Kent, Ohio 44242
L. Kotchenda
Moscow Engineering Physics Institute, Moscow Russia
M. Kramer
City College of New York, New York City, New York 10031
P. Kravtsov
Moscow Engineering Physics Institute, Moscow Russia
V.I. Kravtsov
Institute of High Energy Physics, Protvino, Russia
K. Krueger
Argonne National Laboratory, Argonne, Illinois 60439
C. Kuhn
Institut de Recherches Subatomiques, Strasbourg, France
A.I. Kulikov
Laboratory for High Energy (JINR), Dubna, Russia
A. Kumar
Panjab University, Chandigarh 160014, India
C.L. Kunz
Carnegie Mellon University, Pittsburgh, Pennsylvania 15213
R.Kh. Kutuev
Particle Physics Laboratory (JINR), Dubna, Russia
A.A. Kuznetsov
Laboratory for High Energy (JINR), Dubna, Russia
M.A.C. Lamont
University of Birmingham, Birmingham, United Kingdom
J.M. Landgraf
Brookhaven National Laboratory, Upton, New York 11973
S. Lange
University of Frankfurt, Frankfurt, Germany
F. Laue
Brookhaven National Laboratory, Upton, New York 11973
J. Lauret
Brookhaven National Laboratory, Upton, New York 11973
A. Lebedev
Brookhaven National Laboratory, Upton, New York 11973
R. Lednicky
Laboratory for High Energy (JINR), Dubna, Russia
S. Lehocka
Laboratory for High Energy (JINR), Dubna, Russia
M.J. LeVine
Brookhaven National Laboratory, Upton, New York 11973
C. Li
University of Science & Technology of China, Anhui 230027, China
Q. Li
Wayne State University, Detroit, Michigan 48201
Y. Li
Tsinghua University, Beijing 100084, China
S.J. Lindenbaum
City College of New York, New York City, New York 10031
M.A. Lisa
Ohio State University, Columbus, Ohio 43210
F. Liu
Institute of Particle Physics, CCNU (HZNU), Wuhan 430079, China
L. Liu
Institute of Particle Physics, CCNU (HZNU), Wuhan 430079, China
Q.J. Liu
University of Washington, Seattle, Washington 98195
Z. Liu
Institute of Particle Physics, CCNU (HZNU), Wuhan 430079, China
T. Ljubicic
Brookhaven National Laboratory, Upton, New York 11973
W.J. Llope
Rice University, Houston, Texas 77251
H. Long
University of California, Los Angeles, California 90095
R.S. Longacre
Brookhaven National Laboratory, Upton, New York 11973
M. Lopez-Noriega
Ohio State University, Columbus, Ohio 43210
W.A. Love
Brookhaven National Laboratory, Upton, New York 11973
Y. Lu
Institute of Particle Physics, CCNU (HZNU), Wuhan 430079, China
T. Ludlam
Brookhaven National Laboratory, Upton, New York 11973
D. Lynn
Brookhaven National Laboratory, Upton, New York 11973
G.L. Ma
Shanghai Institute of Applied Physics, Shanghai 201800, China
J.G. Ma
University of California, Los Angeles, California 90095
Y.G. Ma
Shanghai Institute of Applied Physics, Shanghai 201800, China
D. Magestro
Ohio State University, Columbus, Ohio 43210
S. Mahajan
University of Jammu, Jammu 180001, India
D.P. Mahapatra
Insitute of Physics, Bhubaneswar 751005, India
R. Majka
Yale University, New Haven, Connecticut 06520
L.K. Mangotra
University of Jammu, Jammu 180001, India
R. Manweiler
Valparaiso University, Valparaiso, Indiana 46383
S. Margetis
Kent State University, Kent, Ohio 44242
C. Markert
Yale University, New Haven, Connecticut 06520
L. Martin
SUBATECH, Nantes, France
J.N. Marx
Lawrence Berkeley National Laboratory, Berkeley, California 94720
H.S. Matis
Lawrence Berkeley National Laboratory, Berkeley, California 94720
Yu.A. Matulenko
Institute of High Energy Physics, Protvino, Russia
C.J. McClain
Argonne National Laboratory, Argonne, Illinois 60439
T.S. McShane
Creighton University, Omaha, Nebraska 68178
F. Meissner
Lawrence Berkeley National Laboratory, Berkeley, California 94720
Yu. Melnick
Institute of High Energy Physics, Protvino, Russia
A. Meschanin
Institute of High Energy Physics, Protvino, Russia
M.L. Miller
Massachusetts Institute of Technology, Cambridge, MA 02139-4307
Z. Milosevich
Carnegie Mellon University, Pittsburgh, Pennsylvania 15213
N.G. Minaev
Institute of High Energy Physics, Protvino, Russia
C. Mironov
Kent State University, Kent, Ohio 44242
A. Mischke
NIKHEF, Amsterdam, The Netherlands
D. Mishra
Insitute of Physics, Bhubaneswar 751005, India
J. Mitchell
Rice University, Houston, Texas 77251
B. Mohanty
Variable Energy Cyclotron Centre, Kolkata 700064, India
L. Molnar
Purdue University, West Lafayette, Indiana 47907
C.F. Moore
University of Texas, Austin, Texas 78712
M.J. Mora-Corral
Max-Planck-Institut für Physik, Munich, Germany
D.A. Morozov
Institute of High Energy Physics, Protvino, Russia
V. Morozov
Lawrence Berkeley National Laboratory, Berkeley, California 94720
M.G. Munhoz
Universidade de Sao Paulo, Sao Paulo, Brazil
B.K. Nandi
Variable Energy Cyclotron Centre, Kolkata 700064, India
T.K. Nayak
Variable Energy Cyclotron Centre, Kolkata 700064, India
J.M. Nelson
University of Birmingham, Birmingham, United Kingdom
P.K. Netrakanti
Variable Energy Cyclotron Centre, Kolkata 700064, India
V.A. Nikitin
Particle Physics Laboratory (JINR), Dubna, Russia
L.V. Nogach
Institute of High Energy Physics, Protvino, Russia
B. Norman
Kent State University, Kent, Ohio 44242
S.B. Nurushev
Institute of High Energy Physics, Protvino, Russia
G. Odyniec
Lawrence Berkeley National Laboratory, Berkeley, California 94720
A. Ogawa
Brookhaven National Laboratory, Upton, New York 11973
V. Okorokov
Moscow Engineering Physics Institute, Moscow Russia
M. Oldenburg
Lawrence Berkeley National Laboratory, Berkeley, California 94720
D. Olson
Lawrence Berkeley National Laboratory, Berkeley, California 94720
S.K. Pal
Variable Energy Cyclotron Centre, Kolkata 700064, India
Y. Panebratsev
Laboratory for High Energy (JINR), Dubna, Russia
S.Y. Panitkin
Brookhaven National Laboratory, Upton, New York 11973
A.I. Pavlinov
Wayne State University, Detroit, Michigan 48201
T. Pawlak
Warsaw University of Technology, Warsaw, Poland
T. Peitzmann
NIKHEF, Amsterdam, The Netherlands
V. Perevoztchikov
Brookhaven National Laboratory, Upton, New York 11973
C. Perkins
University of California, Berkeley, California 94720
W. Peryt
Warsaw University of Technology, Warsaw, Poland
V.A. Petrov
Particle Physics Laboratory (JINR), Dubna, Russia
S.C. Phatak
Insitute of Physics, Bhubaneswar 751005, India
R. Picha
University of California, Davis, California 95616
M. Planinic
University of Zagreb, Zagreb, HR-10002, Croatia
J. Pluta
Warsaw University of Technology, Warsaw, Poland
N. Porile
Purdue University, West Lafayette, Indiana 47907
J. Porter
Brookhaven National Laboratory, Upton, New York 11973
A.M. Poskanzer
Lawrence Berkeley National Laboratory, Berkeley, California 94720
M. Potekhin
Brookhaven National Laboratory, Upton, New York 11973
E. Potrebenikova
Laboratory for High Energy (JINR), Dubna, Russia
B.V.K.S. Potukuchi
University of Jammu, Jammu 180001, India
D. Prindle
University of Washington, Seattle, Washington 98195
C. Pruneau
Wayne State University, Detroit, Michigan 48201
J. Putschke
Max-Planck-Institut für Physik, Munich, Germany
G. Rai
Lawrence Berkeley National Laboratory, Berkeley, California 94720
G. Rakness
Pennsylvania State University, University Park, Pennsylvania 16802
R. Raniwala
University of Rajasthan, Jaipur 302004, India
S. Raniwala
University of Rajasthan, Jaipur 302004, India
O. Ravel
SUBATECH, Nantes, France
R.L. Ray
University of Texas, Austin, Texas 78712
S.V. Razin
Laboratory for High Energy (JINR), Dubna, Russia
D. Reichhold
Purdue University, West Lafayette, Indiana 47907
J.G. Reid
University of Washington, Seattle, Washington 98195
G. Renault
SUBATECH, Nantes, France
F. Retiere
Lawrence Berkeley National Laboratory, Berkeley, California 94720
A. Ridiger
Moscow Engineering Physics Institute, Moscow Russia
H.G. Ritter
Lawrence Berkeley National Laboratory, Berkeley, California 94720
J.B. Roberts
Rice University, Houston, Texas 77251
O.V. Rogachevskiy
Laboratory for High Energy (JINR), Dubna, Russia
J.L. Romero
University of California, Davis, California 95616
A. Rose
Wayne State University, Detroit, Michigan 48201
C. Roy
SUBATECH, Nantes, France
L. Ruan
University of Science & Technology of China, Anhui 230027, China
I. Sakrejda
Lawrence Berkeley National Laboratory, Berkeley, California 94720
S. Salur
Yale University, New Haven, Connecticut 06520
J. Sandweiss
Yale University, New Haven, Connecticut 06520
I. Savin
Particle Physics Laboratory (JINR), Dubna, Russia
P.S. Sazhin
Laboratory for High Energy (JINR), Dubna, Russia
J. Schambach
University of Texas, Austin, Texas 78712
R.P. Scharenberg
Purdue University, West Lafayette, Indiana 47907
N. Schmitz
Max-Planck-Institut für Physik, Munich, Germany
L.S. Schroeder
Lawrence Berkeley National Laboratory, Berkeley, California 94720
K. Schweda
Lawrence Berkeley National Laboratory, Berkeley, California 94720
J. Seger
Creighton University, Omaha, Nebraska 68178
P. Seyboth
Max-Planck-Institut für Physik, Munich, Germany
E. Shahaliev
Laboratory for High Energy (JINR), Dubna, Russia
M. Shao
University of Science & Technology of China, Anhui 230027, China
W. Shao
California Institute of Technology, Pasedena, California 91125
M. Sharma
Panjab University, Chandigarh 160014, India
W.Q. Shen
Shanghai Institute of Applied Physics, Shanghai 201800, China
K.E. Shestermanov
Institute of High Energy Physics, Protvino, Russia
S.S. Shimanskiy
Laboratory for High Energy (JINR), Dubna, Russia
F. Simon
Max-Planck-Institut für Physik, Munich, Germany
R.N. Singaraju
Variable Energy Cyclotron Centre, Kolkata 700064, India
G. Skoro
Laboratory for High Energy (JINR), Dubna, Russia
N. Smirnov
Yale University, New Haven, Connecticut 06520
R. Snellings
NIKHEF, Amsterdam, The Netherlands
G. Sood
Valparaiso University, Valparaiso, Indiana 46383
P. Sorensen
Lawrence Berkeley National Laboratory, Berkeley, California 94720
J. Sowinski
Indiana University, Bloomington, Indiana 47408
J. Speltz
Institut de Recherches Subatomiques, Strasbourg, France
H.M. Spinka
Argonne National Laboratory, Argonne, Illinois 60439
B. Srivastava
Purdue University, West Lafayette, Indiana 47907
A. Stadnik
Laboratory for High Energy (JINR), Dubna, Russia
T.D.S. Stanislaus
Valparaiso University, Valparaiso, Indiana 46383
R. Stock
University of Frankfurt, Frankfurt, Germany
A. Stolpovsky
Wayne State University, Detroit, Michigan 48201
M. Strikhanov
Moscow Engineering Physics Institute, Moscow Russia
B. Stringfellow
Purdue University, West Lafayette, Indiana 47907
A.A.P. Suaide
Universidade de Sao Paulo, Sao Paulo, Brazil
E. Sugarbaker
Ohio State University, Columbus, Ohio 43210
C. Suire
Brookhaven National Laboratory, Upton, New York 11973
M. Sumbera
Nuclear Physics Institute AS CR, 250 68 Řež/Prague, Czech Republic
B. Surrow
Massachusetts Institute of Technology, Cambridge, MA 02139-4307
T.J.M. Symons
Lawrence Berkeley National Laboratory, Berkeley, California 94720
A. Szanto de Toledo
Universidade de Sao Paulo, Sao Paulo, Brazil
P. Szarwas
Warsaw University of Technology, Warsaw, Poland
A. Tai
University of California, Los Angeles, California 90095
J. Takahashi
Universidade de Sao Paulo, Sao Paulo, Brazil
A.H. Tang
NIKHEF, Amsterdam, The Netherlands
T. Tarnowsky
Purdue University, West Lafayette, Indiana 47907
D. Thein
University of California, Los Angeles, California 90095
J.H. Thomas
Lawrence Berkeley National Laboratory, Berkeley, California 94720
S. Timoshenko
Moscow Engineering Physics Institute, Moscow Russia
M. Tokarev
Laboratory for High Energy (JINR), Dubna, Russia
T.A. Trainor
University of Washington, Seattle, Washington 98195
S. Trentalange
University of California, Los Angeles, California 90095
R.E. Tribble
Texas A&M University, College Station, Texas 77843
O. Tsai
University of California, Los Angeles, California 90095
J. Ulery
Purdue University, West Lafayette, Indiana 47907
T. Ullrich
Brookhaven National Laboratory, Upton, New York 11973
D.G. Underwood
Argonne National Laboratory, Argonne, Illinois 60439
A. Urkinbaev
Laboratory for High Energy (JINR), Dubna, Russia
G. Van Buren
Brookhaven National Laboratory, Upton, New York 11973
A.M. Vander Molen
Michigan State University, East Lansing, Michigan 48824
R. Varma
Indian Institute of Technology, Mumbai, India
I.M. Vasilevski
Particle Physics Laboratory (JINR), Dubna, Russia
A.N. Vasiliev
Institute of High Energy Physics, Protvino, Russia
R. Vernet
Institut de Recherches Subatomiques, Strasbourg, France
S.E. Vigdor
Indiana University, Bloomington, Indiana 47408
V.P. Viyogi
Variable Energy Cyclotron Centre, Kolkata 700064, India
S. Vokal
Laboratory for High Energy (JINR), Dubna, Russia
M. Vznuzdaev
Moscow Engineering Physics Institute, Moscow Russia
B. Waggoner
Creighton University, Omaha, Nebraska 68178
F. Wang
Purdue University, West Lafayette, Indiana 47907
G. Wang
Kent State University, Kent, Ohio 44242
G. Wang
California Institute of Technology, Pasedena, California 91125
X.L. Wang
University of Science & Technology of China, Anhui 230027, China
Y. Wang
University of Texas, Austin, Texas 78712
Y. Wang
Tsinghua University, Beijing 100084, China
Z.M. Wang
University of Science & Technology of China, Anhui 230027, China
H. Ward
University of Texas, Austin, Texas 78712
J.W. Watson
Kent State University, Kent, Ohio 44242
J.C. Webb
Indiana University, Bloomington, Indiana 47408
R. Wells
Ohio State University, Columbus, Ohio 43210
G.D. Westfall
Michigan State University, East Lansing, Michigan 48824
A. Wetzler
Lawrence Berkeley National Laboratory, Berkeley, California 94720
C. Whitten Jr
University of California, Los Angeles, California 90095
H. Wieman
Lawrence Berkeley National Laboratory, Berkeley, California 94720
S.W. Wissink
Indiana University, Bloomington, Indiana 47408
R. Witt
Yale University, New Haven, Connecticut 06520
J. Wood
University of California, Los Angeles, California 90095
J. Wu
University of Science & Technology of China, Anhui 230027, China
N. Xu
Lawrence Berkeley National Laboratory, Berkeley, California 94720
Z. Xu
University of Science & Technology of China, Anhui 230027, China
Z. Xu
Brookhaven National Laboratory, Upton, New York 11973
E. Yamamoto
Lawrence Berkeley National Laboratory, Berkeley, California 94720
P. Yepes
Rice University, Houston, Texas 77251
V.I. Yurevich
Laboratory for High Energy (JINR), Dubna, Russia
Y.V. Zanevsky
Laboratory for High Energy (JINR), Dubna, Russia
H. Zhang
Brookhaven National Laboratory, Upton, New York 11973
W.M. Zhang
Kent State University, Kent, Ohio 44242
Z.P. Zhang
University of Science & Technology of China, Anhui 230027, China
P.A Zolnierczuk
Indiana University, Bloomington, Indiana 47408
R. Zoulkarneev
Particle Physics Laboratory (JINR), Dubna, Russia
Y. Zoulkarneeva
Particle Physics Laboratory (JINR), Dubna, Russia
A.N. Zubarev
Laboratory for High Energy (JINR), Dubna, Russia
www.star.bnl.gov
Abstract
We present STAR measurements of charged hadron production as a function of
centrality in Au + Au collisions at GeV.
The measurements cover
a phase space region of GeV/ in transverse momentum
and in pseudorapidity.
Inclusive transverse momentum distributions of charged hadrons in
the pseudorapidity region
are reported and compared
to our previously published results for .
No significant difference is seen for inclusive
distributions of charged hadrons in these
two pseudorapidity bins.
We measured distributions
and truncated mean in a region of , and studied
the results in the framework of participant and binary
scaling.
No clear evidence is observed for participant scaling of charged hadron
yield in the measured region. The relative importance of hard
scattering process is investigated through binary scaling fraction of
particle production.
pacs:
25.75.Dw, 25.75.-q
I Introduction
Quantum Chromodynamics (QCD) is considered to be the underlying theory of
the strong interaction which governs hadron production in nuclear
collisions. The strong interaction is usually divided into soft
processes, which involve small momentum transfer, and hard processes,
which can be calculated using perturbative QCD. The Relativistic Heavy
Ion Collider (RHIC) experiments at the Brookhaven National Laboratory investigate properties and evolution of
matter at high temperature and energy density.
At RHIC energies, the hard processes become more evident in comparison
to previous heavy ion experiments and can be used
to probe the early state of the collision system.
A high energy parton produced via hard scattering
may lose energy in the hot/dense medium through gluon bremsstrahlung
and multiple scatterings before
hadronization quenching1 ; quenching2 ,
leading to a suppression of high hadron production.
The magnitude of the energy loss provides an indirect signature
of QGP formation. Since parton energy loss is directly proportional to
gluon density, the energy loss would be much larger in a partonic medium
than in hadronic matter quenchsignature .
Partonic energy loss can be investigated through comparison of hadron
yield as a function of between nucleus-nucleus collisions and
or collisions. In order to do so, scaling factors
which account for the nuclear geometry, the number of participant
nucleons, , and the number of binary
nucleon-nucleon collisions, , are calculated
from theoretical models.
Experimental results from RHIC, including our earlier analyses in the
pseudorapidity region ,
have indicated a suppression of hadron production for GeV/ in
central Au + Au collisions relative to and
collisions ptsuppression2 ; star200 ; ptsuppression1 .
This is in contrast to the SPS
result from central Pb + Pb collisions at GeV, which shows an excess of production for
GeV/ wa98 ; detail . The RHIC measurements are striking
considering that known nuclear effects, like the Cronin effect cronin
and radial flow na49 , tend to enhance hadron yields at high
. The RHIC results for high hadron suppression agree
qualitatively with calculations based on fragmentation models, which
attribute the high hadron suppression to medium induced parton
energy loss loss .
Another known nuclear effect, nuclear shadowing, also modifies particle
production at high . Calculations of this
effect shadowing1 based on the
EKS98 shadowing parametrization EKS
predicted it to be small in the
and pseudorapidity region covered in this measurement. However, another
study shadowing2
found a much larger shadowing effect for heavy nuclei at
RHIC. Therefore, a measurement of particle production as a function of
and pseudorapidity may provide a constraint on the shadowing effect.
Partonic energy loss may also
be studied by the pseudorapidity dependence
of hadron production.
Change of pseudorapidity due to change of momentum is
(1)
The pseudorapidity distributions would be modified
as a result of the parton energy loss
if the momentum change rate () due to the energy loss is
different along the transverse and longitudinal direction. In
addition, Polleri and Yuan yuan pointed out that the degree of
the energy loss may also depend on the pseudorapidity region in which
a jet is produced because the energy loss is proportional to the
particle density in pseudorapidity. The pseudorapidity dependence of
high hadron production provides a means to probe the initial
density of matter along both the transverse and longitudinal directions.
In this article, we present measurements of hadron production in Au +
Au collisions at GeV as a function of
centrality, and . In Sec. II we will briefly describe
the STAR experimental setup and then give a description of data
analysis techniques that were used to obtain the inclusive transverse
momentum distributions for charged hadrons. We will also discuss the
parameterization of inclusive transverse momentum distributions in
collisions at GeV and
the calculations of and . In Sec. III
results from the data analysis will be reported and compared with
model calculations.
Physics implications of our measurements are discussed in Sec. IV.
And we will then summarize our measurements in Sec. V.
II Analysis
II.1 Experimental Setup and Data
Measurements presented in this article are based on two data sets
of Au + Au collisions at GeV, which were
recorded by the STAR detector at RHIC. A detailed description of the
STAR detector can be found elsewhere star . The two data sets
comprise minimum bias and central collision triggered
events which correspond to approximately the most central 10% of the Au +
Au geometric cross section. Charged particle tracks of an event were
detected in the Time Projection Chamber tpc (TPC) with a
pseudorapidity coverage and complete azimuthal symmetry.
The transverse momentum of a track is determined by fitting a circle
through the transverse coordinates of the primary event vertex and the
space points along the track in the TPC. The total momentum can be
calculated using this radius of curvature in a 0.25 T magnetic field
and the polar angle of the track. The procedure involves a three
dimensional fit using three coordinates of the primary vertex
determined from all of the tracks reconstructed in the TPC. The
primary vertex position along the beam direction, , has a
wide spread with one standard deviation about 100 cm. To increase
detection efficiency of the tracks within , we required the
events to have a primary vertex cm. After the event
selection cuts, the minimum bias data set contained 181k events
and the central data set contained 365k events.
Centrality selection is based on the uncorrected primary charged particle
multiplicity within and
GeV/. The requirement on range maximizes
the number of tracks used to define centrality in an event
while keeping the tracking acceptance approximately
constant.
The percentage of the geometric cross section is determined in the
same way as that published by STAR previously hminus , where the
negatively charged hadron multiplicity distribution within
was used. The data set is divided into seven centrality
bins, and the most central bin is 0–5% (the top 5% of the
multiplicity distribution) while the most peripheral bin is 60–80%.
The analysis in this article covers a transverse momentum region
of GeV/. Accepted
primary tracks have , at least 25 space points in the TPC used in
the track fit out of 45 pad rows,
a fit probability of being a primary track greater than
0.05, and a distance of closest approach to the primary vertex
less than 1 cm. These track quality cuts were varied to estimate the
systematic uncertainty.
Acceptance and efficiency were determined by embedding simulated
tracks into actual Au + Au collision events.
The measured high hadron yield is sensitive to small spatial
distortions of the TPC alignments in both azimuthal and longitudinal
directions. A measurement of the summed hadron yield, ,
is less sensitive to such distortions than the yield of one charge
sign alone. Using 12 sectors from each of the TPC ends as
independent detectors for high hadrons, we estimated the
sectorwise (azimuthal direction) variations of the yields to be less
than 5%. The variation of the yield between the hadrons crossing and
not crossing the
central membrane of the TPC was
found to be approximately proportional to with a value of 11% at
GeV/. The typical correction factors for the acceptance
and efficiency are given in Table 1 as
“Tracking”. The systematic uncertainties incorporate acceptance,
efficiency, track quality cuts, and the effects of the spatial
nonuniformity.
The tracking and other correction factors and their systematic
uncertainties given in Table 1 for differ
from those given in our previous paper ptsuppression2 because different
track quality cuts and other correction procedures were used.
Finite momentum resolution tends to spread particles to neighboring bins in a
momentum histogram, especially for an exponentially falling spectrum.
This smearing effect cannot be
neglected at higher where
the momentum resolution is limited by the strength of the magnetic
field and the TPC spatial resolution. We used
the embedding technique to determine the resolution.
For GeV/ within the Gaussian distribution
of track curvature has a relative width of
(GeV/) for central events and
(GeV/) for
peripheral events.
Within ,
(GeV/) for central events and
(GeV/) for
peripheral events.
The fact that the resolution for is better than that
for is due to the competition between two opposing effects.
For a given track in the TPC, the
hadron with higher tends to have fewer space points, hence
poorer resolution, but shorter
drift distance, hence better
resolution.
The magnitude of the resolution determined from the
embedding technique did not include the effect of the
primary vertex resolution.
The effects of the
smearing due to the primary vertex resolution,
to the charge-sign-dependent distortion,
and to the weak decay background tracks, have been empirically derived from
the comparison between real and embedded tracks.
The combined effect within was
found to be larger than that within . This
is partially due to the fact that the magnitude of the
charge-sign-dependent distortion in the higher region is larger.
The two contributions have been convoluted into a power law function
to fit the data, and then the ratio of the fitted function to its
convoluted one
gives the smearing correction factor YC .
Because the two contributions have opposite dependence,
the overall smearing correction factors for the two regions
happen to be comparable.
The typical smearing correction factors and their systematic
uncertainties are also given in Table 1.
II.2 Background
The most significant backgrounds for the high charged hadron yield
as seen in Table 1
come from particle weak decays and antinucleon annihilation in
detector material.
The contamination rate for each background source was
estimated using detector response simulations with events
generated by the HIJING model hijing .
However, the dependence of production of weakly decaying particles,
primarily , , , and of antinucleons,
, , in HIJING is not consistent with experimental
measurements. We corrected those predicted yields using the measured
spectra of phenixpbar ; starpbar , and
starlambda , and starkshort , together
with those of phenixpbar ; hminus , for
GeV/ in the mid-rapidity region in the most central bin. The corrections
used in calculating the background fractions are shown in the upper
panel of Fig. 1. The curves are polynomial fits to the
data points and are used in the interpolation due to different
binning. For GeV/ we simply assumed the yield ratios
to be constant. Systematic
uncertainties of 50% and 100% of the overall background fraction are
assigned for the regions of GeV/ and GeV/,
respectively YC .
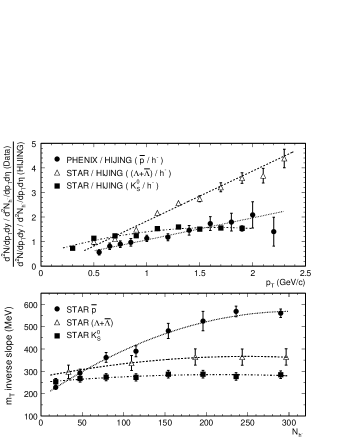
Figure 1:
Measurements used in background studies.
Upper panel: ratios of the measured yield
ratios to those of HIJING in the most central bin. Lower panel: measured
inverse slope parameters as functions of centrality
represented by measured negatively charged hadron multiplicity
within .
Curves are polynomial fits to data points.
The contamination rate for all background sources shows almost no
centrality dependence from the Monte Carlo HIJING events. Therefore,
centrality dependence of the background fraction is mainly determined
by the measured spectra in various centrality bins.
In the lower panel of Fig. 1
we show the measured transverse mass ()
inverse slope parameters of exponential fits to
starpbar ,
and
starlambda , and starkshort
spectra in the mid-rapidity region as functions of the measured
negatively charged hadron multiplicity within
. We use these to correct for different centrality binning
in our analysis. The polynomial fits are used to interpolate the
inverse slope parameters in the centrality bins used in this analysis.
Pseudorapidity dependence of the background fraction
is studied using the Monte Carlo HIJING events. For
GeV/ the -dependence of backgrounds is negligible within
while for GeV/ the background fraction decreases
with and . For example, at GeV/
the background fraction predicted within is only 40%
of that within . The typical background correction factors
and their systematic uncertainties are given in Table 1.
The total systematic uncertainties of
the measured spectra within () at the highest bin
GeV/ are () for central events
and () for peripheral events.
Table 1: Typical multiplicative correction factors and systematic
uncertainties, applied to the yields for peripheral and central
collisions within and within .
Pseudorapidity
GeV/
GeV/
Centrality
60–80%
0–5%
60–80%
0–5%
Tracking
Smearing
Background
Tracking
Smearing
Background
II.3 Reference
In the absence of any collision data at GeV, a
reference spectrum is obtained by extrapolation of the UA1
data for GeV ua1 .
The UA1 inclusive charged particle spectra within
were fitted by the pQCD inspired power law
function
(2)
The fit parameters were used to extrapolate to our energy, giving
mb/(GeV/)2 (
denotes the inelastic cross section of collisions),
GeV/, and at
GeV ptsuppression2 .
The superscripts and subscripts are curves that bound the systematic
uncertainty.
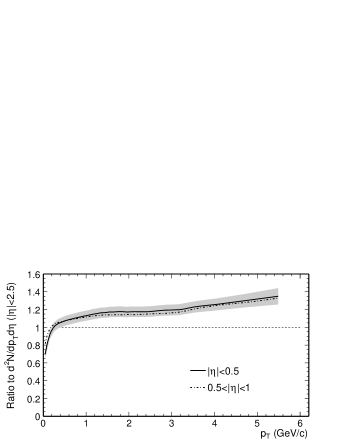
Figure 2: acceptance correction function from
model calculations: ratios of spectra in two different
regions to that within , in which the UA1 Collaboration
published its inclusive charged particle spectra.
However, the UA1 acceptance is different from STAR’s.
Corrections were made to the UA1 reference for our acceptance based on
two independent pQCD calculations: PYTHIA pythia and
Vitev vitev .
When the factor in PYTHIA is set to 1.5, PYTHIA calculations for 200 GeV
collisions
are in reasonable agreement
with the UA1 measurement of the inclusive charged particle
spectrum ua1
and with the UA5 measurement of the pseudorapidity density
distribution ua5 . Similar PYTHIA calculations
are in reasonable agreement
with the STAR measurement of the inclusive charged
hadron spectrum within for collisions at
GeV star200 .
Fig. 2 shows the -dependent correction functions for
two regions at GeV,
obtained by averaging over the two pQCD calculations.
The solid curve is the ratio of within
to that within , and the shaded area shows its
systematic uncertainty. The dot-dashed curve shows the same ratio for
, and the similar magnitude of the uncertainty
on the ratio of to
is not shown. Multiplicative corrections of and at GeV/ have been obtained for
and for , respectively.
The difference between and is quite small,
indicating a relatively flat distribution within
for a broad region.
The STAR measurement star200 is consistent with the UA1 data for 200 GeV
after applying a similar acceptance correction.
We derived in the reference at GeV
of mb by requiring ,
which was obtained by integrating the extrapolated spectrum after applying
the acceptance correction, to be
2.25, which was determined from the energy dependence
of cdfeta .
II.4 Participant and Binary Collision Determination
The number of participant nucleons, , and the number of
binary nucleon-nucleon collisions, , in a nucleus-nucleus
collision are used to compare experimental results with model
predictions. Unfortunately, at RHIC and cannot
be measured directly and have to be obtained in a model-dependent
way. Considerable discrepancy exists among various model calculations,
especially for peripheral collisions sa .
We first investigate and obtained from a Monte
Carlo (MC) Glauber model calculation ptsuppression2 ; starpi .
In the Monte Carlo Glauber model, each of the nucleons in a nucleus A is
randomly distributed using a
Woods-Saxon nuclear density distribution
(3)
with normalization to and parameters:
nuclear radius and surface diffuseness .
All nucleons in either nucleus for a nucleus-nucleus collision are
required to be separated by a minimum distance.
The calculated or
distribution was divided into bins corresponding to common
fractions of the total geometric cross section to extract the average
or for each centrality bin. The systematic
uncertainties on and were estimated by varying the
Woods-Saxon parameters, by varying the value, and by
including a 5% uncertainty in the determination of the total geometric
cross section.
Table 2: Comparisons of nuclear geometries implemented in various
models for 130 GeV Au + Au collisions.
Model
HIJING 1.35
VENUS 4.12
MC Glauber
Woods-Saxon
fm
fm
fm
Parameters
fm
fm
fm
Minimum Distance
of Two Nucleons
0.4 fm
0.8 fm
0.4 fm
Nucleon-Nucleon
Overlap Function
Maximum Impact
Parameter
25.6 fm
24.1 fm
no restriction
Nucleon-Nucleon
Cross Section
38.7 mb
37.4 mb
mb
Total Geometric
Cross Section
7.27 b
7.34 b
b
We also investigate calculations of and using two
dynamic models, HIJING hijing and VENUS venus .
We compare these calculations with results from the Monte Carlo
Glauber model calculation to shed light on
the model dependent uncertainties of and .
The VENUS model is based on the Gribov-Regge theory and string
fragmentation.
The HIJING generator is an example of a two-component
model:
the momentum transfer of the soft process is treated
phenomenologically and the hard processes are calculated by
pQCD. The excited nucleons after
collisions are stretched out as quark-diquark strings
and fragment based on the Lund fragmentation
scheme lund . The parton energy loss in dense medium (quenching)
and nuclear modification
of parton structure functions (shadowing) are also modeled in HIJING.
Both dynamic models describe nuclear
collision geometry using
the Woods-Saxon nuclear density distribution and the eikonal formalism
to determine the probability for each binary nucleon-nucleon
collision, and to compute and .
Table 2 shows the
comparisons of the nuclear geometries implemented in HIJING,
VENUS, and the Monte Carlo Glauber model for Au + Au collisions at
GeV.
The overlap
function, which defines the probability for a nucleon-nucleon collision
at a given impact parameter , has the form of
in HIJING
with defined in Table 2
( and ) while it is a step
function, ,
in VENUS and MC Glauber.
The correspondence
between the centrality classes defined
by measured charged particle multiplicity
and those defined by modeled impact parameter was used to extract
the average and from these dynamic models for a
given centrality bin.
Variations of average and for different centrality
selections were estimated
using the Monte Carlo
events from the HIJING model.
The event classes corresponding to the same fractional cross section
were selected by cuts on
, , , and .
The average and by different cuts in HIJING
are consistent within 2% for each centrality bin except
the 60–80% most peripheral bin, where the discrepancy is at a
level of 6%.
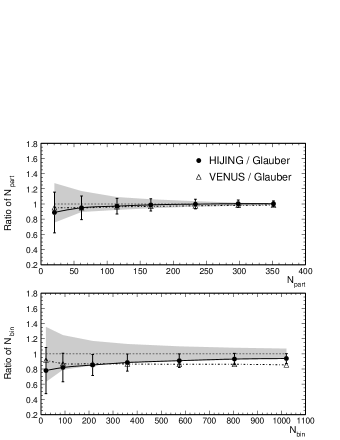
Figure 3: Ratio of the number of participants
(upper panel) or the number of binary collisions
(lower panel)
determined from different models to that from a Monte Carlo Glauber
calculation. Shaded areas
show the uncertainties of or from
the Monte Carlo Glauber calculation.
Curves are to guide the eye.
The results of and from the models are shown in
Fig. 3 as their ratios to or
from the Monte Carlo Glauber calculation.
The participant scaling exponents , which are
defined in the expression of
,
were obtained by fit to be , , and
for HIJING, VENUS, and MC Glauber.
The scaling exponents for these models are
approximately due to the fact that
and .
It is worthwhile to note here that distribution differences among
HIJING and VENUS are mainly due to different overlap functions.
The and distributions
from them are nearly identical
if the same overlap functions are used in these two model calculations.
Fig. 3 shows that over a broad range of centrality the
model dependent uncertainties of and are within 10% and
20%, respectively.
III Results
Inclusive distributions of within have been published
previously ptsuppression2 . The independent analysis reported in this
article shows that the differences to the published results for all
measured points are within 10%,
which is comparable to the systematic uncertainties for GeV/ and
is less than the systematic uncertainties for the high region.
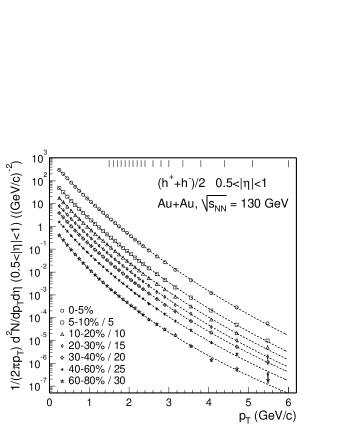
Fig. 4 shows inclusive distributions of within for various centrality bins.
The error bars are the quadrature sum of statistical error and systematic
uncertainty, and are dominated by the latter except for the highest
point in the peripheral bins. The curves in Fig. 4 are
power law function (Eq. 2) fits to the spectra.
Figure 4: Inclusive distributions of within . Noncentral bins are scaled down by the
indicated factors. The combined statistical and systematic errors are
shown. Curves are fits to the power law function. Hash marks at the
top indicate bin boundaries for GeV/.
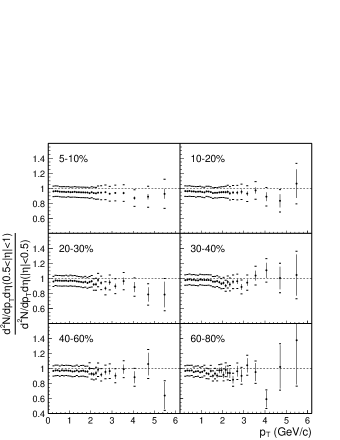
Fig. 5 shows ratios of distributions within
to those within in various centrality bins.
Note that Fig. 5 and the succeeding figures
utilize the distributions
within obtained here. Using identical cuts and correction
procedures across the full pseudorapidity region minimizes the systematic
uncertainties in the relative comparisons.
The error bars in Fig. 5 show
statistical errors only while the caps are the quadrature sum of
statistical errors and systematic uncertainties
which cannot be canceled out. Remaining systematic uncertainty
includes the variation due to track quality cuts, the uncertainties of
the
smearing corrections for the two regions, and the partial uncertainty
of background subtraction related to the -dependent part discussed
in Sec. II.
Figure 5: Ratios of distributions within
to those within in various centrality
bins. Error bars show statistical errors while caps are the quadrature sum of
statistical errors and remaining systematic uncertainties.
Fig. 6 shows the same ratio of to
in the 0–5% most central bin. The points are our
measurements and the error bars include statistical and remaining
systematic uncertainties. The solid curve is the same ratio from
PYTHIA calculations pythia for 130 GeV collisions.
Other curves are ratios from HIJING
predictions of 130 GeV Au + Au collisions
without shadowing and without quenching (dotted curve), with shadowing
and without quenching (dashed curve), and with shadowing
and with partonic energy loss being 2.0 GeV/fm (dot-dashed curve).
The results show that the effects on the pseudorapidity dependence of both
nuclear shadowing and partonic energy loss
as implemented in HIJING are too small to be tested in the measured
kinematic region under current experimental uncertainties.
Figure 6: Ratio of distribution within
to that within in the 0–5% most central
bin. Points are measurements and error bars include statistical and
remaining systematic uncertainties. Curves are described in the text.
No significant differences are observed in the comparisons of the inclusive
charged hadron yields between the two regions in
Fig. 5 and Fig. 6
over a broad range of centrality for
all measured points. It suggests that an approximate boost
invariant condition might be established in the early stage of
collisions.
The suppression pattern of the particle yield has little
dependence in the measured region though the particle yield itself is
sensitive to partonic energy loss.
A measurement of this ratio between
and from the BRAHMS Collaboration shows that the ratio
is below unity
at GeV/ brams .
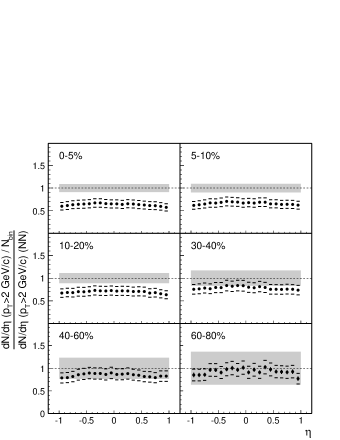
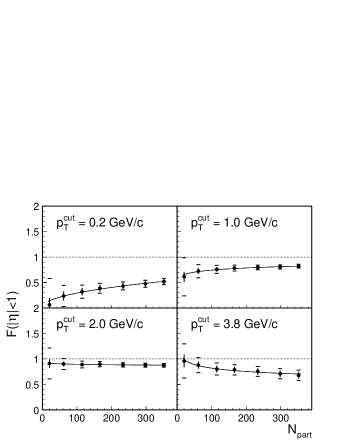
Figure 7: distributions for GeV/
and scaled by and divided by the reference.
Fig. 7 shows distributions for GeV/ and
in various centrality bins. The error bars show
statistical uncertainties while the caps are the quadrature sum of
statistical and systematic uncertainties. The systematic uncertainties
are dominant and highly correlated. The distributions are scaled by
and divided by the reference. Due to nearly
complete -independence of the reference data
for GeV/ within
as shown in
Fig. 2 and Fig. 6, constant
of the reference are used in Fig. 7.
Therefore, the shapes of the distributions for the Au + Au
collisions are preserved.
The uncertainties on both and the reference data are shown
in the shaded regions around the lines at unity which represent the binary
collision scaling. Ratios below unity in the figure show that the high
hadrons over 2 GeV/ are suppressed with respect to those in
collisions.
The shape of for the high hadrons is nearly flat.
No significant centrality dependence of the shapes within
is observed.
Similar behaviors are observed for GeV/
except larger
suppressions in the central bins. For example, in the 0–5%
most central bin, the average ratio is for
GeV/
while it is for GeV/.
IV Discussion
The charged hadron yield per participant pair
at GeV shows a slow increase as a function of
phob ; firstphenix ; ptsuppression2 . Such
slow increase of hadron multiplicity as a function of centrality at
RHIC has been considered by Kharzeev et al. satur2 in
the framework of parton saturation. They argued that the hadron
multiplicity as a function of centrality would increase faster if produced jets
lose energy radiating soft gluons that in turn fragment into hadrons
at mid-rapidity. As a result of the parton saturation,
it is predicted that hadron multiplicity should scale with
at a moderately high (up to 6–8 GeV/ at RHIC energies).
An explanation of the slower than expected increase in fragmentation
models is that the
effective energy loss is significantly reduced in a thermal
environment due to detailed balance detail .
Recent experimental results in
+ Au collisions at GeV support the idea
that the suppression of high hadron production in Au + Au collisions
at mid-rapidity is due to final state interactions
rather than parton saturation in the initial state brams ; dau .
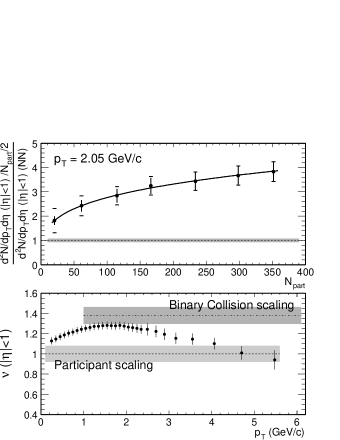
Figure 8:
Upper panel: ratio of charged hadron yields
within
for Au + Au relative to the
reference, scaled by as a function of centrality
for a bin at GeV/.
The curve is fit to .
Lower panel:
participant scaling exponent
of charged hadron yields as a function of within .
In the upper panel of Fig. 8, we plot charged hadron
yield per participant pair within normalized to
that of nucleon-nucleon collisions as a function of for
GeV/c.
The error bars are the
uncertainties of data while the caps are the quadrature sum of
the uncertainties of both data and .
The shaded regions around unity show systematic uncertainties of the
reference data.
The result shows that the ratio is above unity and increases with .
Dependence of the charged hadron yield on can be studied by fitting the yield by the following function
(4)
in different bins. Such an example is
shown as a curve in the upper panel of Fig. 8 for
GeV/.
The fit parameter, , is given in the lower panel of Fig. 8
as a function of . The error bars are
the uncertainties of the fit parameters associated with
the uncertainties of data.
The lines and shaded regions are
binary collision () and participant
() scaling exponents and uncertainties to
. No clear evidence of participant scaling over the whole
measured region is observed. The approximate participant scaling
of the hadron yield at high
observed by PHOBOS phobos appears to be accidental.
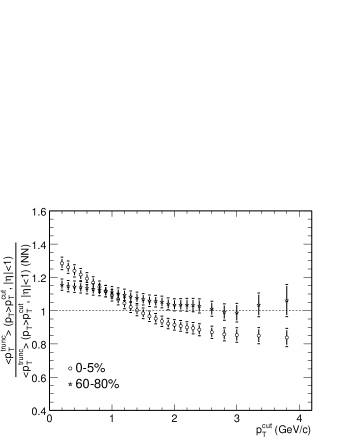
Figure 9:
Ratio of truncated mean in
within
as a function of for central and peripheral collisions.
In a scenario with continuous energy loss of particles through a
medium, the energy loss would lead to a shift in the mean of
these particles. If the energy loss contributes to additional particle
production in the low region, the mean of low
particles would also be modified.
The truncated mean , defined as
(5)
is used to study the variation of mean as a function of
scale with respect to reference data. Fig. 9
shows the truncated mean ratios between Au + Au and
collisions as a function of for central (0–5%) and
peripheral (60–80%) collisions. The errors are combined statistical and
systematic uncertainties while the caps are the quadrature sum of the
uncertainties of both the Au + Au data and the reference data.
In peripheral collisions at high (
GeV/) the truncated mean of particles is approximately the
same as for collisions above the same
(Fig. 9). The ratio in the low region is above
unity indicating the effects of the Cronin effect and/or radial flow
in peripheral collisions. For central collisions, the truncated mean
for GeV/ is approximately 15% lower
than the truncated mean from collisions at the same
, consistent with the scenario for partonic energy loss
in this region. The significantly larger ratio in the
low region probably reflects the combined effects of larger radial
flow, the Cronin effect, and shift of particles due to
energy loss,
which cannot be decoupled with the present data.
Figure 10:
Binary scaling fraction in
within
as a function of centrality for selected .
For GeV/,
the fraction decreases with centrality.
Fig. 8 (bottom panel) indicates that over a broad
region particle production falls between participant and
binary scalings. In two-component particle production models, the
binary scaling has been associated with hard parton scatterings and
the participant scaling with the soft processes. In our study we
empirically decompose the particle yield into and
scaling components, i.e.
(6)
where and are the hadron
multiplicity and the fraction of particle yield attributable to hard
processes in collisions, respectively. Fig. 10
shows the binary scaling fraction in Au + Au collisions, defined as
(7)
Note that does not depend on
since both numerator and denominator of Eq. 7 contain
. There is a distinguishable trend as a function
of from GeV/ to lower .
This trend is consistent with the dependence
in Fig. 8.
It is worth noting that % in central Au + Au collisions
at GeV/. However, one should exercise
caution when relating this fraction to hard parton scattering
processes, particularly at lower where high particles
may suffer large energy losses in the medium and become soft.
V Conclusion
We have presented inclusive distributions of from STAR at
RHIC in the region and compared them to distributions
for , finding no significant differences in the region of
GeV/. We find that the distributions for
are nearly flat for all centralities. The charged hadron
yield as a function of shows no clear participant scaling in
the measured region. The binary scaling fraction in the
two-component model shows a decrease with centrality for
GeV/ and is about 70% at GeV/
for central collisions.
Acknowledgements.
We thank the RHIC Operations Group and RCF at BNL, and the
NERSC Center at LBNL for their support. This work was supported
in part by the HENP Divisions of the Office of Science of the U.S.
DOE; the U.S. NSF; the BMBF of Germany; IN2P3, RA, RPL, and
EMN of France; EPSRC of the United Kingdom; FAPESP of Brazil;
the Russian Ministry of Science and Technology; the Ministry of
Education and the NNSFC of China; SFOM of the Czech Republic,
FOM and UU of the Netherlands,
DAE, DST, and CSIR of the Government of India; the Swiss NSF.
References
(1) M. Gyulassy and M. Plümer, Phys. Lett. B
, 432 (1990);
R. Baier et al., Phys. Lett. B , 277 (1995).
(2) X.N. Wang and M. Gyulassy,
Phys. Rev. Lett. , 1480 (1992);
X.N. Wang, Phys. Rev. C , 2321 (1998).
(3) R. Baier, D. Schiff, and B.G. Zakharov,
Annu. Rev. Nucl. Part. S. , 37 (2000);
E. Wang and X.N. Wang, Phys. Rev. Lett. , 162301 (2002).
(4) C. Adler et al., STAR Collaboration,
Phys. Rev. Lett. , 202301 (2002).
(5) J. Adams et al., STAR Collaboration,
Phys. Rev. Lett. , 172302 (2003).
(6) K. Adcox et al., PHENIX Collaboration,
Phys. Rev. Lett. , 022301 (2002); S.S. Adler et al.,
PHENIX Collaboration, Phys. Rev. Lett. , 072301 (2003).
(7) M.M. Aggarwal et al., WA98 Collaboration,
Phys. Rev. Lett. , 4087 (1998);
Erratum, , 578 (2000).
(8) E. Wang and X.N. Wang, Phys. Rev. Lett. ,
142301 (2001).
(9) J.W. Cronin et al., Phys. Rev. D ,
3105 (1975).
(10) G. Roland, for the NA49 Collaboration,
Nucl. Phys. , 91c (1998).
(11) X.N. Wang, Phys. Rev. C , 64910 (2000);
P. Levai et al., Nucl. Phys. , 631c (2002).
(12) S.R. Klein and R. Vogt, Phys. Rev. C ,
047901 (2003).
(13) K.J. Eskola, V.J. Kolhinen, and P.V. Ruuskanen,
Nucl. Phys. , 351 (1998);
K.J. Eskola, V.J. Kolhinen, and C.A. Salgado, Eur. Phys. J. ,
61 (1999).
(14) S.Y. Li and X.N. Wang, Phys. Lett. B ,
85 (2002).
(15) A. Polleri and F. Yuan, nucl-th/0108056; F. Yuan,
private communication, 2002.
(16) K.H. Ackermann et al., STAR Collaboration,
Nucl. Instrum. Meth. A , 624 (2003).
(17) K.H. Ackermann et al., STAR Collaboration,
Nucl. Phys. , 681c (1999);
M. Anderson et al.,
Nucl. Instrum. Meth. A , 659 (2003).
(18) C. Adler et al., STAR Collaboration,
Phys. Rev. Lett. , 112303 (2001).
(19) Y. Chen, Ph.D. dissertation, University
of California, Los Angeles, 2003.
(20) M. Gyulassy and X.N. Wang,
Comput. Phys. Commun. , 307 (1994).
(21) K. Adcox et al., PHENIX Collaboration,
Phys. Rev. Lett. , 242301 (2002).
(22) C. Adler et al., STAR Collaboration,
Phys. Rev. Lett. , 262302 (2001).
(23) C. Adler et al., STAR Collaboration,
Phys. Rev. Lett. , 092301 (2002).
(24) C. Adler et al., STAR Collaboration,
nucl-ex/0206008.
(25) C. Albajar et al., UA1 Collaboration,
Nucl. Phys. , 261 (1990).
(26) T. Sjöstand et al.,
Comput. Phys. Commun. , 238 (2001).
(27) I. Vitev, private communication, 2002;
I. Vitev, Phys. Lett. B , 36 (2003).
(28) G.J. Alner et al., UA5 Collaboration,
Z. Phys. C , 1 (1986).
(29) F. Abe et al., CDF Collaboration,
Phys. Rev. D , 2330 (1990).
(30) B.H. Sa et al., Phys. Lett. B , 268
(2002).
(31) J. Adams et al., STAR Collaboration, nucl-ex/0311017.
(32) K. Werner, Phys. Rep. , 87 (1993).
(33) B. Andersson et al., Phys. Rep. , 31 (1983).
(34) I. Arsene et al., BRAHMS Collaboration,
Phys. Rev. Lett. , 072305 (2003).
(35) B.B. Back et al., PHOBOS Collaboration,
Phys. Rev. C , 061901R (2002).
(36) K. Adcox et al., PHENIX Collaboration,
Phys. Rev. Lett. , 3500 (2001).
(37) D. Kharzeev, E. Levin, and L. McLerran,
Phys. Lett. B , 93 (2003.)
(38) J. Adams et al., STAR Collaboration,
Phys. Rev. Lett. , 072304 (2003); S.S. Adler et al.,
PHENIX Collaboration, Phys. Rev. Lett. , 072303 (2003);
B.B. Back et al., PHOBOS Collaboration,
Phys. Rev. Lett. , 072302 (2003).
(39) B.B. Back et al., PHOBOS Collaboration,
Phys. Lett. B , 297 (2004).