The PHENIX measurement of Heavy Flavor via Single Electrons in pp, d-Au and Au-Au collisions at
Abstract
The PHENIX experiment at RHIC has measured single electron spectra in proton-proton, deuteron-gold and gold-gold collisions at . The photonic contribution (photon conversions and Dalitz decays) is subtracted from the inclusive spectra resulting in non-photonic single electron spectra. The principal source of non-photonic electrons is the semi-leptonic decay of charm and bottom mesons. The implications for heavy flavor production in hot and cold nuclear systems are discussed.
1 Introduction
Heavy flavor production in nuclear systems has utility as a probe of both cold nuclear matter effects and of more exotic effects associated with the hot partonic state formed in the aftermath of high energy nucleus-nucleus collisions. Differences in the relative yield of heavy flavor in and collision probes nuclear modifications of the gluon distribution function and energy loss in a cold nuclear medium. Strong suppression of high hadrons of light quark flavor at moderate to high transverse momentum has been observed at RHIC [1]. Medium induced gluon radiation, which is considered as the main cause of the high suppression, may be reduced for heavy quarks [2] [3].
2 Data Analysis and Results
PHENIX measures non-photonic electron spectra by first measuring the inclusive electron spectra and then subracting the contribution from photonic sources. The principal contributors to the photonic electrons are Dalitz decays of and mesons and photon conversions, and the dominant contributor to the non-photonic electrons is heavy quark decay. Other non-photonics contributors that enter at the percent level are light vector meson di-electron decay and . The inclusive electron spectra are measured with a combination of detectors in the PHENIX central arm spectrometers ( in pseudorapidity) which is described in detail elsewhere [4]. The momentum of charged tracks is reconstructed using drift and pad chambers. Electron identification is accomplished through a combination of an associated signal in a ring imaging Cerenkov detector (RICH) and an cut that employs an electomagnetic calorimeter (EMCAL) for the energy measurement.
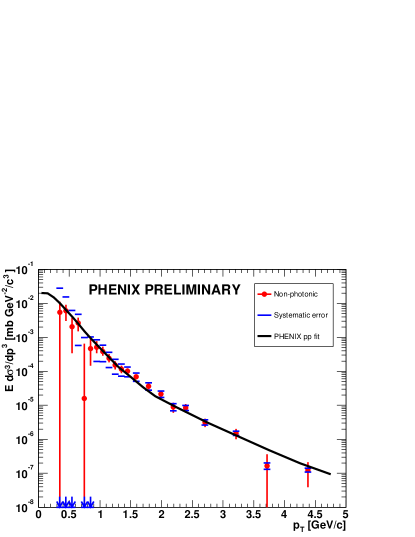
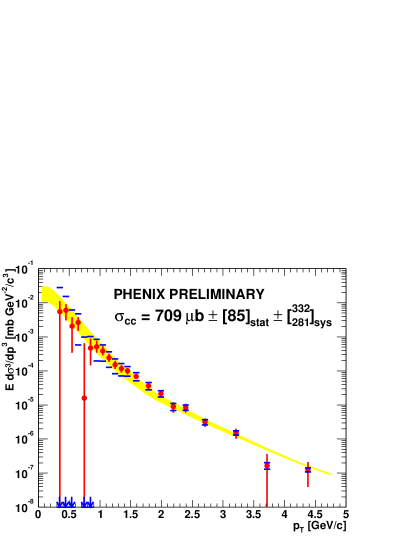
The dataset used for the proton-proton analysis consisted of 15M min-bias triggers and 420M sampled min-bias triggers associated with a level 1 trigger that required a coincidence between the EMCAL and RICH (ERT). The data have been corrected for acceptance and reconstruction efficiency, and the photonic background has been subtracted using a cocktail method that is described in detail elsewhere [5]. Fig. 1 shows the spectrum of non-photonic electrons from collisions. A fit to the data is shown as the solid line. The right panel shows the total charm cross section determined by allowing PYTHIA lineshapes for electrons from charm and bottom meson decay to assume normalizations that best fit the data. The systematic error was calculated by offseting the data by the systematic errors and repeating the fit proceedure. The total charm cross section derived using this extrapolation technique is .
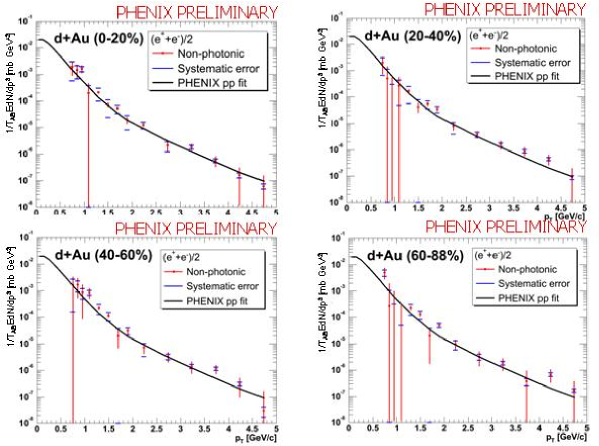
The method by which electrons from photonic sources were subtracted in the analysis of the data from Run 3 at RHIC was the so-called converter subtraction method. During a fraction of the running period a photon converter of known mass was inserted close to the interaction point. By measuring the electron yield with and without the converter it is possible to infer the fraction of measured electrons from photonic sources. The preliminary analysis of the data used a converter run sample that consisted of 5M min-bias events and the equivalent of 312M min-bias events sampled by the ERT trigger. The non-converter dataset included 5M min-bias and 600M trigger sampled min-bias events. Fig. 2 shows the non-photonic single electron spectra from deuteron-gold collisions at in four centrality classes scaled down by the nuclear thickness. The solid line is the best fit to data.
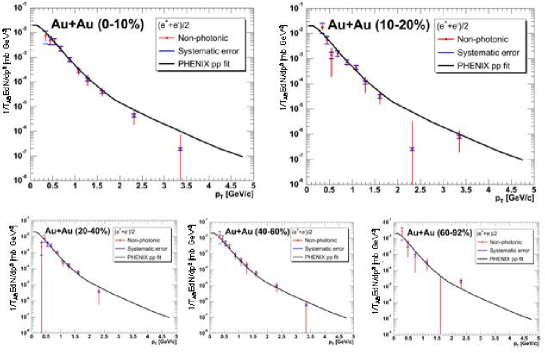
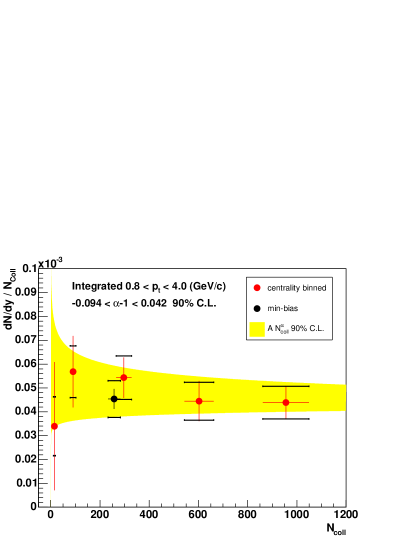
The analysis of collision data for single electrons also employed the converter subtraction method. These data consist of 2.2M min-bias and 2.5M min-bias events for the converter and non-converter runs respectively. Fig. 3 shows the non-photonic single electron spectra in five centrality bins with the best fit to the data overlayed. The extent to which the single electron yield in collision is consistent with a binary scaling hypothesis is shown in Fig. 4.
3 Conclusion
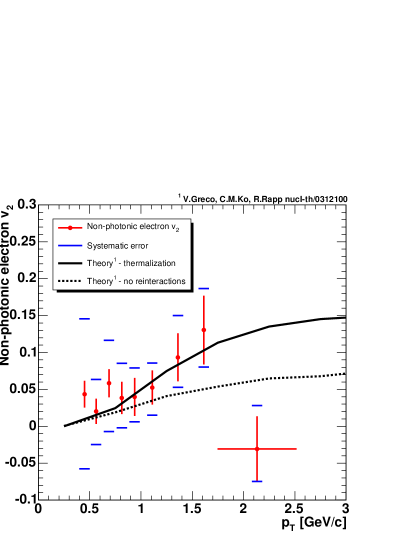
Within errors, the non-photonic single electron spectra are in good agreement with the spectra in all centrality classes. This is indicative of no strong modification to the initial state gluon distribution function in the range relevant to heavy quark production at central rapidity . The integrated in collisions is consistent with a binary scaling hypothesis, indicating no strong charm enhancement or suppression in heavy ion collisions. No conclusion can be drawn with regards to a modification of the spectra shapes in collision, as to whether it follows pQCD, exhibits significant charm quark energy loss, or follows hydrodynamic flow. Measuring of charm was proposed [6] as a potential way to disambiguate these very different dynamical scenarios. Figure 4 shows the preliminary measurment of non-photonic single electron flow in collision. The current run at RHIC will provide the necessary statistics to investigate both heavy quark energy loss and non-photonic electron flow.
References
- [1] S. S. Adler et al.,Phys. Rev. Lett. 91, 072301 (2003).
- [2] M. Djordjevic, M. Gyulassy Nucl.Phys.A733, 265-298 (2004).
- [3] Y.L. Dokshitzer and D.E. Kharzeev, Phys. Lett.B519, 199 (2001).
- [4] H. Hamagaki et al. (PHENIX Collaboration), Nucl. Phys.A698, 412 (2002).
- [5] K. Adcox et al. Phys. Rev. Lett. 88,192303 (2002).
- [6] S. Batsouli, S. Kelly, M. Gyulassy, J.L. Nagle, Phys.Lett. B557 26-32 (2003)