Event-by-Event Fluctuations at 40, 80, and 158 AGeV/c in Pb+Au Collisions
Abstract
Event-by-event fluctuations of mean and net charge in 40, 80, and 158 AGeV/c Pb+Au collisions are presented. The observed dynamical mean fluctuations in central events of about 1 % are very similar to results from RHIC. The centrality dependence of mean fluctuations at 158 AGeV/c shows a peculiar non-monotonic pattern with respect to the extrapolation from the fluctuations measured in p+p collisions. Dynamical net charge fluctuations smaller than the charge conservation limit are observed. After correction for charge conservation, the measured fluctuation signal in central events is comparable to RHIC results.
5pt
1 Introduction
Event-by-event fluctuations of mean have been proposed as a possible probe to search for the phase transition, especially the QCD critical point via their non-monotonic variation with control parameters such as beam energy and centrality [1]. On the other hand, the fluctuations can be used to evaluate the extent of thermal equilibrium by comparison with the extrapolated fluctuations from nucleon-nucleon collisions. Suppressed net charge fluctuations have been proposed as a possible signal for the formation of a QGP, due to the smaller charge units of deconfined (anti-) quarks compared to those of confined hadrons [2, 3]. Comparisons with cascade models may clarify whether the observed fluctuations are described by resonance gas models.
A detailed description of CERES experiment at the CERN-SPS can be found elsewhere [4, 5]. For the present analysis, momenta of charged particle tracks produced in Pb+Au collisions at 40, 80, and 158 AGeV/c have been measured with a cylindrical Time Projection Chamber. The data set comprises a wide range of collision centrality. The acceptance of the TPC is around mid-rapidity () and covers in azimuth (at 40 AGeV/c only , see also [5]).
2 Mean Fluctuations
Two measures are used to evaluate mean fluctuations. The measures the dynamical fluctuation normalized with mean [5]. This measure is proportional to mean covariance of all charged particle pairs per event [6]. Another measure [8] is defined as a deviation from 1 of the ratio of the r.m.s. of the event-by-event mean distribution in real events to that in mixed events. The is approximately proportional to , where is the mean charged particle multiplicity in the acceptance. In Fig. 2, has a saturation tendency at the pseudo-rapidity interval () more than 0.4, whereas steadily increases. We therefore use to compare CERES results () with RHIC results ().
Fig. 2 shows as a function of nucleon-nucleon center of mass energy () at and GeV/c in 6.5 % central events, compared to RHIC data at GeV [9, 10], and GeV [8]. For comparison to RHIC data, the CERES data are not corrected for short range momentum correlations. The observed fluctuations at SPS and at RHIC are similarly about 1 %. No indication for non-monotonic variation or enhanced fluctuations is observed. Note that a predicted fluctuation at the critical point is % [1], far above the measured values.
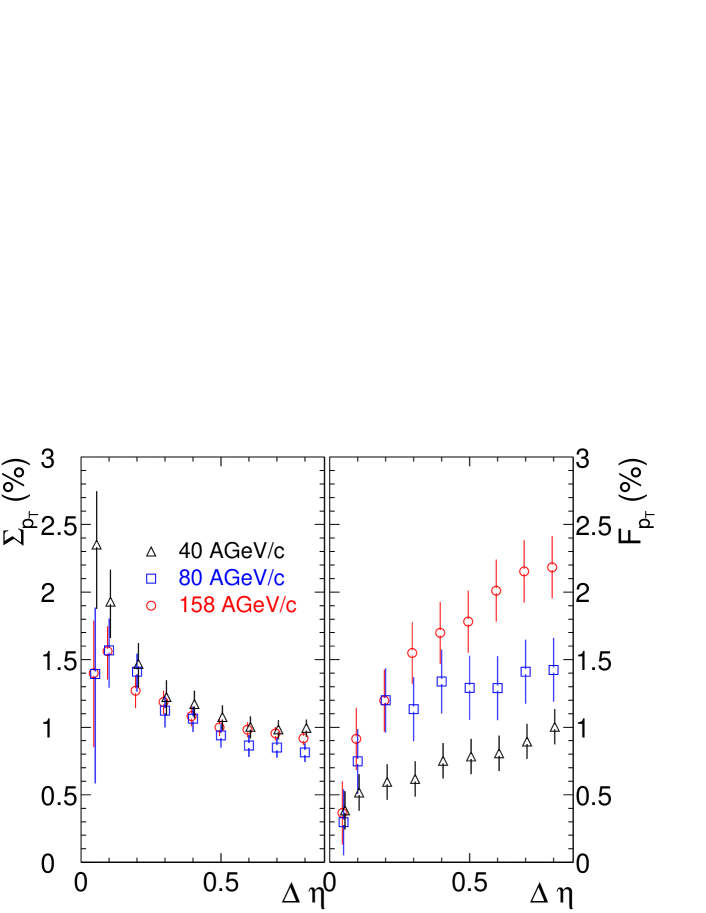
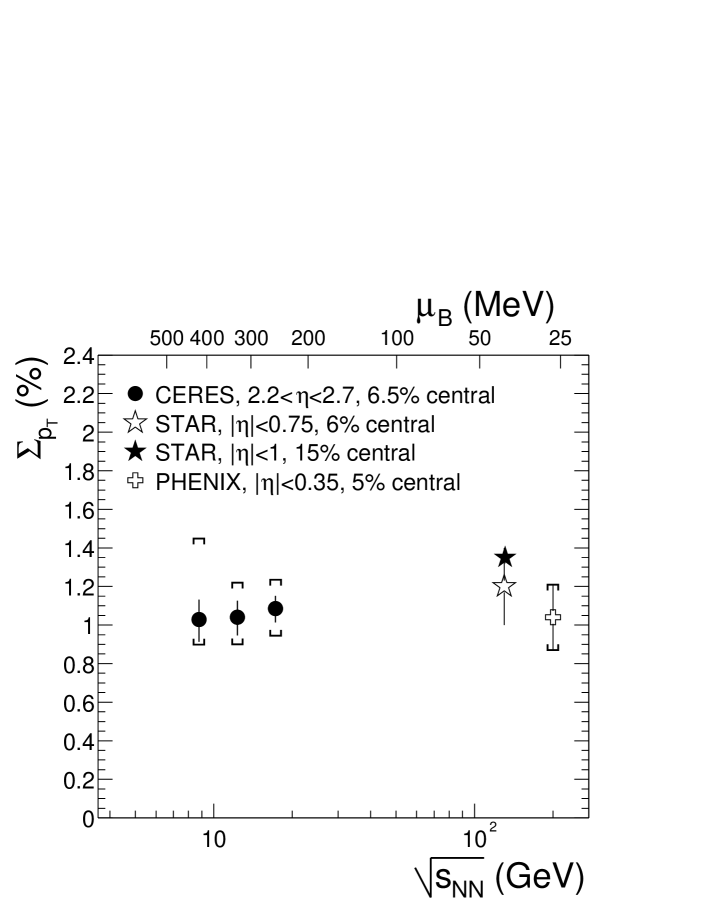
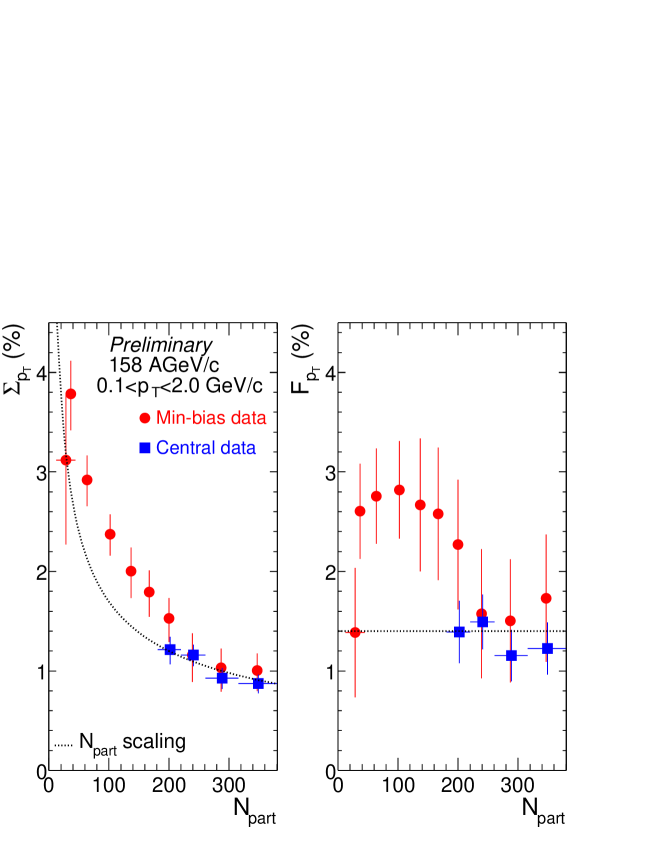
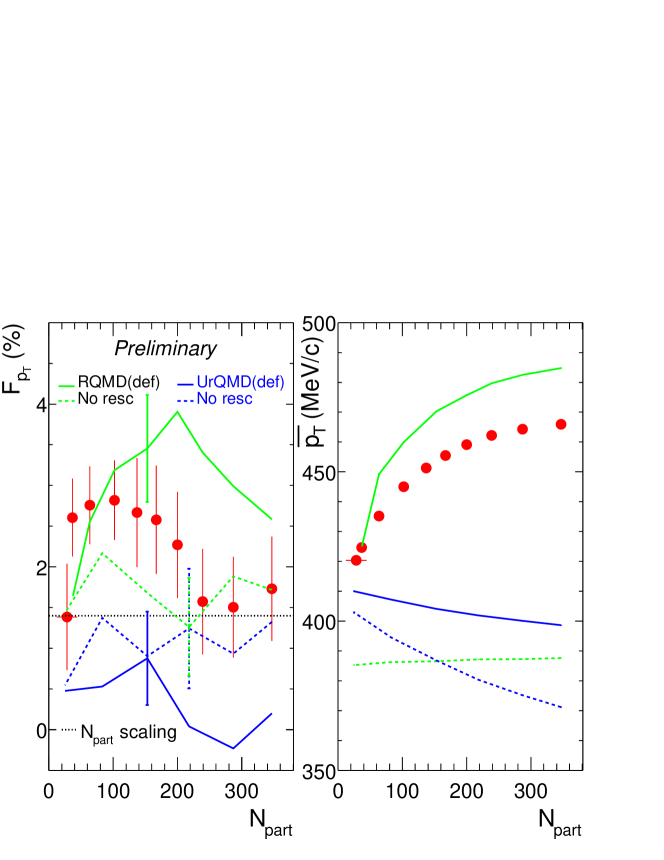
Fig. 4 shows fluctuations corrected for short range momentum correlations at 158 AGeV/c as a function of the number of participants (). The fluctuations between the minimum-bias data set and the central data set are consistent. As a baseline (dashed lines) reflecting the superposition of individual nucleon-nucleon collisions, we employ the formula , where the 12 % is a measured fluctuation in p+p collisions at ISR [7], which corresponds to in the CERES acceptance. Significant deviations from the baseline are observed in semi-central events, whereas in peripheral events (centrality ) and in central events (centrality ), the fluctuations are consistent with the baseline. The maximum of is about 2.8 % at of , corresponding to central events. The observed centrality dependence as well as the increase of with the upper cut is similar to the observations by NA49 [11], PHENIX [8], and STAR [10].
In Fig. 4, of RQMD and UrQMD without rescattering is consistent with the baseline as expected. With rescattering, RQMD reproduces qualitatively both the non-monotonic dependence of fluctuations and the increasing tendency of mean , while UrQMD fails to describe both observables.
3 Net charge fluctuations
As a measure of net charge fluctuations, we use , representing dynamical fluctuations of the difference between normalized multiplicity of positive particles and that of negative particles [12]. The measure is advantageous since the correction for the global charge conservation is additive, and no efficiency correction is necessary.
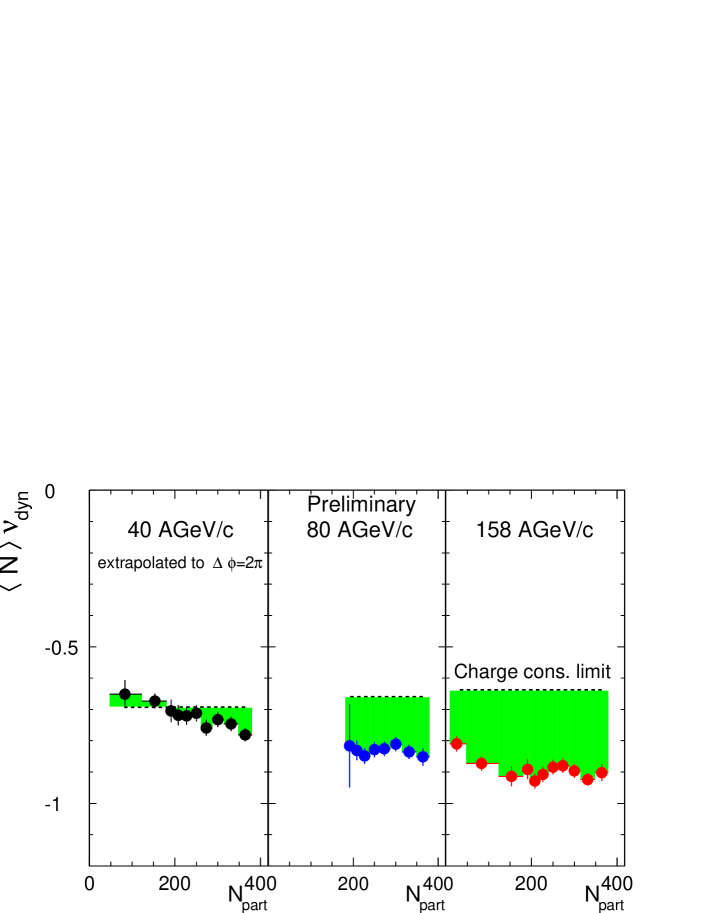
Fig. 6 shows multiplied with mean charged particle multiplicity within the acceptance () as a function of at the three beam energies. The dashed lines show the charge conservation limit, defined as , where is the total charged particle multiplicity which is assumed to scale with . The is estimated based on the NA49 measurements [13]. The observed fluctuations are lower than the charge conservation limit. Since the fluctuations are much above the QGP model predictions of [2, 3], no indication for the formation of a deconfined phase is found. Decreasing tendencies of with are observed at the three beam energies. Whether this is due to a deviation of the charge conservation limit from the multiplicity scaling, or due to a real deviation of the fluctuations from the multiplicity scaling, is under investigation.
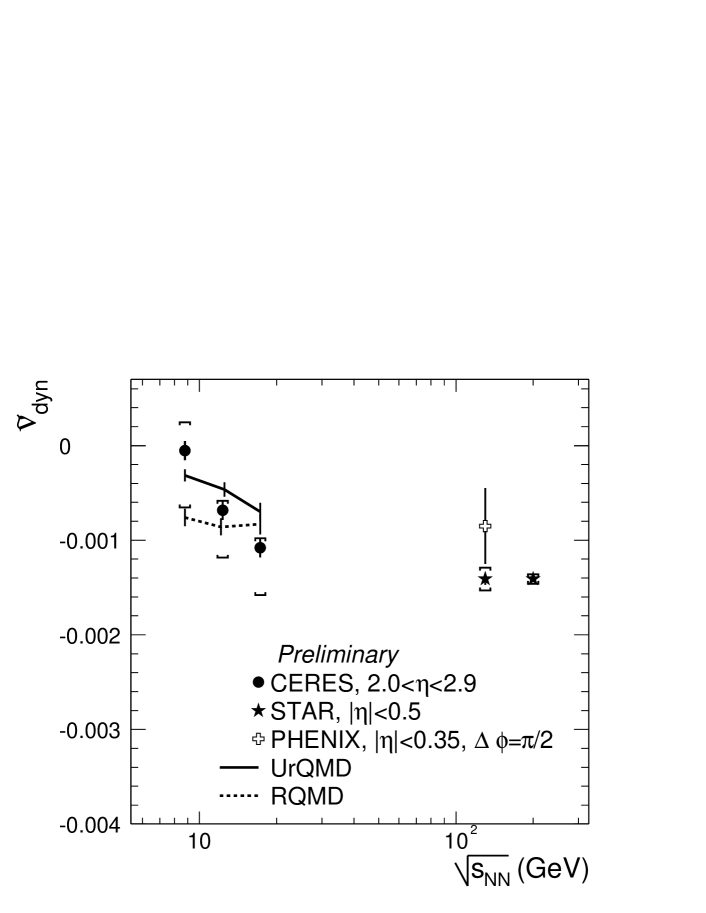
Fig. 6 shows, as a function of , a compilation of CERES, STAR [14, 15], and PHENIX results [16] for corrected for charge conservation (). A decrease of is observed at SPS energies, while a decrease is tiny from SPS top energy to RHIC energies. Both RQMD and UrQMD are in reasonable agreement with the CERES data.
4 Conclusions
Dynamical mean fluctuations of % in central events are observed, which are similar to the fluctuations measured at RHIC. The shows non-monotonic centrality dependence with a maximum of % in semi-central events, which is about a factor of 2 enhanced over the p+p extrapolation. A similar tendency is observed also by NA49, PHENIX, and STAR. RQMD qualitatively reproduces both enhancement of fluctuations in semi-central events and increase of mean as a function of centrality.
The observed dynamical net charge fluctuations are smaller than the charge conservation limit. The slightly decreases from peripheral to central events. The decreases at SPS energies but varies little from the SPS top energy to RHIC energies. UrQMD and RQMD reproduce the observed fluctuations at SPS.
References
References
- [1] Stephanov M A, Rajagopal K and Shuryak E V 1999 Phys. Rev.D 60 114028
- [2] Asakawa M, Heinz U and Mueller B 2000 Phys. Rev. Lett.85 2072
- [3] Jeon S and Koch V 2000 Phys. Rev. Lett.85 2076 Bleicher M, Jeon S and Koch V 2000 Phys. Rev.C 62 061902
- [4] CERES Collaboration, Adamová D et al2003 Nucl. Phys.A 714 124
- [5] CERES Collaboration, Adamová D et al2003 Nucl. Phys.A 727 97
- [6] Voloshin S, Koch V, and Ritter H 1999 Phys. Rev.C 60 024901
- [7] Braune K et al1983 Phys. Lett.B 123 467
- [8] PHENIX Collaboration, Adler S et al2003 nucl-ex/0310005
- [9] STAR Collaboration, Voloshin S et al2001 nucl-ex/0109006
- [10] STAR Collaboration, Adams J et al2003 nucl-ex/0308033
- [11] NA49 Collaboration, Anticic T et al2003 hep-ph/0311009
- [12] Pruneau C et al2002 Phys. Rev.C 66 044904
- [13] NA49 Collaboration, 2002 Phys. Rev.C 66 054902
- [14] STAR Collaboration, Adams J et al2003 Phys. Rev.C 68 044905
- [15] Pruneau C et al2003 nucl-ex/0304021
- [16] PHENIX Collaboration, Adcox K et al2002 Phys. Rev. Lett.89 082301