Azimuthal anisotropy: the higher harmonics
Abstract
We report the first observations of the fourth harmonic () in the azimuthal distribution of particles at RHIC. The measurement was done taking advantage of the large elliptic flow generated at RHIC. The integrated is about a factor of 10 smaller than . For the sixth () and eighth () harmonics upper limits on the magnitudes are reported.
Anisotropic flow, an anisotropy of the particle azimuthal distribution in momentum space with respect to the reaction plane, is a sensitive tool in the quest for the quark-gluon plasma and the understanding of bulk properties of the system created in ultrarelativistic nuclear collisions. It is commonly studied by measuring the Fourier harmonics () of this distribution [1]. Elliptic flow, , is well studied at RHIC and is thought to reflect conditions from the early time of the collision. Recently, Kolb [2] reported that the magnitude and even the sign of are more sensitive than to initial conditions in the hydrodynamic calculations. Besides one early measurement at the AGS [3], reports of higher harmonics have not previously been published. Some of the present work has already appeared [4].
Experiment— The data come from the reaction Au + Au at GeV. The STAR detector main time projection chamber (TPC) was used in the analysis of two million events. The main TPC covered pseudorapidity () from –1.2 to 1.2 and the low transverse momentum () cutoff was 0.15 . In the present work all charged particles were analyzed, regardless of their particle type. The errors presented in the figures are statistical.
Analysis— The difficulty is that the signal is small and the non-flow contribution to the two-particle azimuthal correlations can be larger than the correlations due to flow. To suppress the non-flow effects the current analysis uses the knowledge about the reaction plane derived from the large elliptic flow. One method for eliminating the non-flow contribution in a case when the reaction plane is known was proposed in [1]. Results obtained with this method we designate by . The analysis for was also done with three-particle cumulants [5] by measuring .
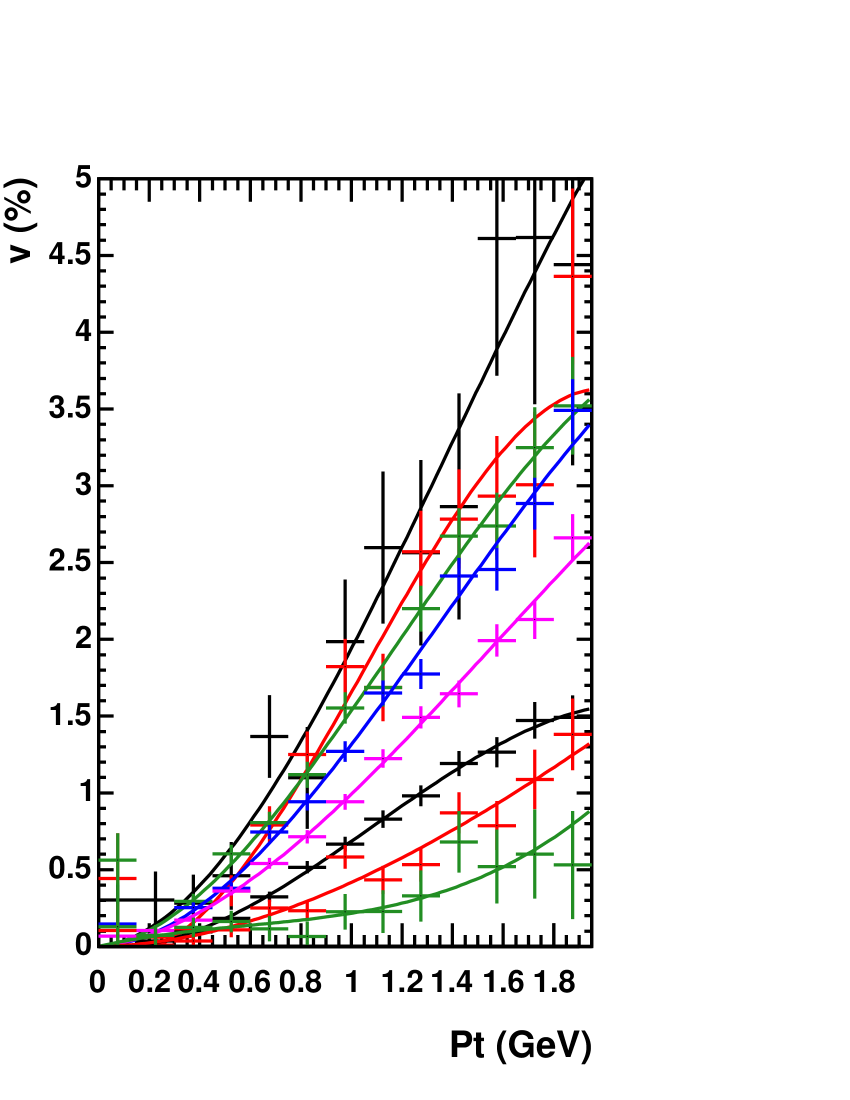
-dependence— The results as a function of are shown in Fig. 1 (left) for minimum bias collisions (% centrality). Shown for are both the analysis relative to the second harmonic event plane, , and the three-particle cumulant, . Both methods determine the sign of to be positive. As a function of , rises more slowly from the origin than , but does flatten out at high like . The values are consistent with zero. Ollitrault has proposed [6] for the higher harmonics that might be proportional to if the distribution is a smooth, slowly varying function of . In order to test the applicability of this scaling we have also plotted and in the figure as dashed lines. The proportionality constant has been taken to be in order to fit the data. The ratio, , is shown in Fig. 1 (right) as a function of .

Parton coalescence— Assuming a simple parton coalescence model, for mesons one gets [7]
| (1) |
Since experimentally this ratio is 1.2, must be greater than zero. If one assumes that the hadronic scaling results from partonic scaling [8], then
| (2) |
and
| (3) |
But this is still less than 1.2. Therefore either is even greater than simple parton scaling would indicate, or the simple parton coalescence model is inadequate.
Waist— Kolb [2] points out that for , which occurs at high , and no other harmonics, the azimuthal distribution is not elliptic, but becomes “peanut” shaped. He calculates the amount of (which looks like a four-leaf clover) needed to eliminate this waist. Our values of as a function of are about a factor of two larger than needed to just eliminate the waist.
Centrality-dependence— The values of for eight centrality bins are shown in Fig. 2 (left). Integrating these values weighted with the yield gives Fig. 2 (right) which shows the centrality dependence of , , and with respect to the second harmonic event plane and also from three-particle cumulants (). The values are close to zero for all centralities. To again test the applicability of scaling we have also plotted and in the figure as dotted histograms. The proportionality constant has been taken to be to approximately fit the data. The larger constant here compared to that used in Fig. 1 is understood as coming from the use of the square of the average instead of the average of the square, and because the integrated values weighted by yield emphasize low , where the best factor is slightly larger.
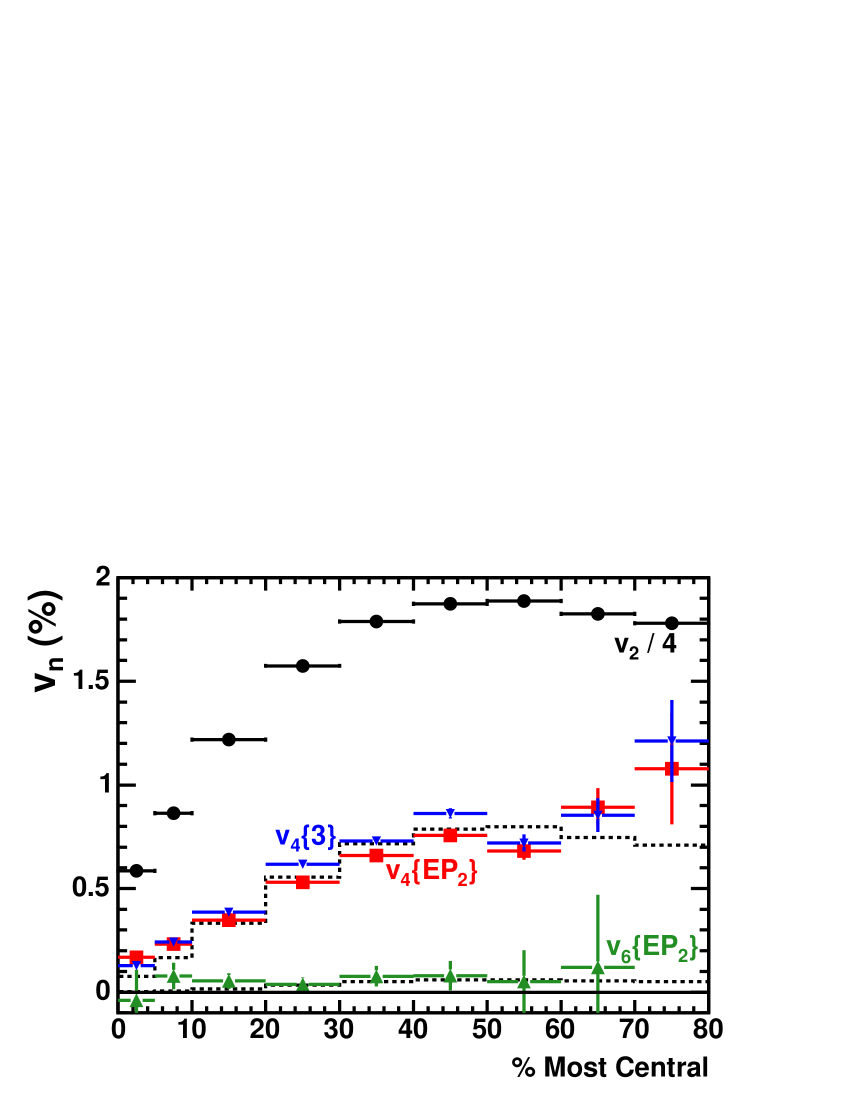
The values averaged over and (), and also centrality (minimum bias, ), are (in percent) , , , and . Since is essentially zero, we place a two sigma upper limit on of 0.1%. Also, is zero, but the error is larger because the sensitivity decreases as the harmonic order increases.
Blast Wave fits— We have fitted the data with a modified Blast Wave model [9]:
| (4) |
| (5) |
where and are modified Bessel functions, and and . In these equations, is the transverse expansion rapidity () of the cylindrical shell. The parameters and are the harmonic amplitudes of the azimuthal variation of , and and describe the spatial anisotropy of the source.
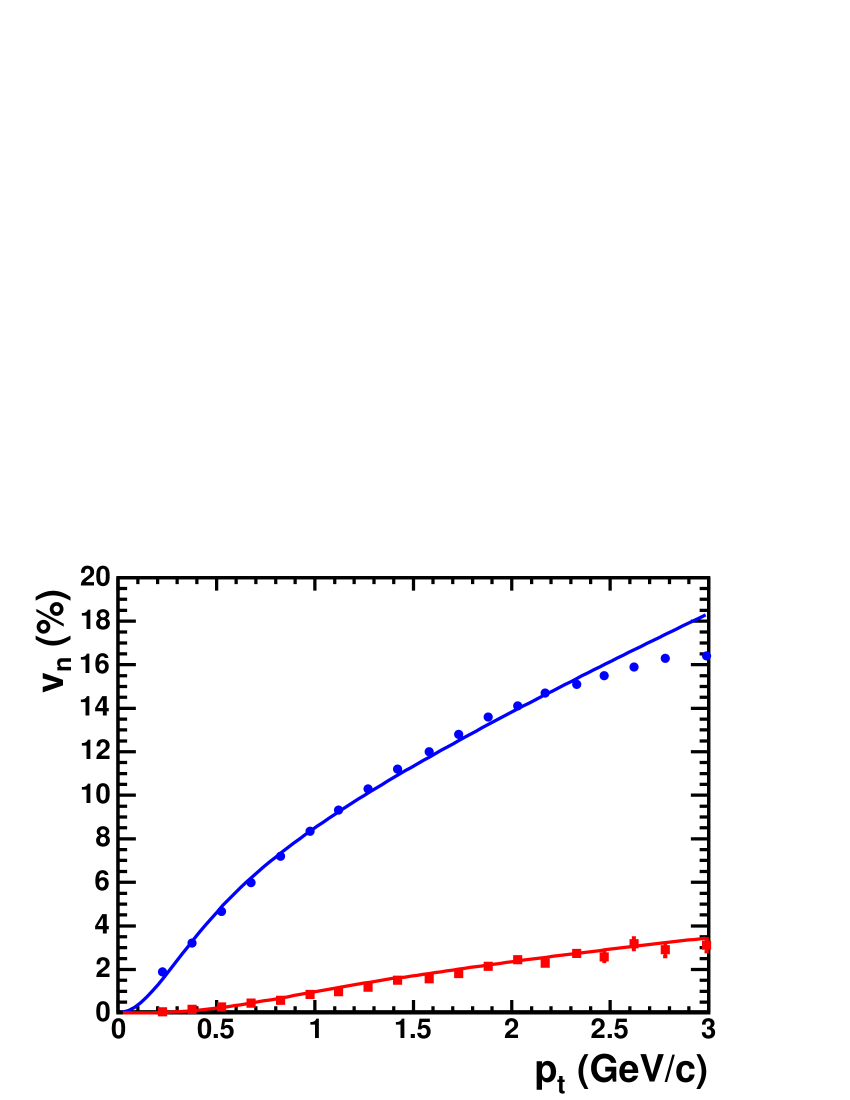
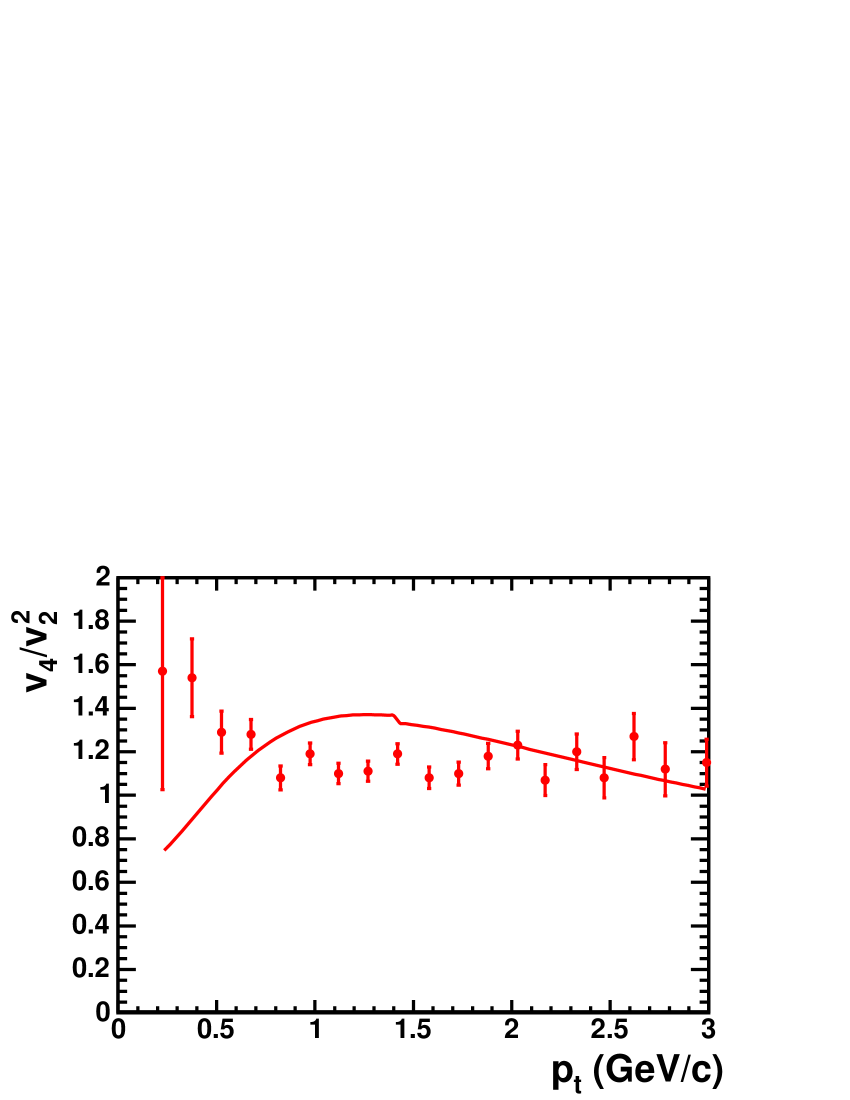
The Blast Wave fits to and are shown in Fig. 3 (left) and expanded in Fig. 3 (right), showing the approximate agreement with the ratio. A temperature of 0.1 GeV was assumed giving the fit parameters , , , , and . It is interesting that in this large range the values are considerably larger than the values.
Conclusions— We have measured as a function of , and centrality. This is the first measurement of higher harmonics at RHIC. It is expected that these higher harmonics will be a sensitive test of the initial configuration of the system, since they provide a Fourier analysis of the shape in momentum space which can be related back to the initial shape in configuration space.
References
References
- [1] Poskanzer A M and Voloshin S A 1998 Phys. Rev.C 58 1671
- [2] Kolb P F 2003 Phys. Rev.C 68 031902(R)
- [3] Barrette J et alE877 Collaboration 1994 Phys. Rev. Lett. 73 2532
- [4] Adams J et alSTAR Collaboration 2004 Phys. Rev. Lett. 92 062301
- [5] Borghini N, Dinh P M, and Ollitrault J-Y 2001 Phys. Rev.C 64 054901
- [6] Ollitrault J-Y 2003 private communication
- [7] Kolb P F, Chen L-W, Greco V, and Ko C M 2004 arXiv nucl-th/0402049
- [8] Chen L-W, Ko C M, and Lin Z-W 2003 arXiv nucl-th/0312124
- [9] Adler C et alSTAR Collaboration 2001 Phys. Rev. Lett. 87 182301