Study of the transverse mass spectra of strange particles in Pb-Pb collisions at 158 GeV/
Abstract
The NA57 experiment has collected high statistics, high purity samples of and , and hyperons produced in Pb-Pb collisions at 158 GeV/. In this paper we present a study of the transverse mass spectra of these particles for a sample of events corresponding to the most central 53% of the inelastic Pb-Pb cross-section. We analyse the transverse mass distributions in the framework of the blast-wave model for the full sample and, for the first time at the SPS, as a function of the event centrality.
pacs:
12.38.Mh, 25.75.Nq, 25.75.Ld, 25.75.Dw1 Introduction
The study of ultrarelativistic heavy-ion collisions is motivated mainly by the quantum chromodynamics (QCD) prediction that at sufficiently high energy density the excited nuclear matter undergoes a phase transition into a system of deconfined quarks and gluons (quark-gluon plasma, QGP) [1].
Strange particles have proved
over the past years to be a powerful tool for the study of reaction dynamics
in high-energy heavy-ion collisions.
The WA97 experiment has measured [2]
an enhanced production of particles carrying one, two or three units
of strangeness in central Pb-Pb collisions at 158 GeV/ with respect to proton
induced reactions (strangeness enhancement). The observed pattern of the
enhancements as a function of strangeness was predicted more than 20 years ago
to be a consequence of a QGP formation [3].
NA57 is a dedicated experiment at the CERN SPS for the study of the production of strange and multi-strange particles in Pb-Pb collisions [4]. It continues and extends the study initiated by its predecessor WA97, by (i) enlarging the triggered fraction of the inelastic cross-section thus extending the centrality range towards less central collisions and (ii) collecting data also at lower (40 GeV/) beam momentum in order to study the energy dependence of the strangeness enhancements.
In this paper we concentrate on the analysis of the transverse mass () spectra for , , hyperons, their antiparticles and measured in Pb-Pb collisions at 158 GeV/.
The spectra are expected to be sensitive to the details of the production dynamics [5, 6]. In particular, for a fireball in local thermal equilibrium, the shapes of the spectra depend both on the thermal motion of the particles and on the collective flow driven by the pressure. To disentangle the two contributions, namely thermal motion and transverse flow, one has to rely on models. Several freeze-out scenarios have been proposed (for an overview refer to [7]). They differ in the freeze-out geometry and in the flow velocity profile. In the present analysis we consider the blast-wave model [5, 6], which assumes cylindrical symmetry for an expanding fireball in local thermal equilibrium, with different hypotheses on the transverse flow profile.
The paper is organized as follows. The NA57 apparatus is briefly described in section 2. Section 3 deals with the measurements of the transverse mass spectra. Inverse slope parameters are presented and discussed in section 4. The blast-wave model is introduced in section 5 and compared to data under different conditions. Finally, conclusions are drawn in section 6.
2 The NA57 experiment
The , , hyperons, their antiparticles and the mesons are identified by reconstructing their weak decays into final states containing only charged particles:
| (1) |
and the corresponding charge conjugates for antihyperons.
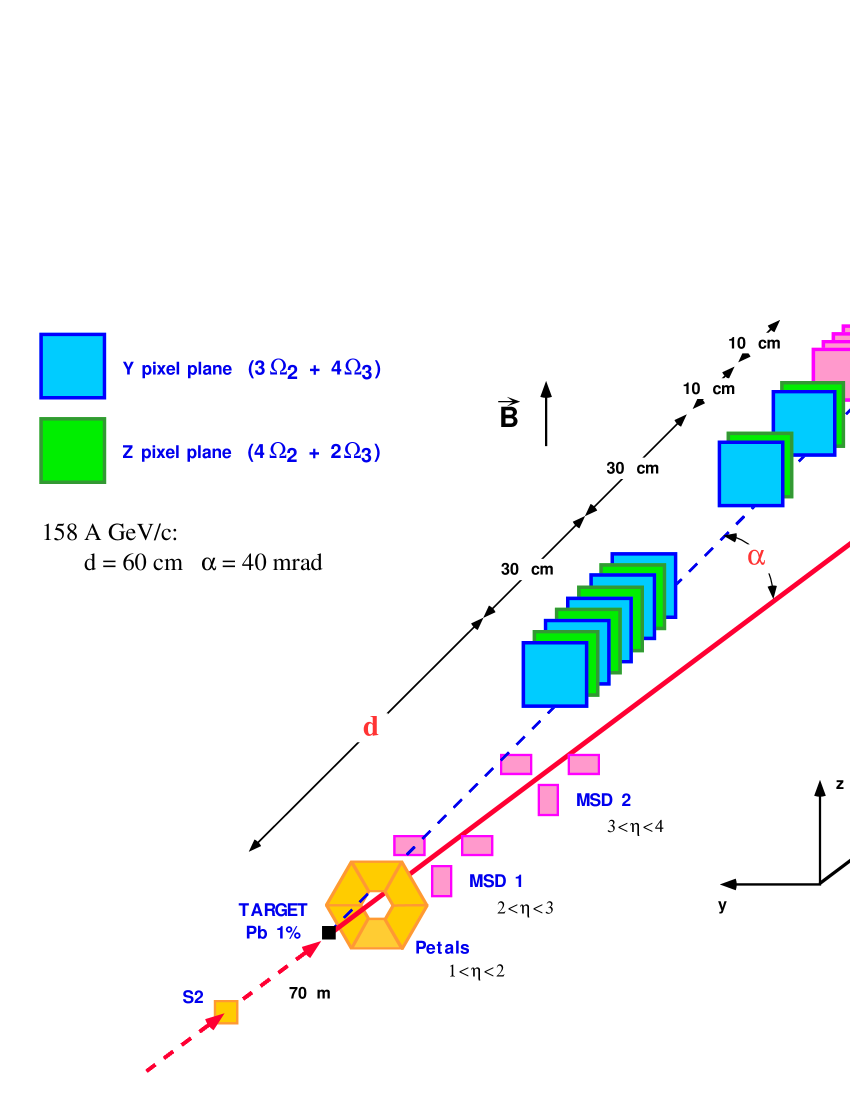
Tracks are measured in the silicon tracking
telescope, an array of pixel detector planes with
cross-section, with a total length
of about 30 cm. To improve the momentum resolution of high momentum tracks a
lever arm detector — an array of additional pixel planes and
double-sided silicon microstrip detectors —
is placed downstream of the tracking telescope.
The whole silicon telescope is placed in a 1.4 Tesla magnetic field,
above the beam line, inclined and aligned
with the lower edge of the detectors laying on a line pointing back to the target.
The inclination angle with respect to the beam line
and the distance of the first pixel plane from the target are
set
to accept particles produced in about half a unit of rapidity
around central rapidity and medium transverse momentum:
mrad and cm.
An array of scintillation counters (Petals), placed 10 cm downstream of the target, provides a fast signal to trigger on the centrality of the collisions. The triggered fraction of the Pb-Pb inelastic cross-section is about 60%. The centrality of the Pb-Pb collisions is determined (off-line) by analyzing the charged particle multiplicity measured by two stations of silicon strip detectors (MSD) which sample the pseudorapidity intervals and .
3 Data analysis
The results presented in this paper are based on the analysis of the full data
sample consisting of 460 M events of Pb-Pb collisions.
The strange particle signals are extracted using geometric and kinematic
constraints, with a method similar to that used in the WA97
experiment [9]. As an example of the quality of the
NA57 data, the invariant mass spectra for , , and
after all analysis cuts are shown in figure 2.
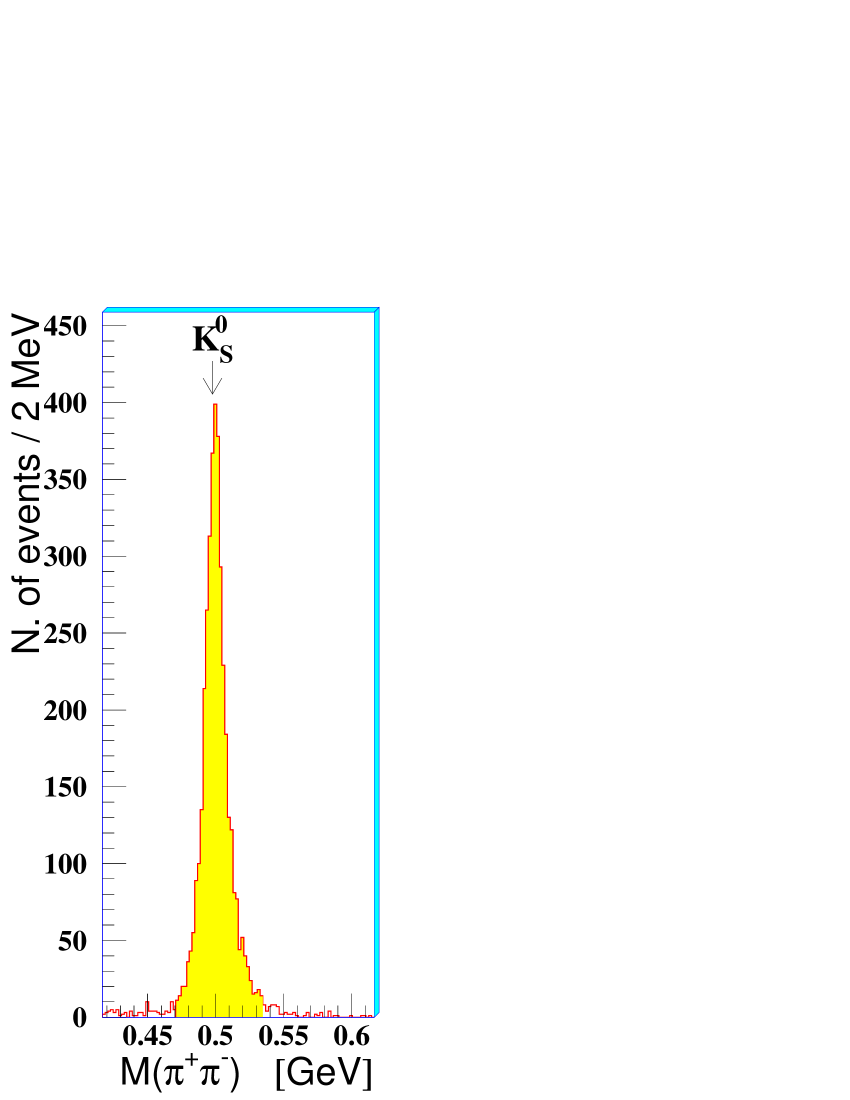
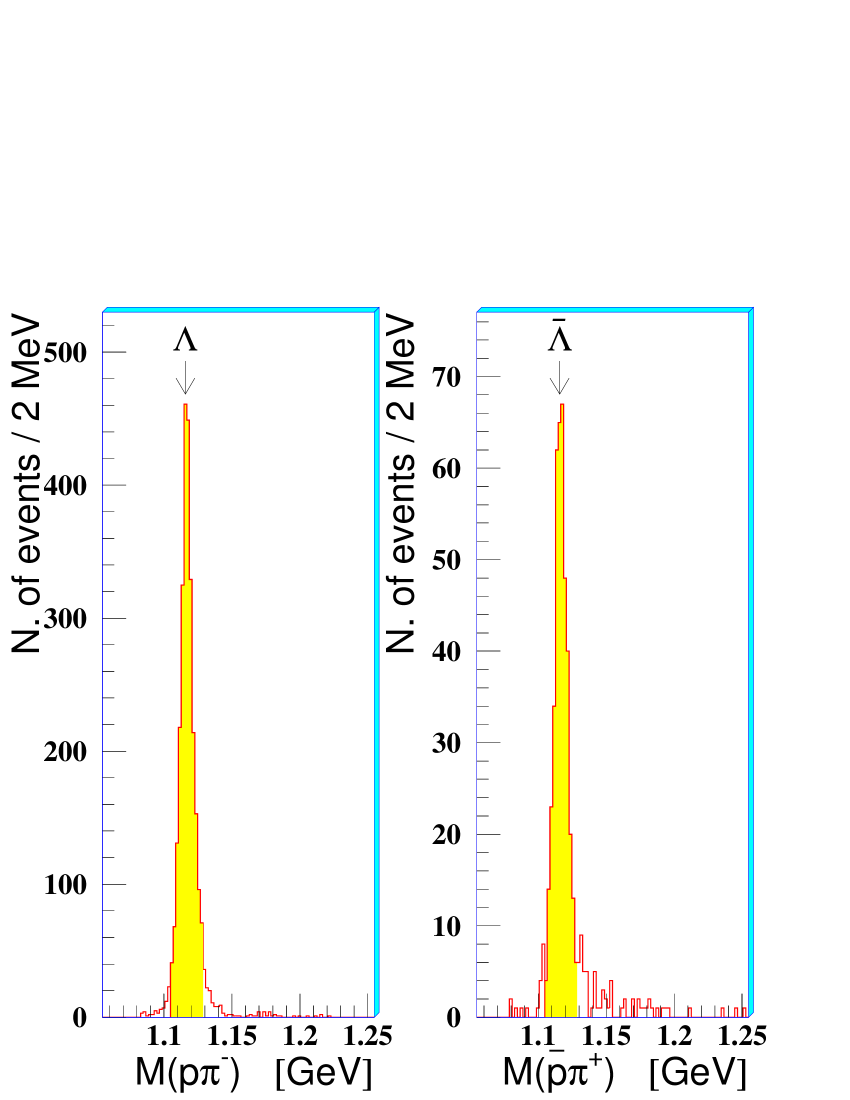
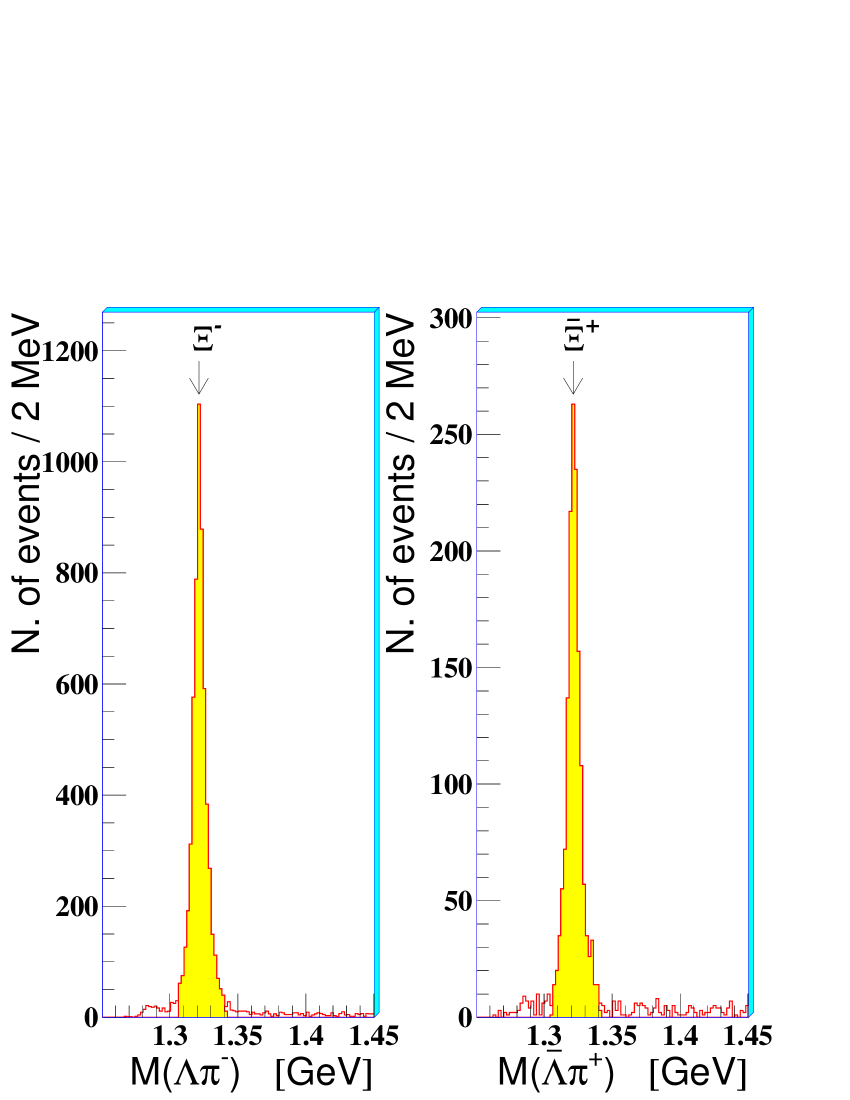
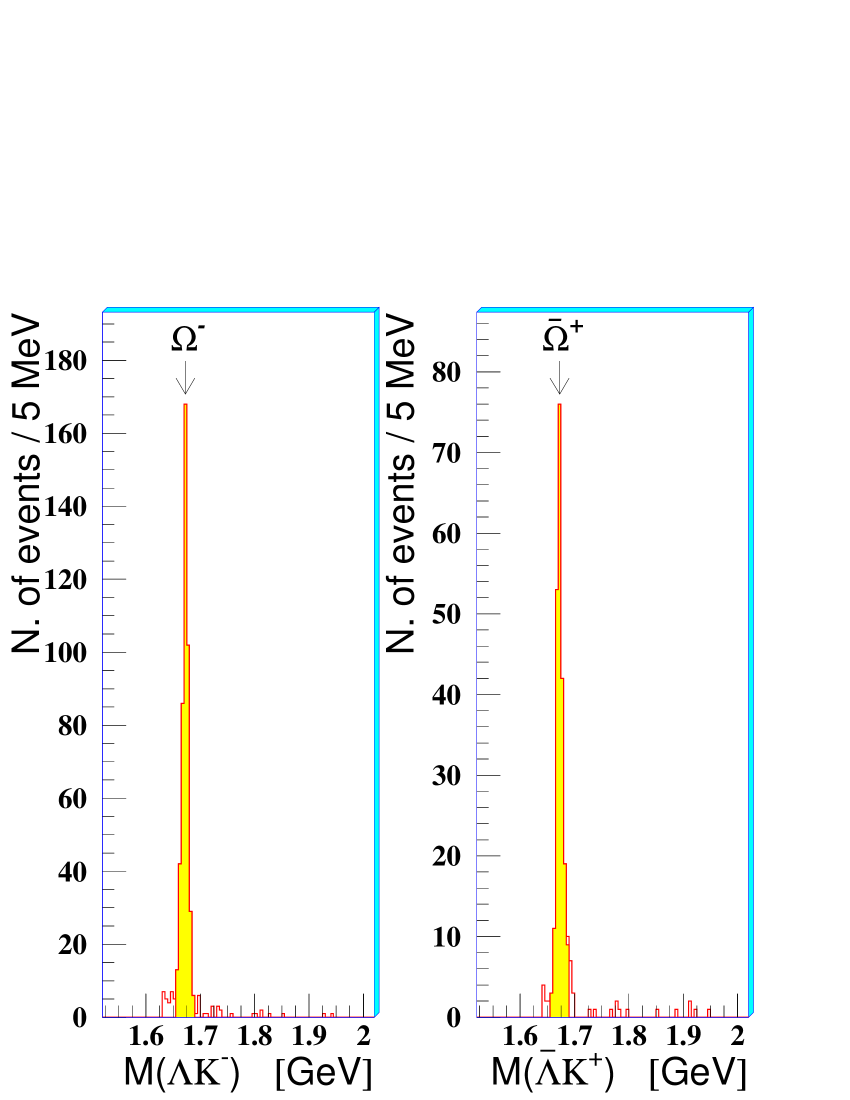
Hyperon and peaks are well centered at the PDG values [10] with FWHM of about 10 MeV (15 MeV for the ).
Although the mass spectra show very low background, a detailed study of the residual combinatorial background has been performed for the high statistics samples (, and ) using the method of event mixing. Fake , or () candidates are built by pairing all the negative particles from one event with all the positive ones from a different event, selecting events which are close in multiplicity. Then the fake s from mixed events are processed with reconstruction and analysis programs, like real events. In this way we obtain a good description of the combinatorial background. The absolute normalization is fixed by the number of pairs of oppositely charged particles in real and mixed events. Figure 3 shows the invariant mass distribution for real and mixed events before (left) and after (right) the application of the analysis cuts.
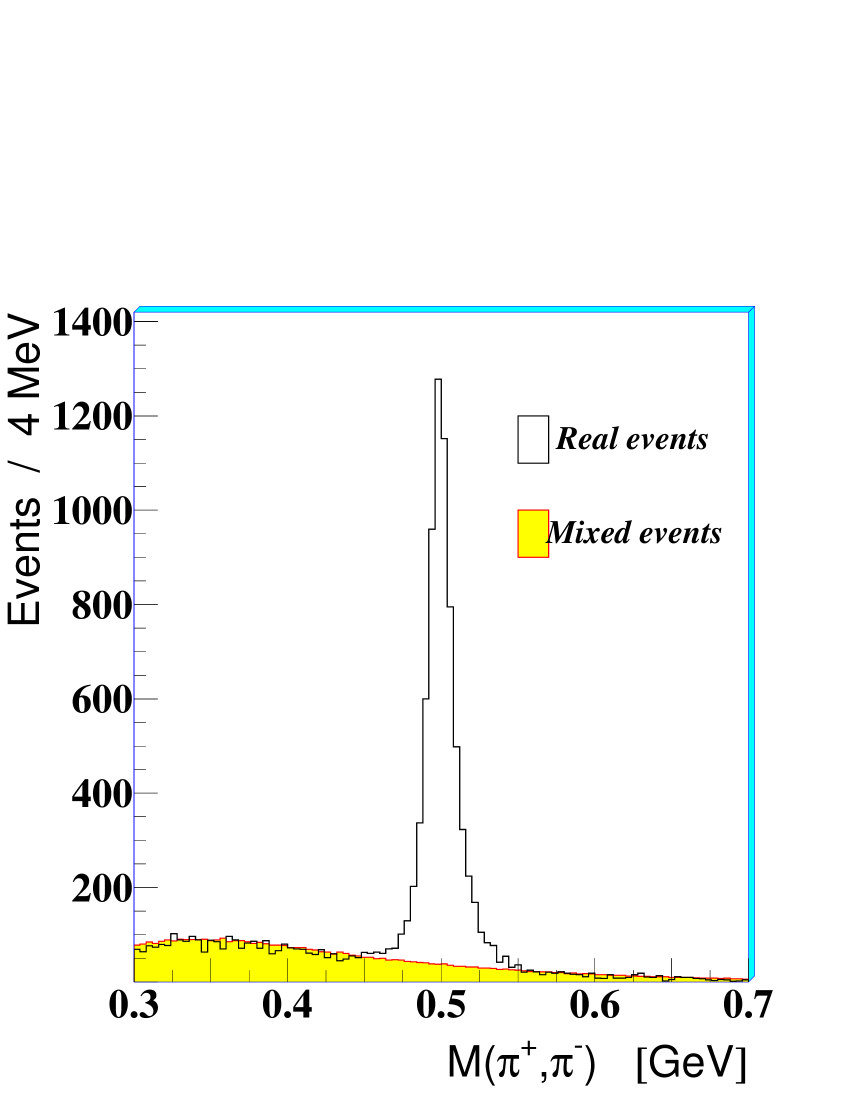
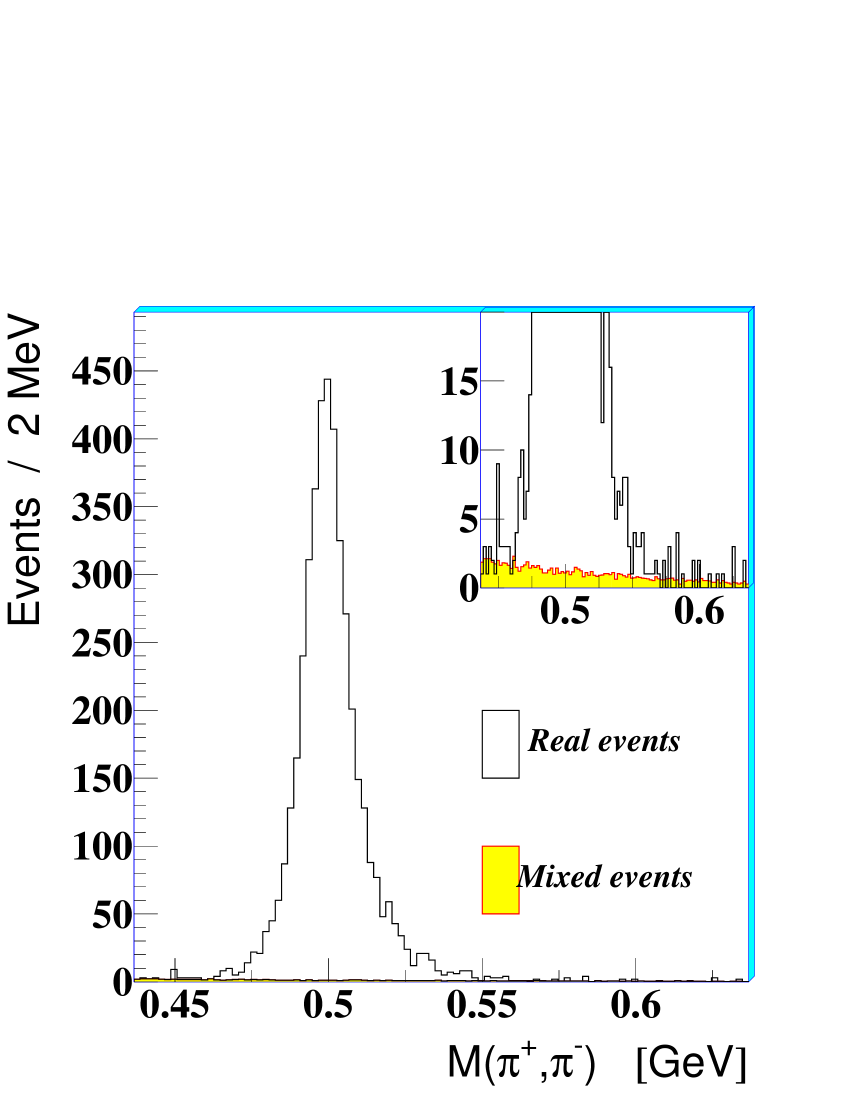
The total amount of combinatorial background is estimated to be 0.7%, 0.3% and 1.2% for , and , respectively.
We therefore neglect it.
Additional details of this method can be found in reference [11].
The estimates of the and background,
evaluated with a similar technique, are less than 4% and 6%,
respectively. They have also been neglected for this analysis.
For each particle species we define the fiducial acceptance window using a Monte Carlo simulation of the apparatus, in order to exclude the borders where the systematic errors are more difficult to evaluate. The acceptance regions are shown in figure 4.
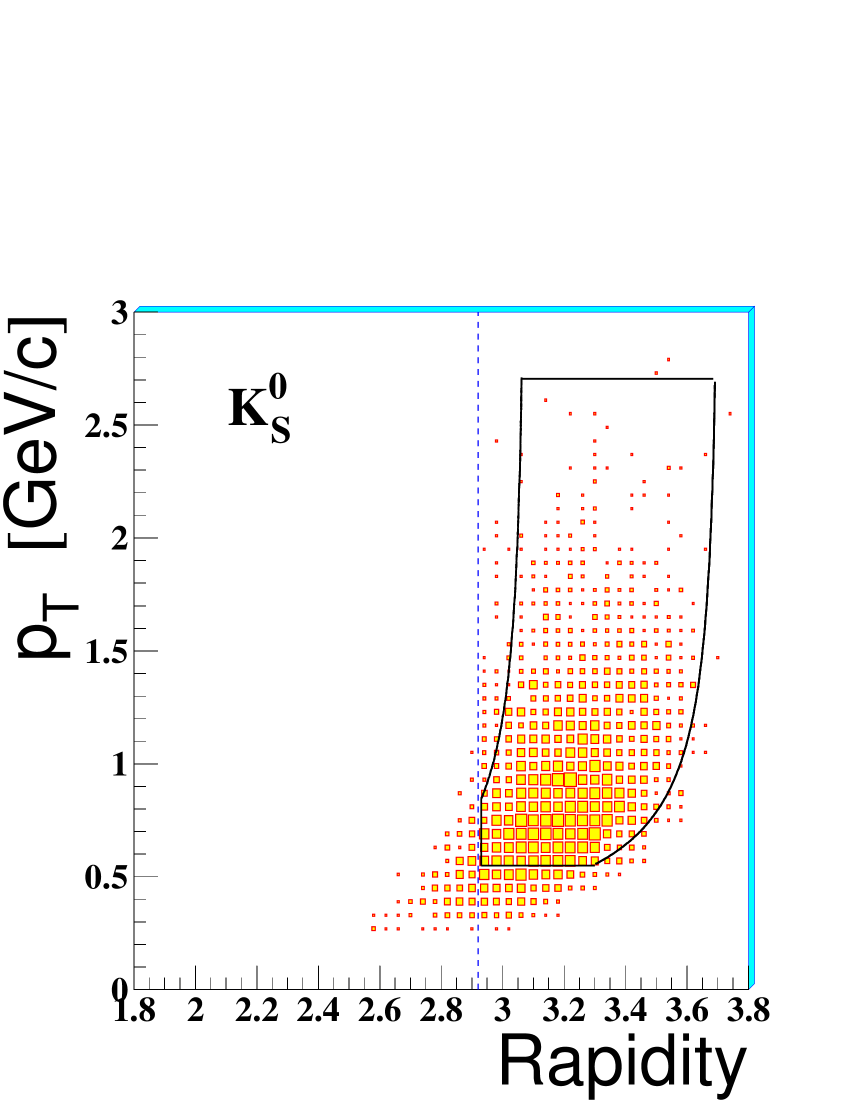
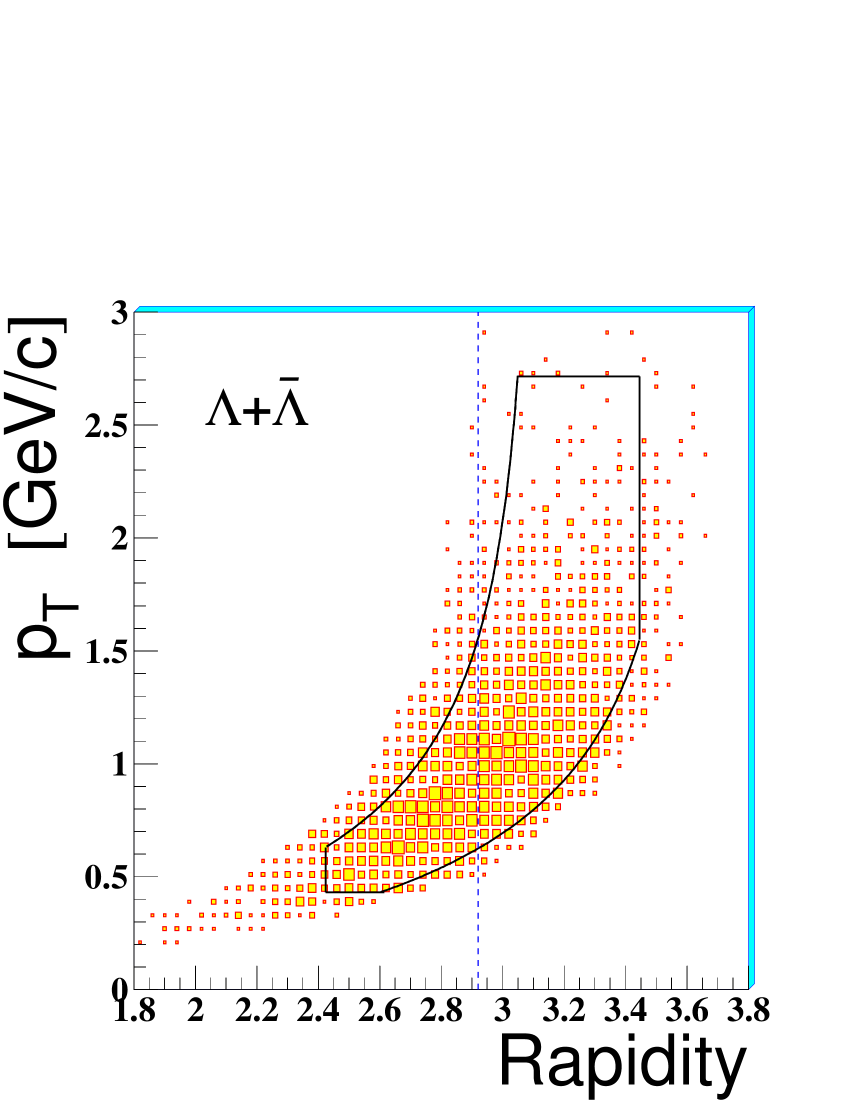
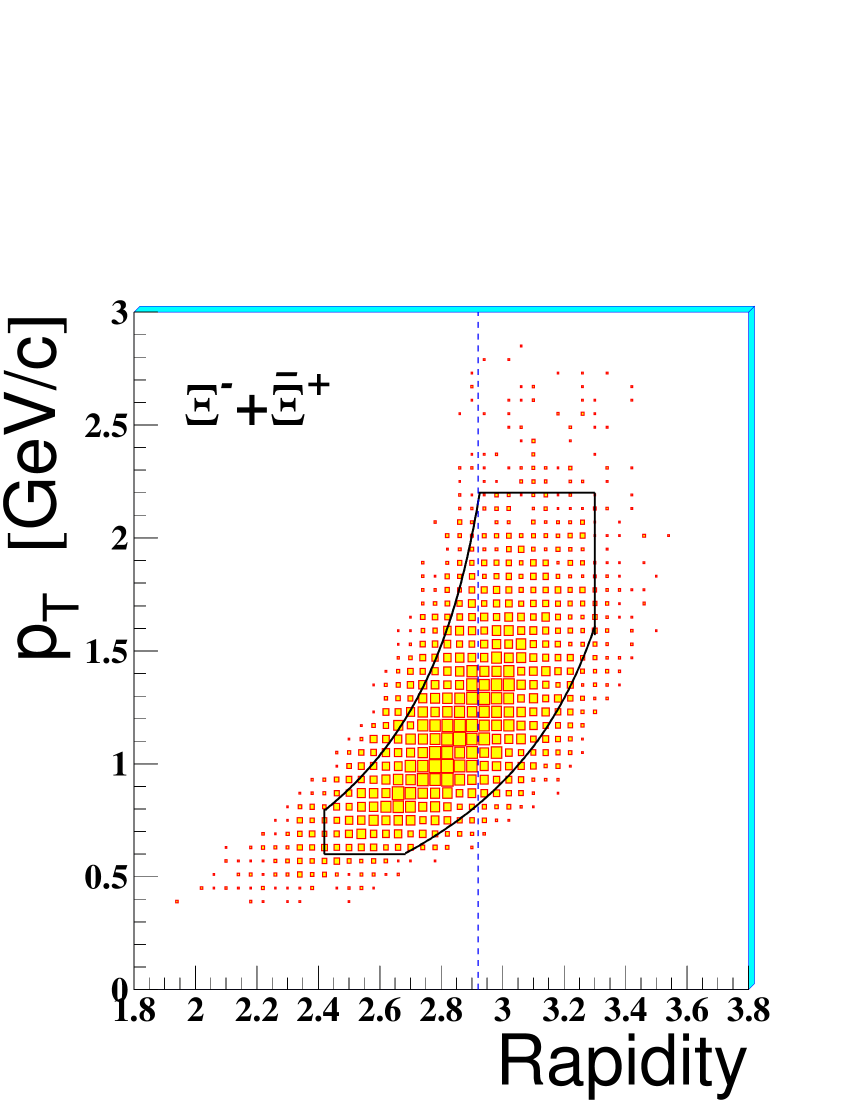
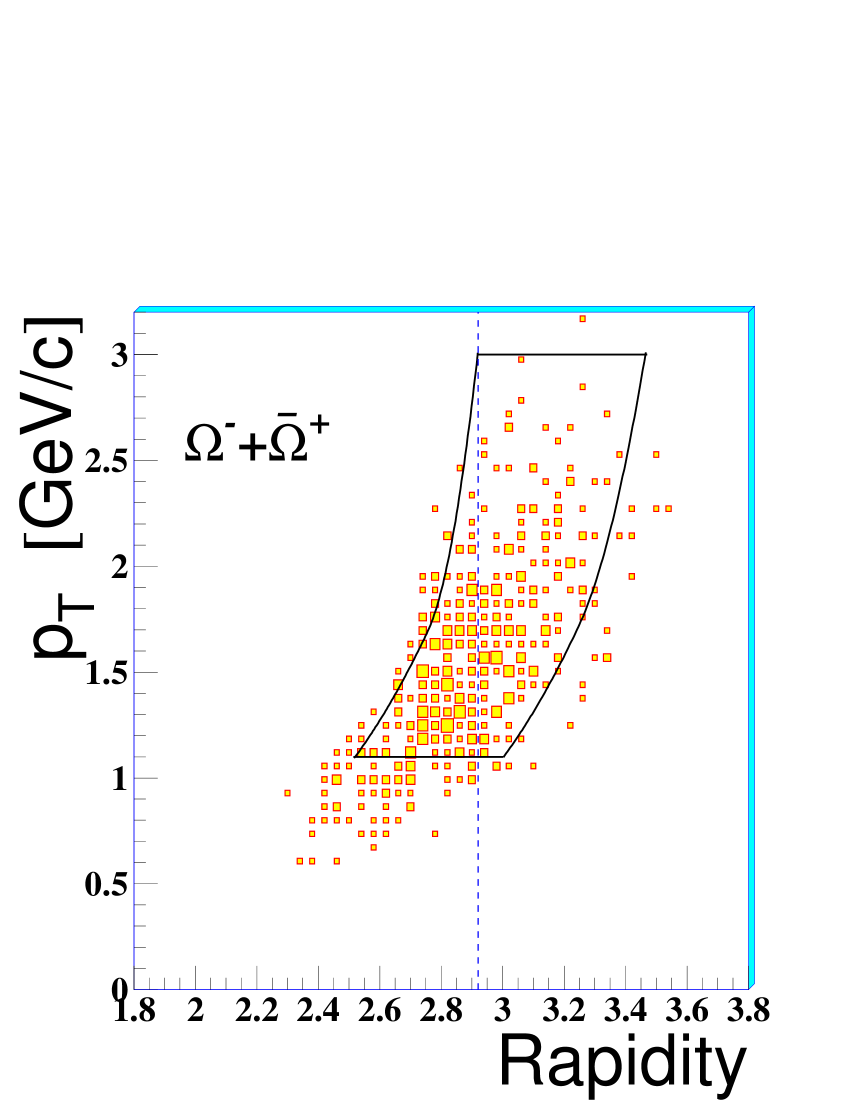
For all hyperons, the acceptance window for particle and antiparticle are the same, due to the reflection symmetry of our apparatus with respect to the magnetic field direction. As a further check, the orientation of the magnetic field was periodically inverted.
All data are corrected for geometrical acceptance and for detector and reconstruction inefficiencies on a event by event basis, with the following procedure:
-
•
for each reconstructed particle a sample of Monte Carlo particles is generated with the same measured rapidity and transverse momentum , random azimuthal angle and the primary vertex position generated randomly within the target according to the measured beam profile;
-
•
the Monte Carlo particles are traced through a simulation of the apparatus 111Silicon pixel detector efficiencies are accounted for chip-by-chip. Each chip contains 2032 or 1006 sensitive cells (pixels) where the pixel size is, respectively, m2 or m2 [8]. based on GEANT [12] allowing them to decay according to their life times and random internal decay angles.
-
•
the hits of the decay tracks are merged with those of a real event — with a hit multiplicity close to that of the original event — in order to account for background tracks and electronic noise;
-
•
the merged event is processed through the NA57 reconstruction and analysis chain;
-
•
the weight to be associated with the real event is calculated as the ratio of the number of Monte Carlo generated events to the number of Monte Carlo events successfully reconstructed and retained by all analysis selection criteria.
It has been checked that the final weights are not sensitive to the
experimental smearing in and .
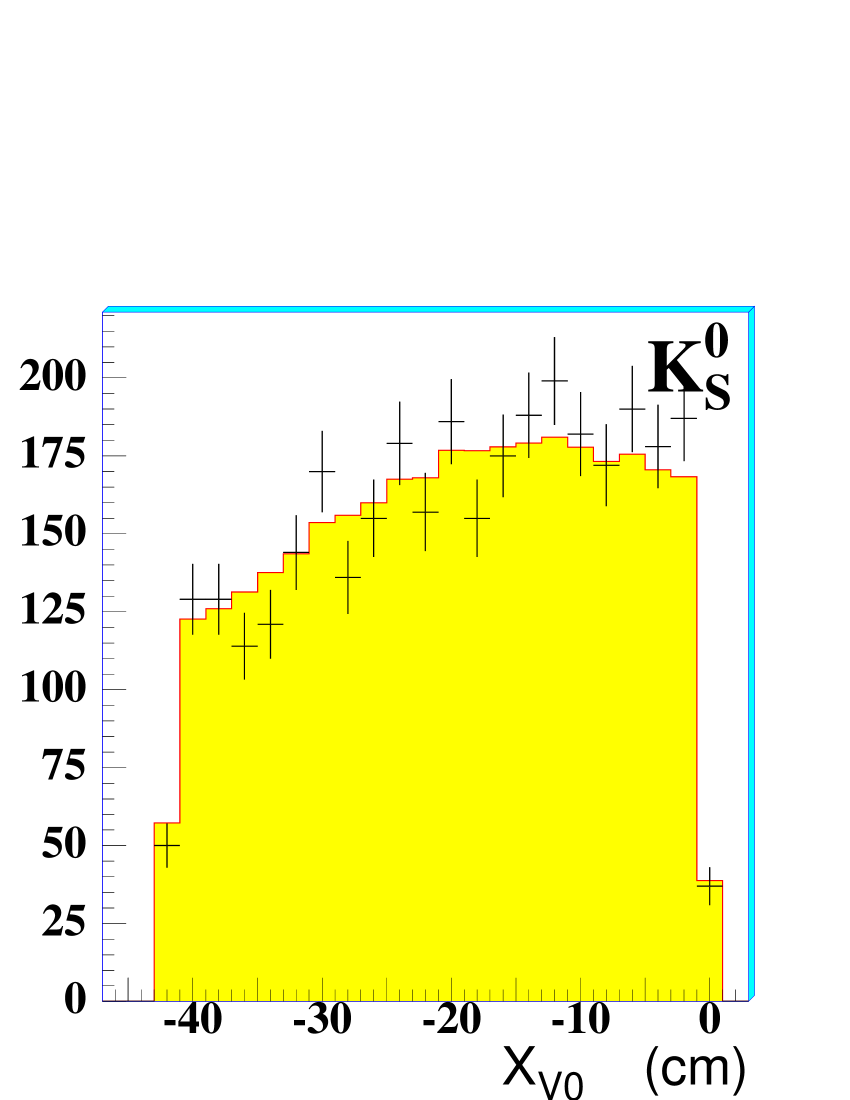
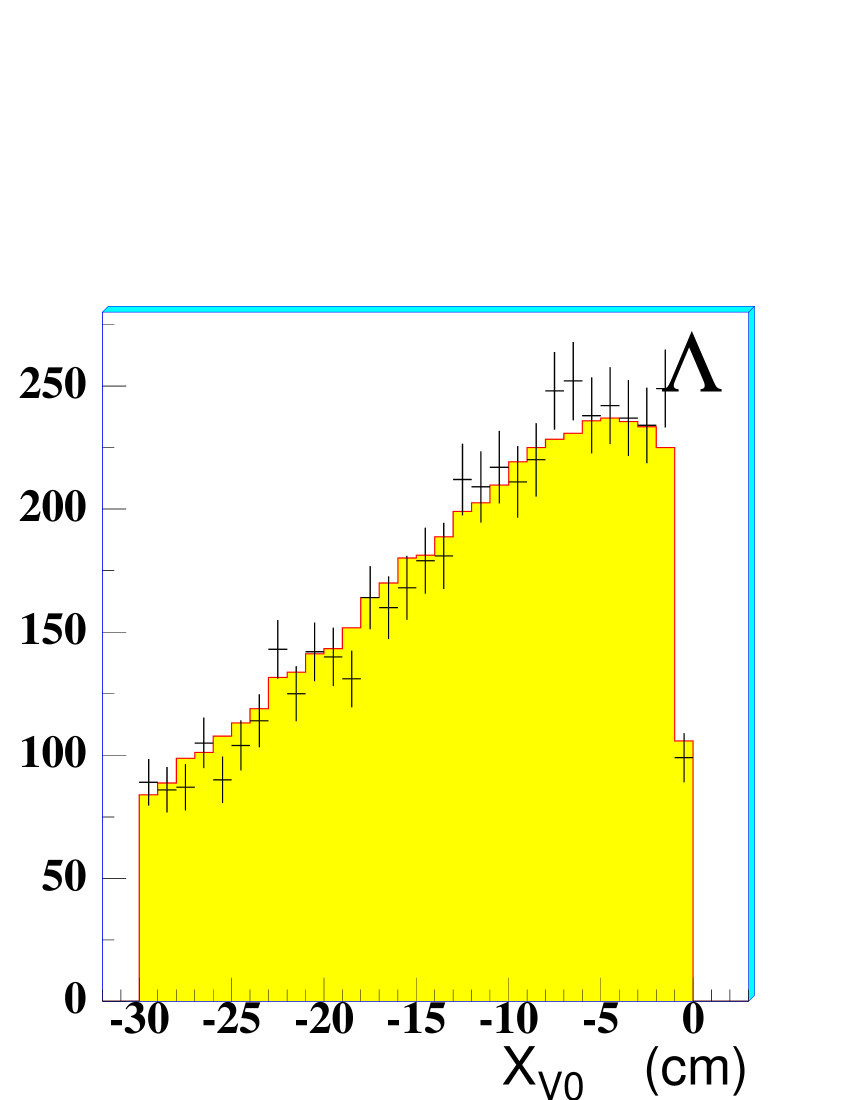
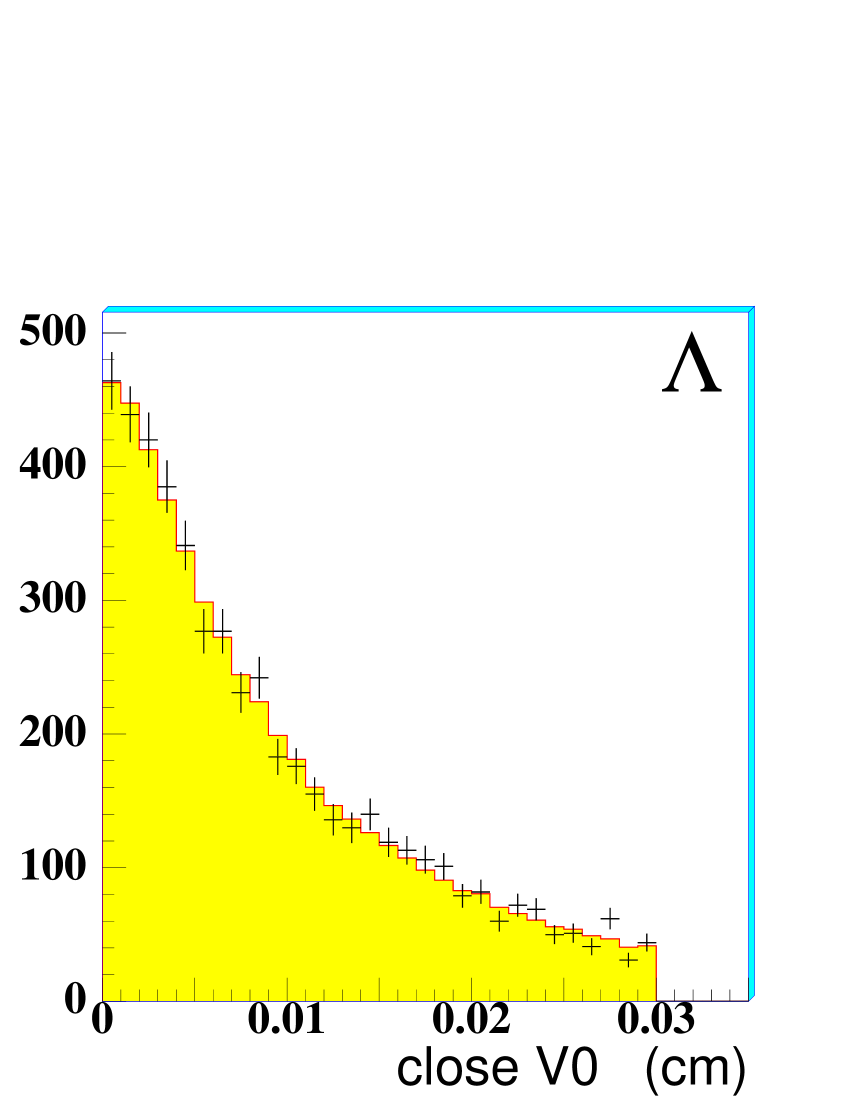
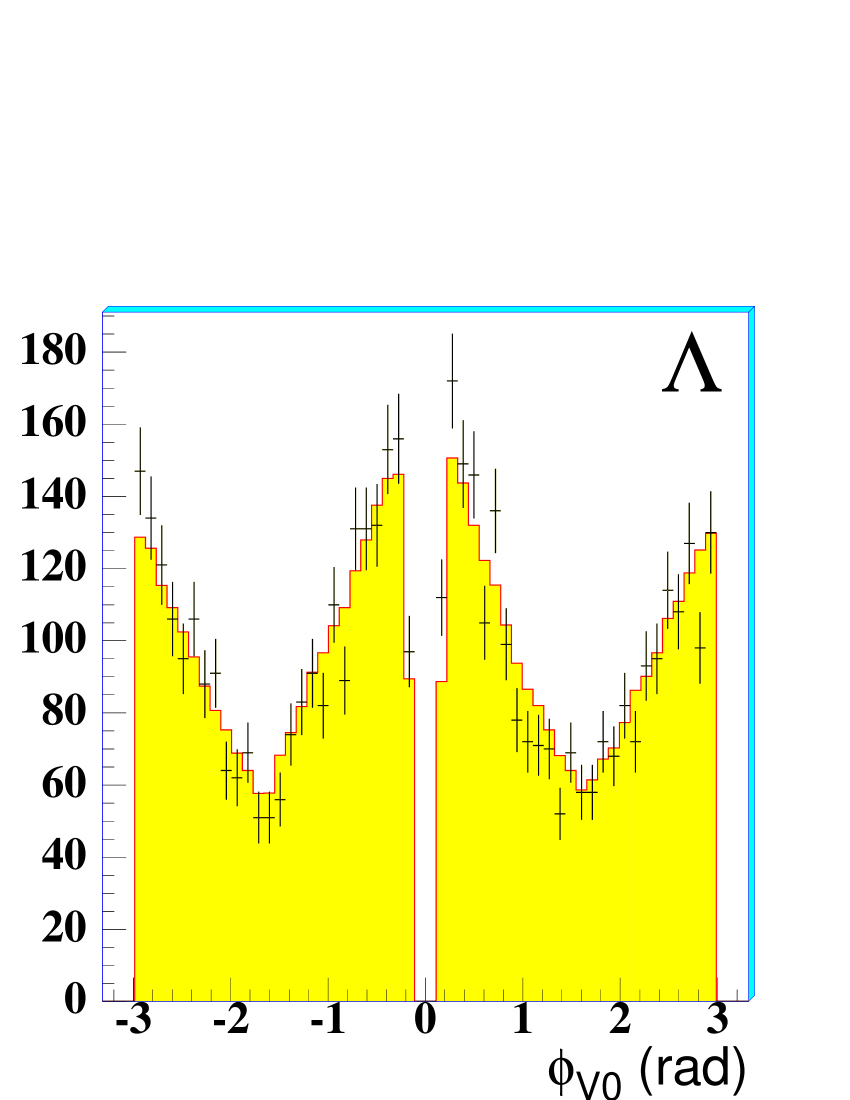
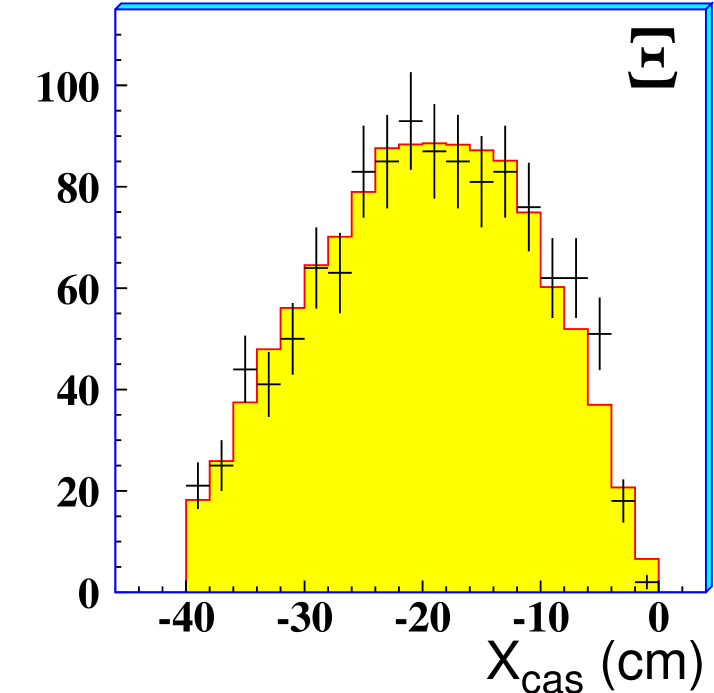
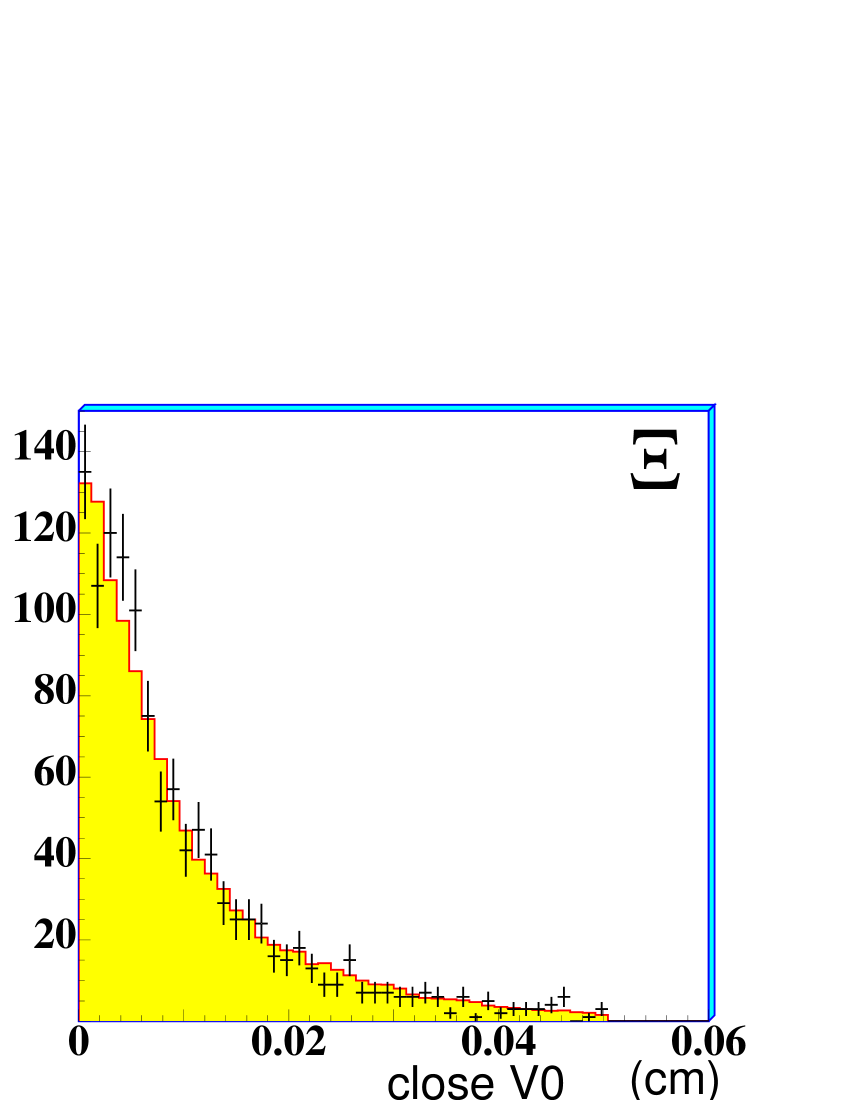
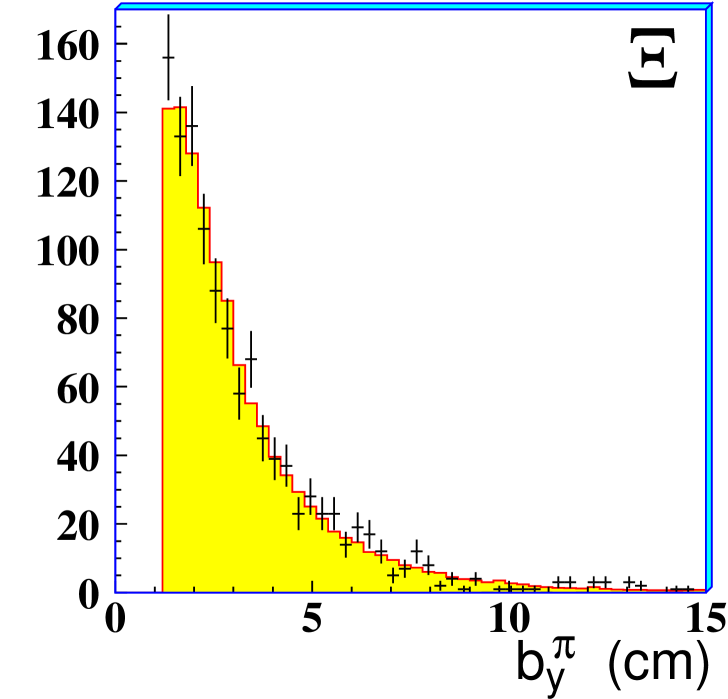
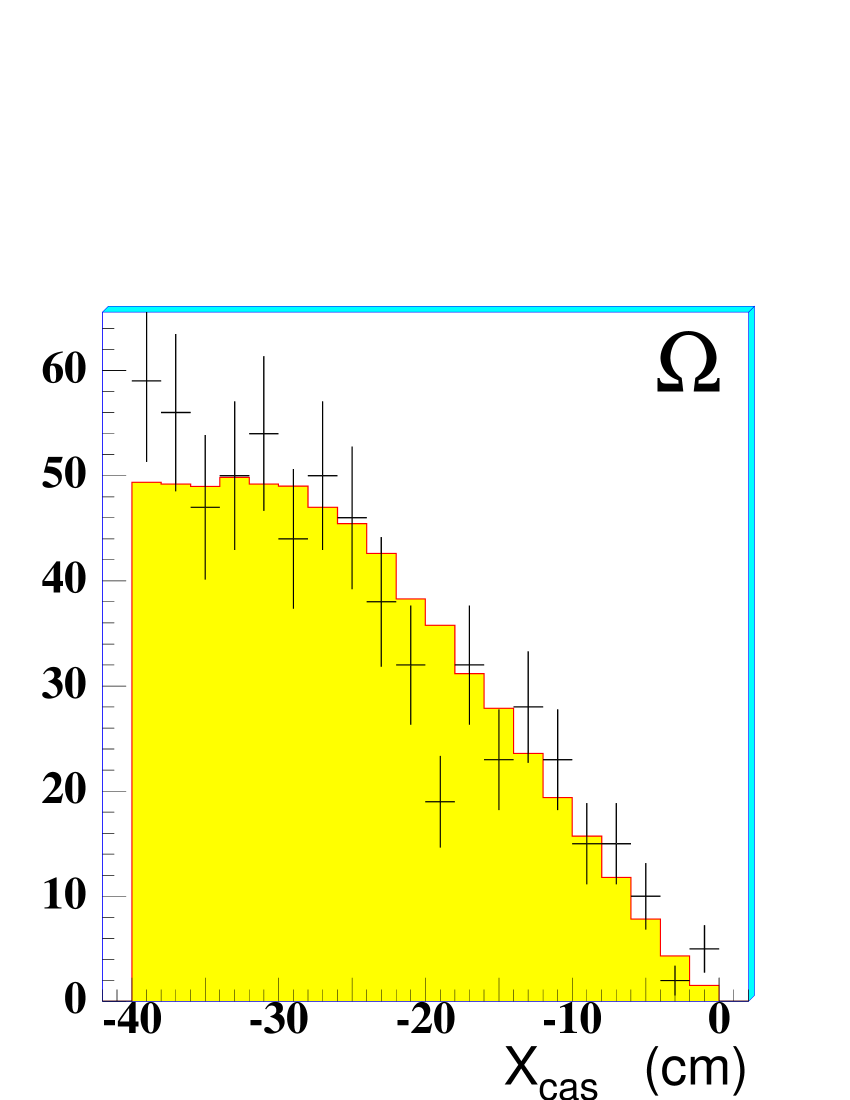
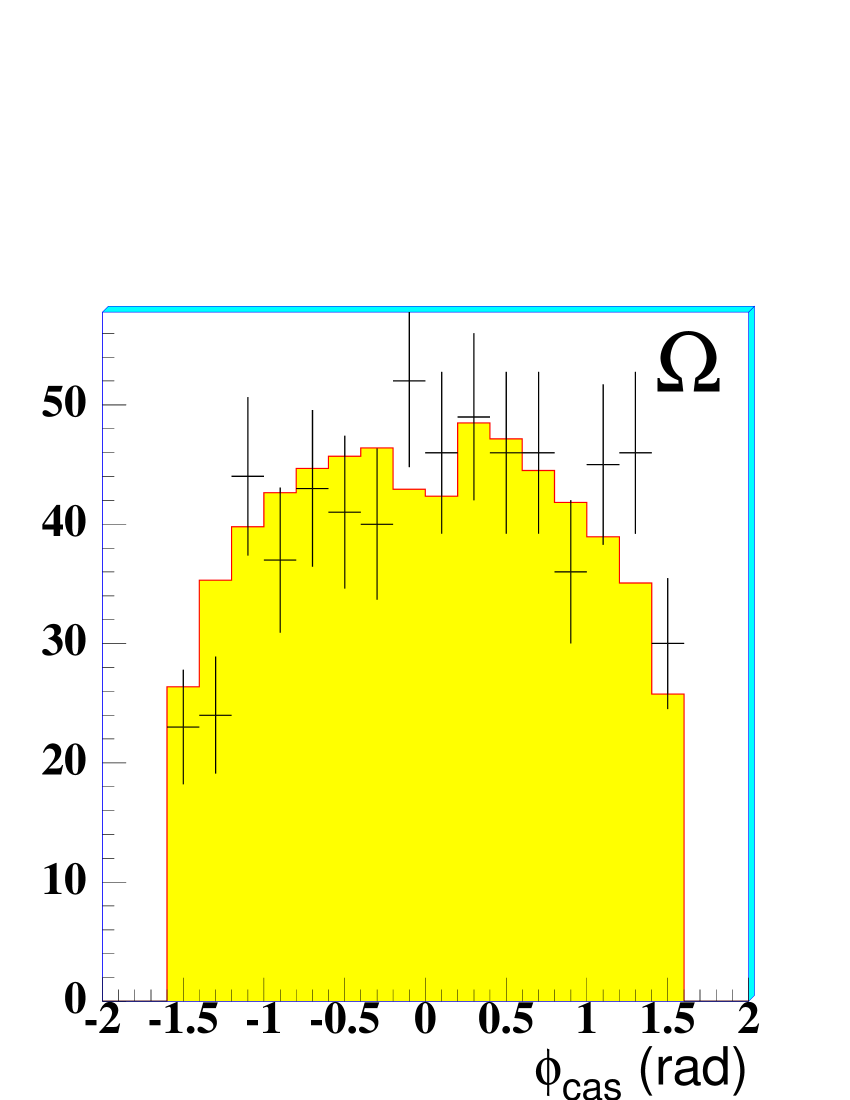
The simulation used for calculating the correction factors has been checked
in detail [13] by comparing real and Monte Carlo distributions
for several parameters, and they show good agreement.
As an example, we show in figure 5
three such distributions for each particle species.


The systematic errors on the inverse slopes have been estimated to be about 10% for all the strange particles.
The weighting method described above is CPU intensive; therefore, while each of the reconstructed s and s have been individually weighted, for the much more abundant , and samples we only weighted a small fraction of the total sample in order to reach a statistical accuracy better than the limits imposed by the systematic error. Table 1 shows the strange particle samples collected by NA57 and those used for the present analysis.
| Particle | |||||||
|---|---|---|---|---|---|---|---|
| weighted | 3340 | 2350 | 2718 | 5858 | 1522 | 432 | 192 |
| collected |
The charged particle multiplicity distribution, which is shown in figure 6, has been divided into five centrality classes (0,1,2,3,4), class 0 being the most peripheral and class 4 the most central. The drop at low multiplicities is due to the centrality selection applied at the trigger level. The fractions of the inelastic cross-section for the five classes, calculated assuming a total cross section of barn, are given in table 2.

| Class | |||||
|---|---|---|---|---|---|
| (%) | 53–40 | 40–23 | 23–11 | 11–4.5 | 4.5–0 |
The procedure for the measurement of the multiplicity distribution and the determination of the collision centrality for each class is described in reference [14].
4 Inverse slopes of the transverse mass spectra
The double-differential distribution for each particle species has been parametrized using the expression
| (2) |
assuming the rapidity distribution to be flat within our acceptance region
().
The inverse slope parameter (“apparent temperature”)
has been extracted by means of a maximum likelihood fit of equation 2
to the data. As discussed in the next section, this apparent temperature
is interpreted as due to the
thermal motion coupled with a collective transverse flow
of the fireball components assumed to be in thermal equilibrium.
In the fits of the and particle spectra,
the lower limit for the accepted transverse momentum was chosen to be 1.4 GeV/.
This choice allows us to exclude a possible instrumental bias at low for .
The values of the transverse expansion velocity and of the freeze-out
temperature obtained within the blast-wave model (see section 5) do not depend significantly on the choice of the lower limit.
The distributions for strange particles measured for the full centrality range under consideration are shown in figure 7.
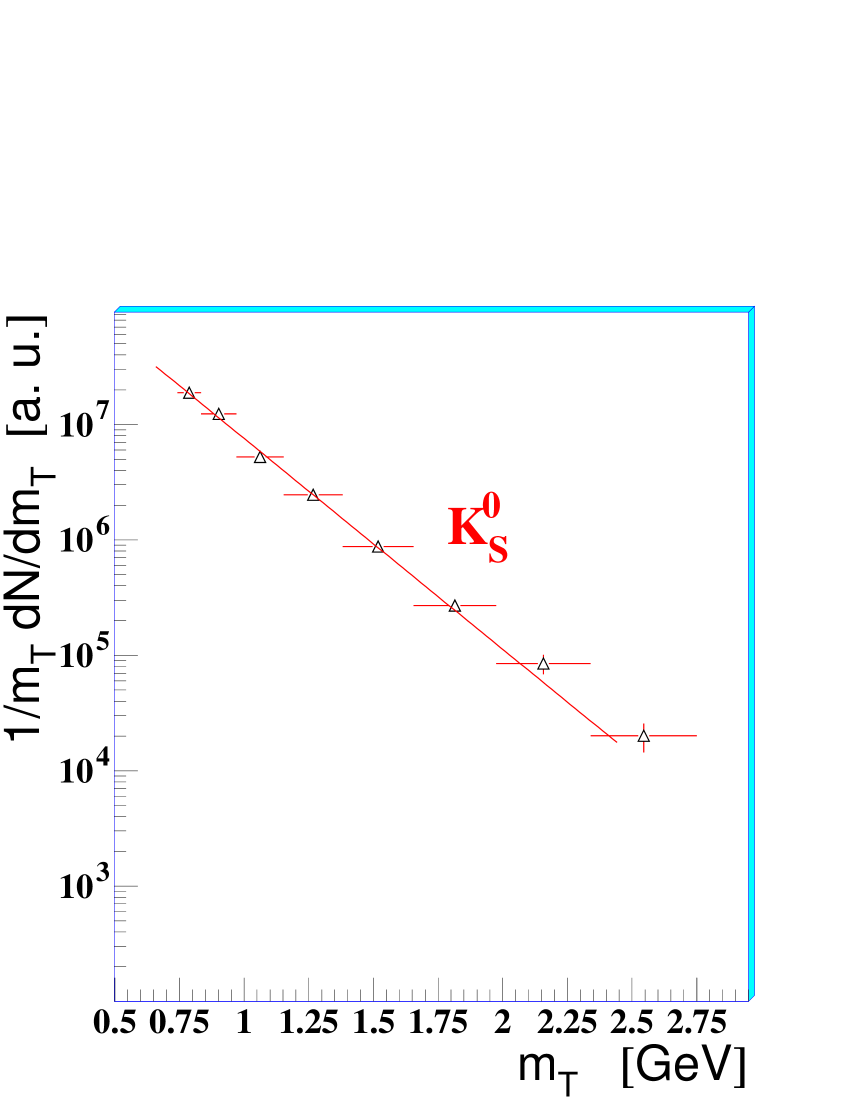
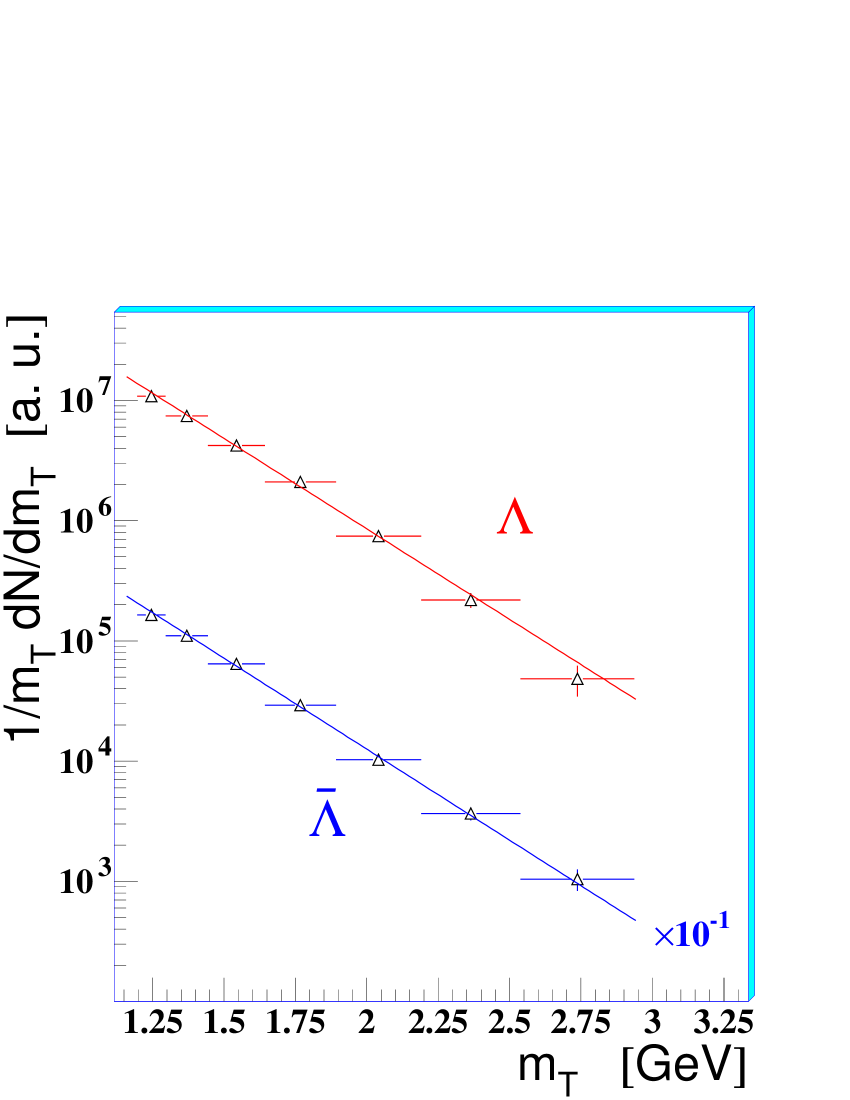
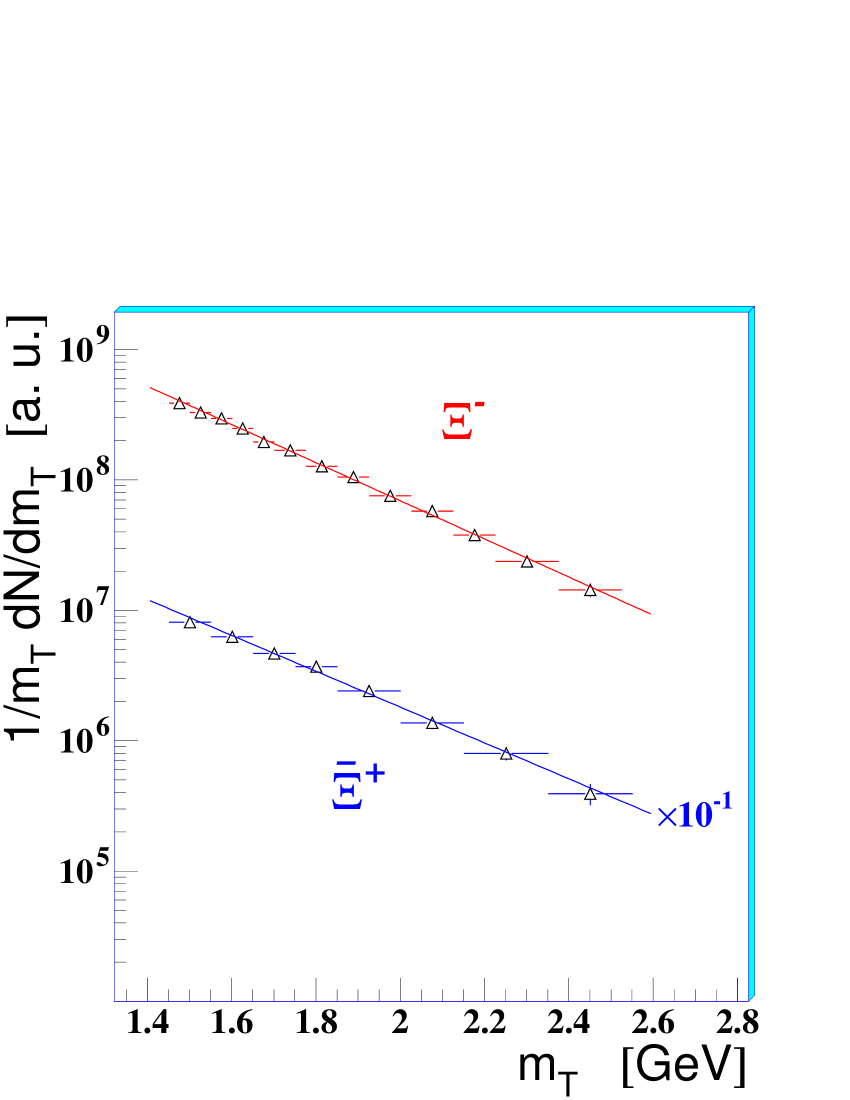

The shapes of all spectra are well described by exponential functions. In the next section, we exploit the deviations from the exponential in order to disentangle the transverse flow from the thermal motion. The inverse slope parameters of the transverse mass spectra are given in table 3. They are in agreement within the errors with those measured over a smaller centrality range (about the 40% most central inelastic Pb-Pb cross-section) by the WA97 experiment [15].
A compilation of data222 NA49 results are taken from the following references: , and from [16]; from [17]; , and from [18]; from [19]; and from [20]; and from [21]; and from [22]; deuteron from [23]. NA44 results are collected for , , , , , from reference [24] and for the deuteron from reference [25]. The point at GeV/ corresponds to the NA50 determination of a thermal spectrum for the charmonium state [26]. The spectra are fitted using a modified Bessel function, namely ; this yields an inverse slope MeV (the value showed in figure 8) for the most central collisions, which is smaller by about 5–10 MeV than the one obtained with the exponential function [26]. Finally the NA50 inverse slopes for the and vector-mesons are taken from reference [27]. on the inverse slopes as a function of the particle mass in Pb-Pb interactions at 158 GeV/ is shown in figure 8.
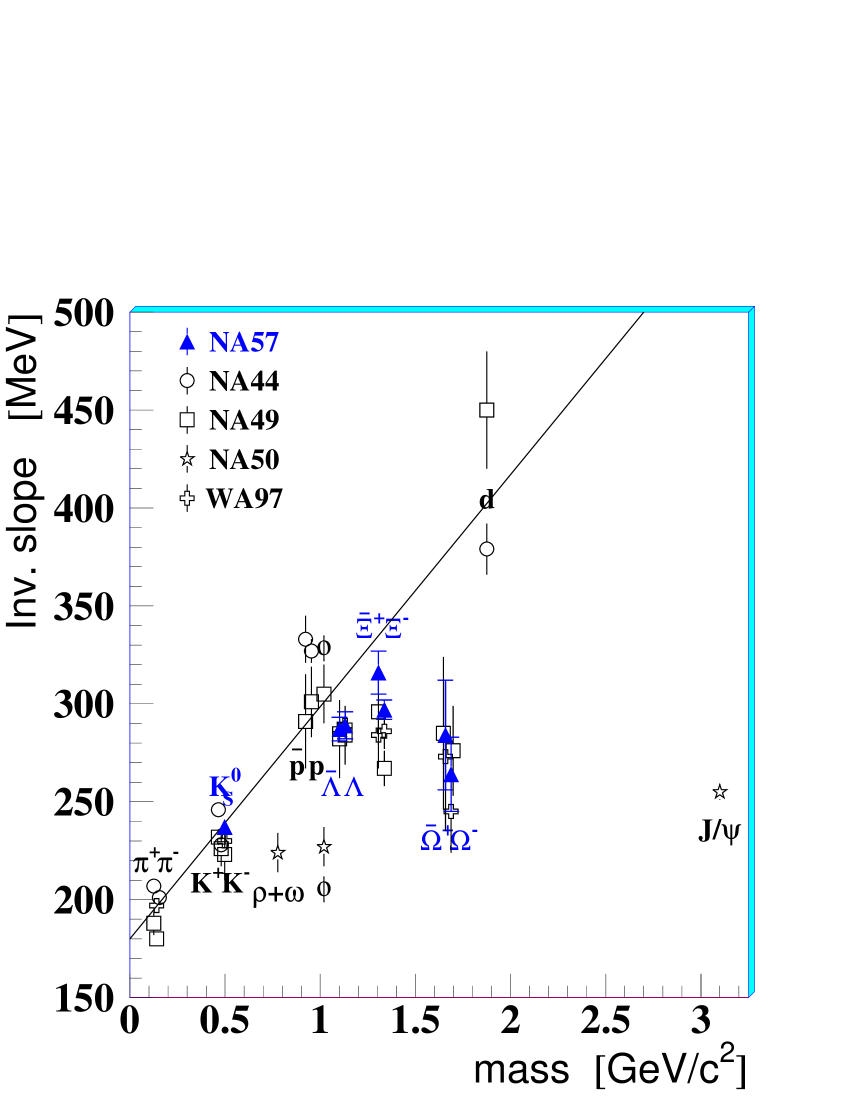
As already found by the WA97 experiment, the inverse slopes of the hyperon and of the fall below the line drawn through the , K and proton points. This observation has been interpreted as due to an early freeze-out of multi-strange hadrons [28].
4.1 Centrality dependence
We have fitted the weighted data by equation 2 separately for each of the five multiplicity classes indicated in figure 6.

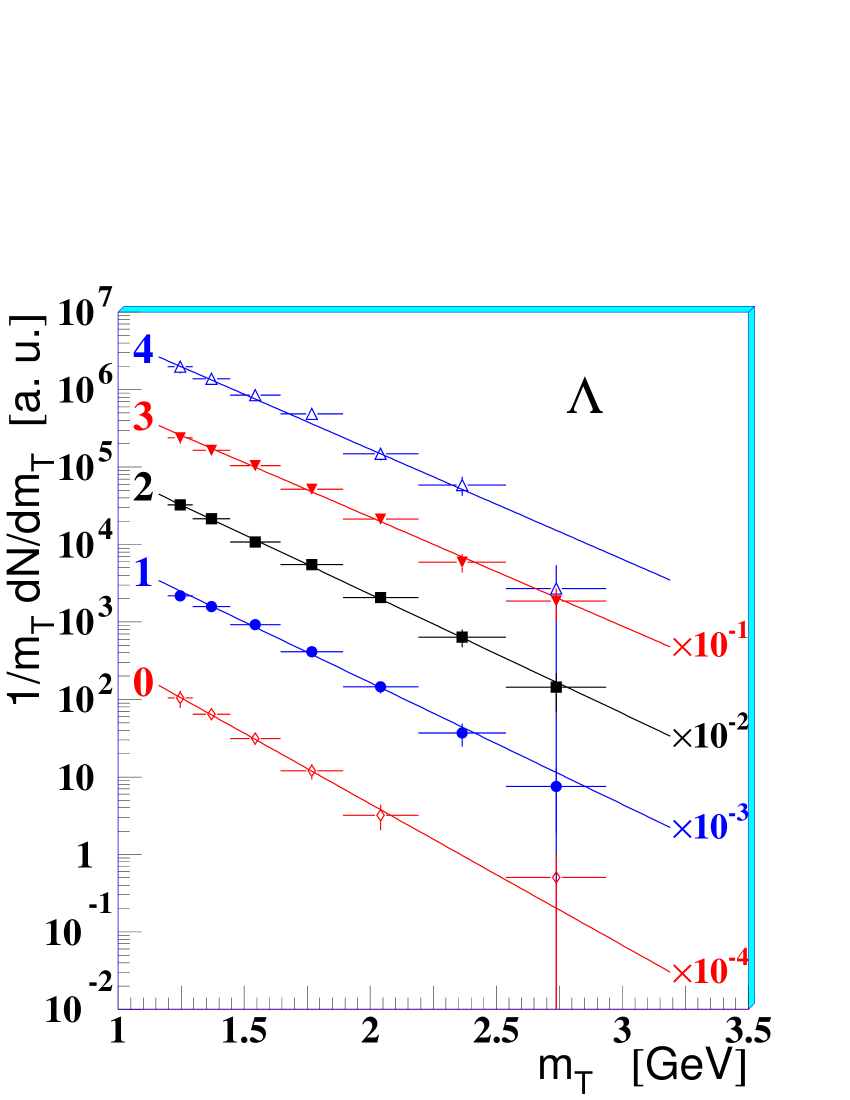

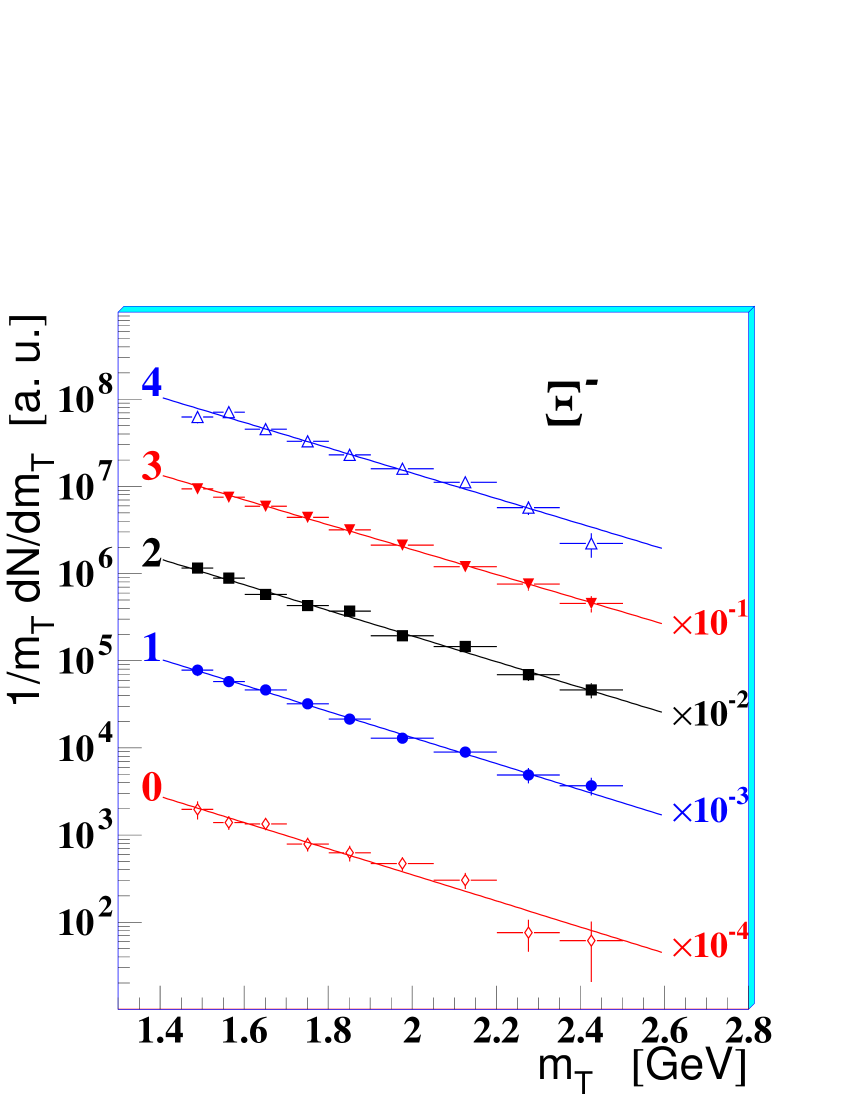

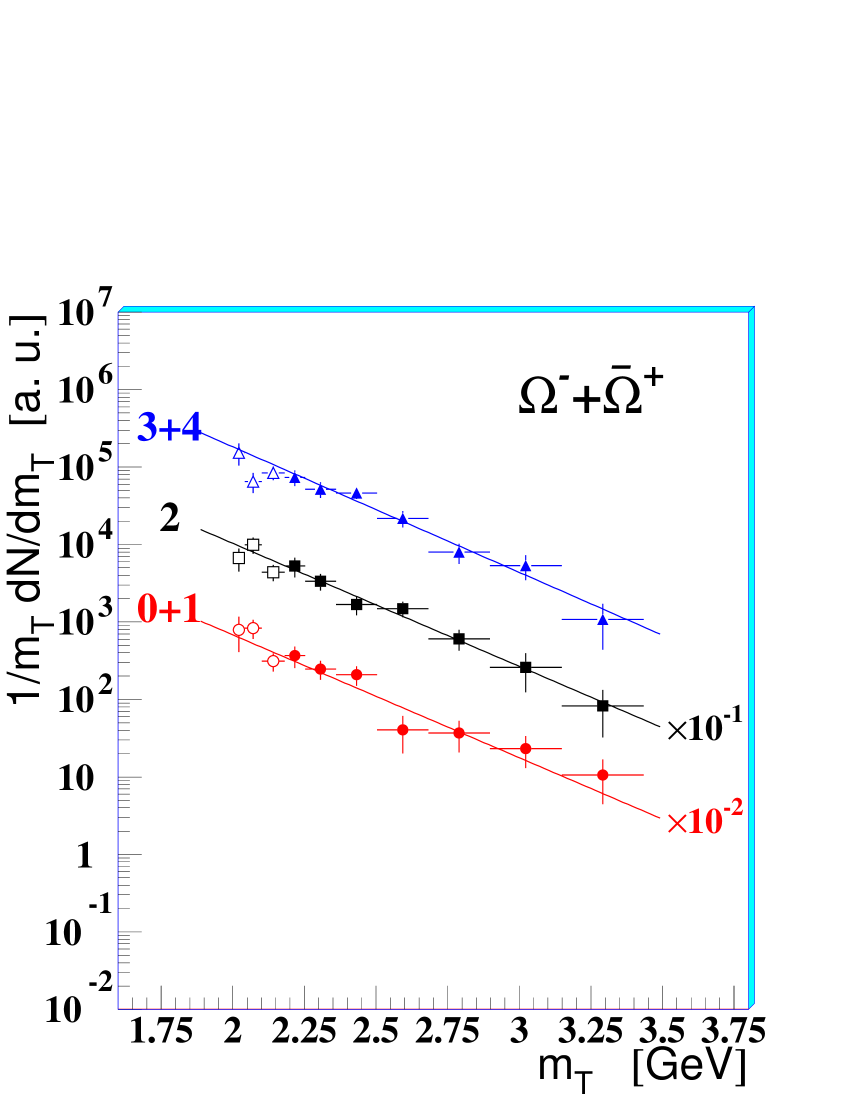
In order to reduce the statistical errors, the and samples have been divided into only three centrality classes instead of five: , and . The spectra are shown in figure 9 together with the exponential functions having inverse slopes as obtained from the maximum likelihood fit. The numerical values of the inverse slopes are given in table 4.
| Pb-Pb | |||||||
|---|---|---|---|---|---|---|---|
| p-Be | p-Pb | 0 | 1 | 2 | 3 | 4 | |
| + | |||||||
An increase of the inverse slopes with the centrality is observed in Pb-Pb
for , and possibly also for .
Inverse slopes for p-Be and p-Pb collisions as measured by
WA97 [29] are also given in table 4. In central
and semi-central Pb-Pb collisions (i.e. classes 1 to 4) one observes
baryon-antibaryon symmetry in the shapes of the spectra:
this can be seen in the values of the inverse slopes which are compatible for
each hyperon and its antiparticle.
This symmetry is not observed
in p-Be
collisions.
The similarity of baryon and antibaryon slopes observed in Pb-Pb
suggests that strange baryons and antibaryons are produced by a similar
mechanism in nuclear collisions.
5 Blast-wave description of the spectra
In this section we use the statistical hadronization model of
reference [5] to describe the strange particle spectra
discussed above.
The model assumes that particles decouple from a system in local thermal
equilibrium with temperature , which expands both longitudinally
and in the transverse direction;
the longitudinal expansion is taken to be boost-invariant
and the
transverse expansion is defined in terms of a transverse velocity
field. Finally, the statistical distributions are
approximated by the Boltzmann distribution.
The blast-wave model predicts a double differential cross-section
for a particle species of the form:
| (3) |
where , and are two
modified Bessel functions and is a normalization
constant.
With respect to a cylindrical reference system (,,,),
the freeze-out hypersurface is constrained by ,
and ;
the last condition assumes that the particles decouple suddenly
from the whole transverse profile of the
fireball at time . In these expressions is the transverse geometric
radius of the source.
In case of a peripheral collision, the azimuthal symmetry is evidently broken;
however it is recovered when considering the spectrum of particles
accumulated over many
events with random impact parameters, which is
our approach.
The transverse velocity field can be parametrized
according to a power law:
| (4) |
With this type of profile the numerical value of does not influence the shape of the spectra but just the absolute normalization (i.e. the constant). Once the transverse flow profile (i.e. equation 4) has been fixed, the shape of each spectrum is determined by the temperature, the velocity of the transverse expansion and the mass of the particle. The parameters which can be extracted from a fit of equation 3 to the experimental spectra are thus the thermal freeze-out temperature and the surface transverse flow velocity . In order to compare results from different profile hypotheses, corresponding to different values of the exponent in equation 4, the average transverse flow velocity can be used instead. Assuming a uniform particle density, the average222A more sophisticated averaging can be achieved by incorporating not only the transverse geometry of the model but also the phase space density of particles [30]. According to this definition, is also a function of and it differs from the values calculated according to equation 5 by 2% if , by 5% if and by 10% if ; obviously for , independently of the average definition. is [30]:
| (5) |
5.1 Global fits to the spectra using different flow velocity profiles
Preliminary NA57 results of the blast-wave model were presented [31] using a constant () velocity profile, for the purpose of comparison with the NA49 analysis [32]. In the following, we will adopt primarily the linear () -dependence of the transverse flow velocity. In fact, a constant flow profile description of the transverse expansion is internally inconsistent, because the outermost fluid elements of the expanding fireball should have travelled faster than the innermost ones: if . On the other hand, the quadratic profile () is disfavoured by data, as will be shown below. We also consider the profile which has been suggested to resemble closely the solution of the full hydro-dynamical calculation [33].
The global fit of equation 3 with to the data points of all the measured strange particle spectra is shown in figure 10; it successfully describes all the distributions with , yielding the following values for the two parameters and :
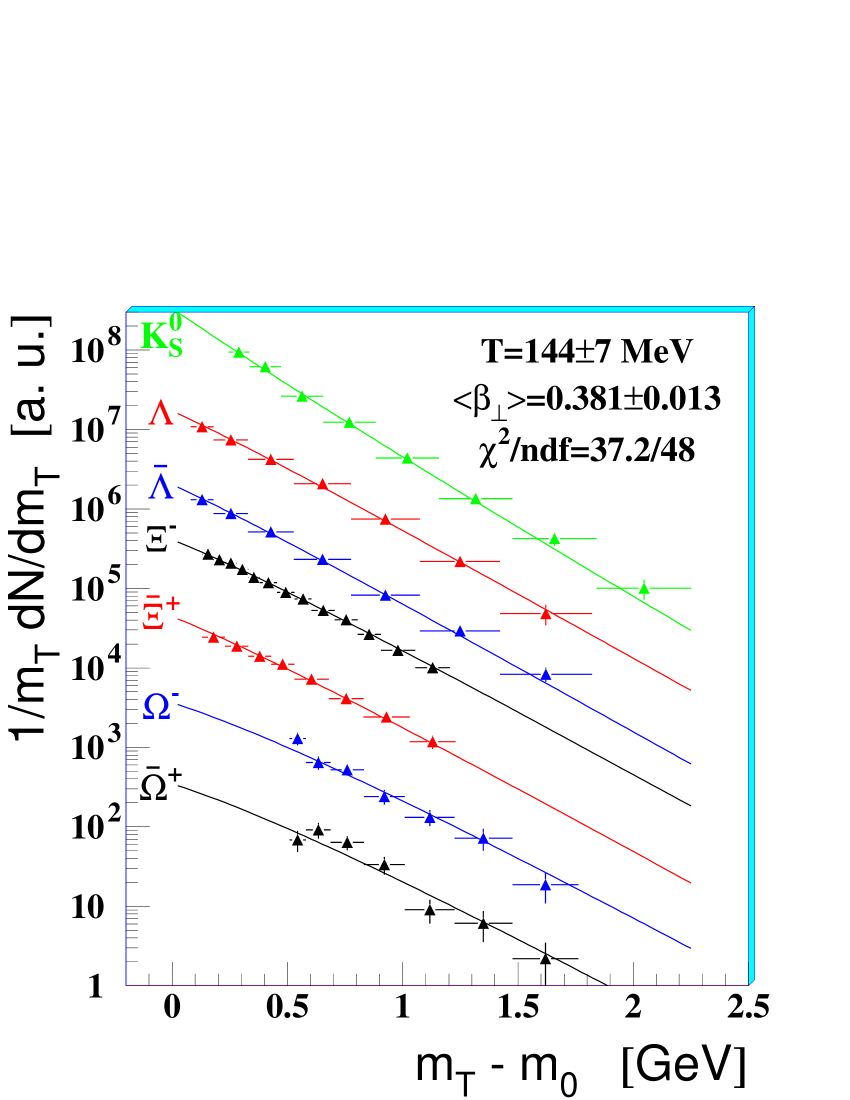
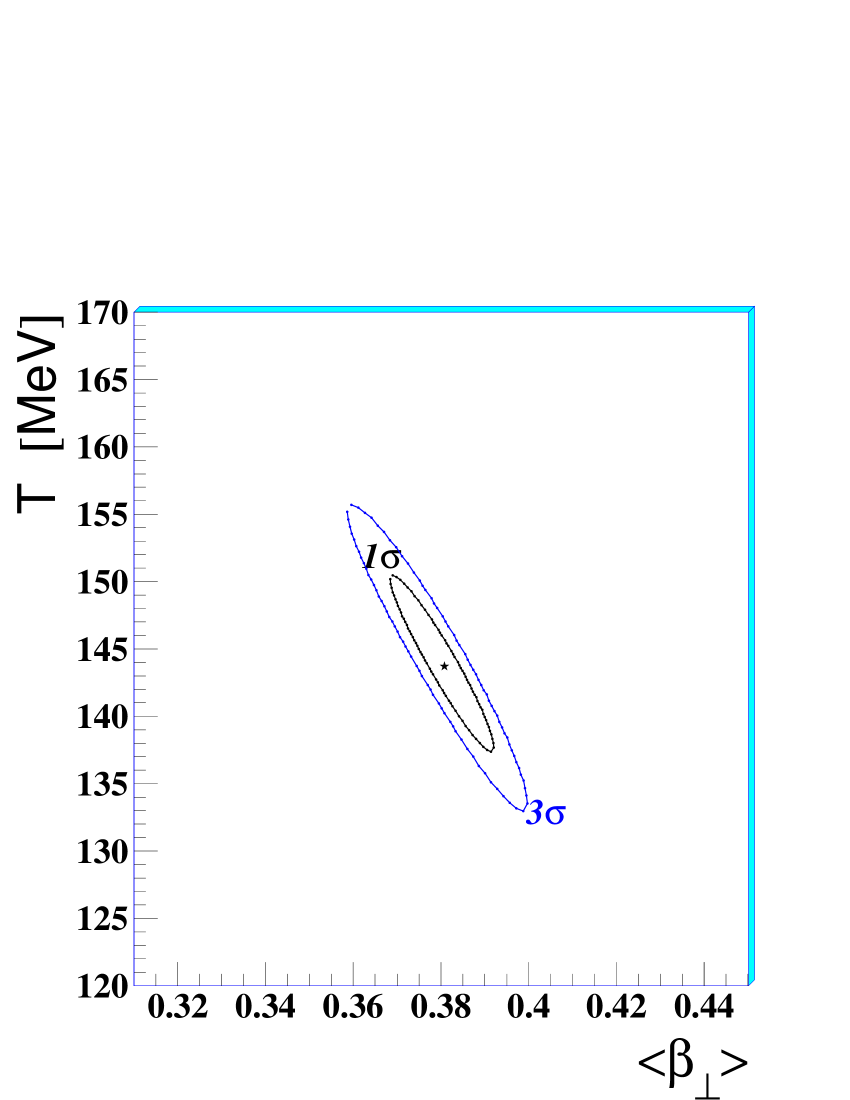
The and parameters are found to be statistically anti-correlated, as can be seen from the confidence level contours shown in figure 10. Conversely, the systematic errors on and are found to be correlated and they are estimated to be and , respectively.
The results of the fits with all the four profile hypotheses are given in table 5.
| (MeV) | ||||
|---|---|---|---|---|
The three profiles , and yield similar values of the freeze-out temperatures and of the average transverse flow velocities, with good values of . The quadratic profile is disfavoured by our data.
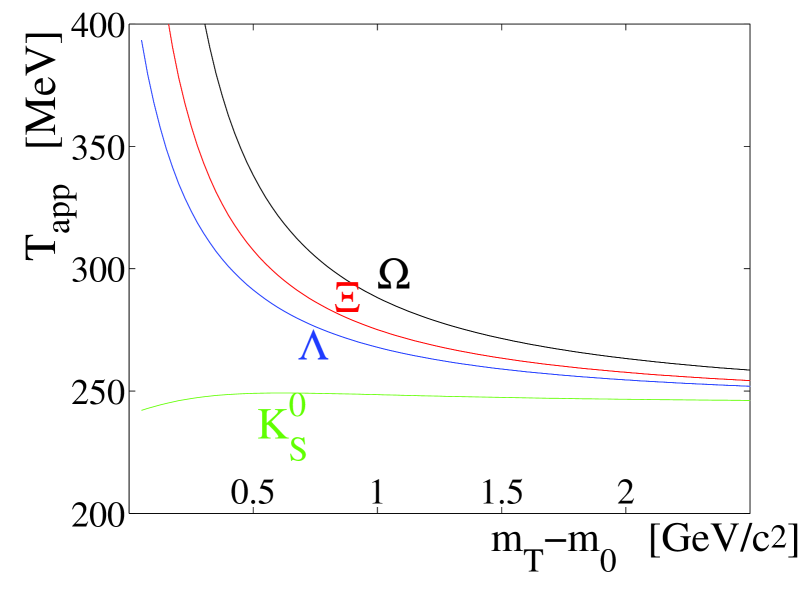
For sufficiently larger than the particle mass , the inverse slope is expected to be independent of [6]. In the non-relativistic regime () is expected to increase with the rest mass of the particle; e.g. in reference [34] it has been derived that : the larger the mass of the particle the more pronounced the flattening of the spectra at low . The deviations from exponential behaviour are larger for large flows and at low . Due to its light mass, the spectrum is predicted by the model, and indeed observed, to be steeper at low . Such behaviour is illustrated in figure 11 where we compute the “local” inverse slope, i.e. the inverse slope of the exponential function which is tangent to the blast-wave curve, as a function of . Pions, which in principle would be an even better probe for this behaviour, are unfortunately affected by resonance decays (at low ) which cannot be neglected [35, 36].
The particles have been divided into two groups — those which share valence quarks with the nucleons and those which do not — since it is known that the particles of the two groups may exhibit different production features. The fit procedure has been repeated separately for the two groups ( case) and the results are given in table 6.
| particles | (MeV) | |||
|---|---|---|---|---|
| , , | ||||
| , , , |
They suggest common freeze-out conditions for the two groups. Since the interaction cross-sections for the particles of the two groups are quite different, this finding would suggest limited importance of final state interactions (i.e. a rapid thermal freeze-out) and a similar production mechanism. A similar conclusion concerning the evolution of the system was reached from the study of the HBT correlation functions of negative pions [37, 38, 39].
It has been suggested [28], based on WA97 results on the hyperon
slopes compatible with those discussed in section 4, that the thermal
freeze-out occurs earlier for and possibly for than for
particles of strangeness , due to the low scattering cross-sections for and .
The 1 contours of the separate blast wave fits for singly
and multiply strange particles are shown in figure 12.
Both groups of particles are compatible
with the global-fit determination.
However, the fit for the multiply strange particles is statistically
dominated by the ; in fact the contour remains essentially unchanged when fitting the alone.
Therefore we can only conclude
that the undergoes a thermal freeze-out which is compatible with
that of and .
Due to the lower statistics of the ,
from its spectrum alone it was not possible to extract significant values
for the two freeze-out parameters, as can be done for the .
Any possible deviation of the from the observed common freeze-out undergone
by , and can only be inferred from the integrated information of the
spectrum, i.e. from its inverse slope.

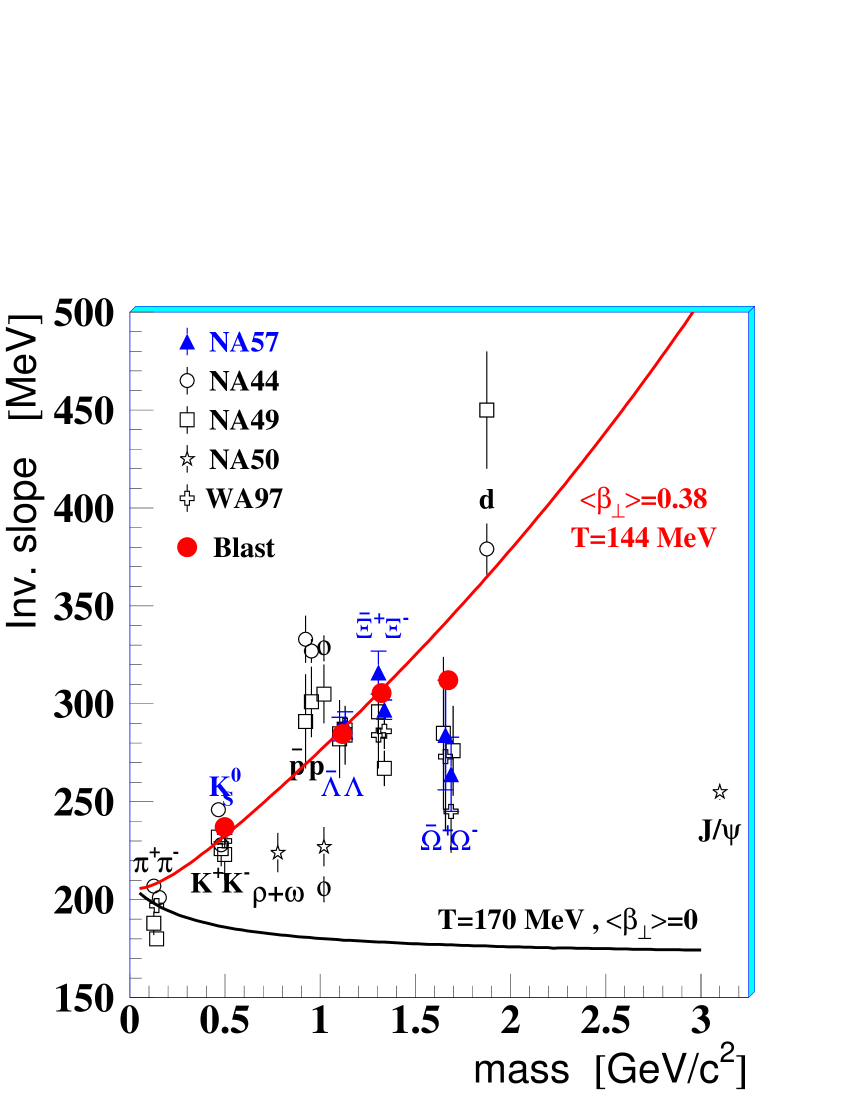
In figure 13 we plot the inverse slopes of figure 8 superimposing the blast-wave model results. The full lines represent the blast-wave calculations when fitting the spectrum of a particle, as a function of mass, in the common range GeV/, for two different freeze-out conditions: absence of transverse flow () and our best fit determination. The inverse slope is also a function of the range where the fit is performed. This dependence is stronger for heavier particles (see figure 11). Therefore we have also computed the blast-wave inverse slopes of , , and spectra in the ranges of NA57 (closed circles in figure 13). The measured inverse slopes of show a deviation from the global trend of the other strange particles.
5.2 Centrality dependence
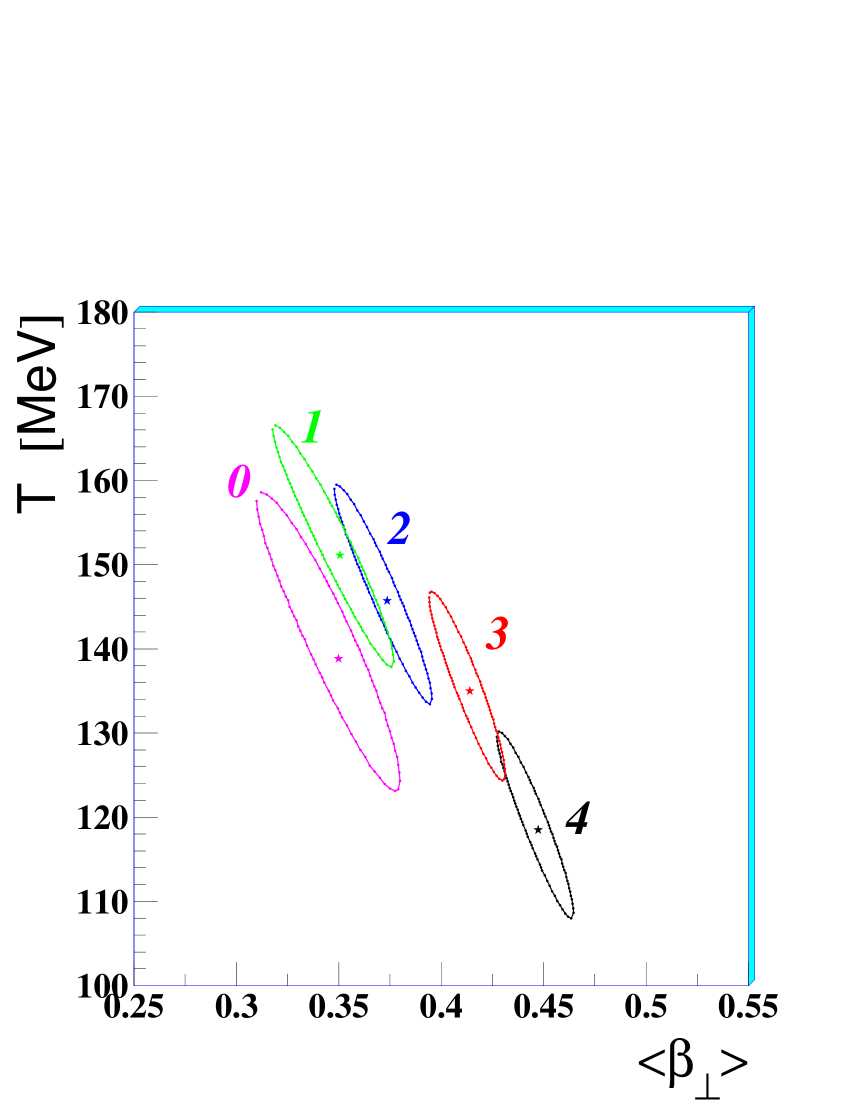
We have performed the global fit to the spectra for each of the five centrality classes defined in section 3. In figure 14 we show the confidence level contours in the – plane as obtained for the profile.
The numerical values of the fit parameters are given in table 7.
| Exp. | % | technique | (MeV) | |||
| NA57 | 40-53 | this analysis, | ||||
| NA57 | 23-40 | this analysis, | ||||
| NA57 | 11-23 | this analysis, | ||||
| NA57 | 4.5-11 | this analysis, | ||||
| NA57 | 0-4.5 | this analysis, | ||||
| NA49 | 0-5,10,20 | ,,,,, | ||||
| NA49 | 0-5,10,20 | ,,,,,, | ||||
| PHENIX | 60-92 | ,,,, | ||||
| PHENIX | 30-60 | ,,,, | ||||
| PHENIX | 15-30 | ,,,, | ||||
| PHENIX | 5-15 | ,,,, | ||||
| PHENIX | 0-5 | ,,,, | ||||
| STAR | 0-10 | , , | ||||
| STAR | 0-10 | ,,,, | ||||
| NA49 | 0-3 | HBT + + | ||||
| WA97 | 25-40 | HBT + | ||||
| WA97 | 12-25 | HBT + | ||||
| WA97 | 5-12 | HBT + | ||||
| WA97 | 0-5 | HBT + | ||||
| CERES | 15-30 | HBT | fixed at | |||
| CERES | 10-15 | HBT | fixed at | |||
| CERES | 5-10 | HBT | fixed at | |||
| CERES | 0-5 | HBT | fixed at |
The observed trend is as follows:
the more central the collisions the larger the transverse collective
flow and the lower the final thermal freeze-out temperature.
The higher freeze-out temperature for peripheral collisions may be interpreted
as the result of an earlier decoupling of the expanding system.
A similar centrality dependence of the freeze-out parameters has been observed
by the PHENIX experiment in Au-Au collisions
at GeV from the blast-wave analysis
of , , and spectra [40].
In particular,
PHENIX has measured222In the PHENIX analysis, statistical
and systematic errors are added in quadrature before the fit.
MeV, with for the most central 5% of the Au-Au cross-section and
MeV, with for peripheral collisions (30–60% centrality,
which corresponds roughly to the NA57 class 0).
For the same colliding system, the STAR experiment
has also determined [41] the thermal freeze-out for central
collisions (see table 7):
STAR results would suggest a rather earlier decoupling of
the multi-strange with respect to non strange and singly strange
particles at RHIC energy.
We also quote the result of our fit
for the most central class, when the profile is assumed: MeV,
and
.
This result is found to be consistent within two standard deviations
with that from a similar analysis performed by NA49333
The NA49 centrality ranges are 0-5% for and , 0-10%
for , and , 0-20% for .
assuming the constant profile hypothesis [32].
In table 7 we also make a comparison with results from
different measurements which exploit the dependence of the HBT correlation functions of negative pions [37, 38, 39].
The thermal freeze-out temperatures and transverse flow velocities are found to be in good
overall agreement with those extracted from the blast-wave fits.
6 Conclusions
We have analysed the transverse mass spectra of high statistics, high purity samples of , , and particles produced in Pb-Pb collisions at 158 GeV/ over a wide range of collision centrality (the most central 53% of the Pb-Pb inelastic cross-section).
The inverse slopes agree with those measured by WA97. For each hyperon species, the slope is found to be in good agreement with that of the antiparticle. An increase of the inverse slopes with the collision centrality is observed for and .
The analysis of the transverse mass spectra at 158 GeV/ in the framework of the blast-wave model suggests that after a central collision the system expands explosively; the system then freezes-out when the temperature is of the order of 120 MeV with an average transverse flow velocity of about one half of the speed of light. Particles with and without valence quarks in common with the nucleon appear to have a similar behaviour. The inverse slope of the particle deviates from the prediction of the blast-wave model tuned on the other strange particles (, and ). Thermal freeze-out conditions (i.e. temperature and transverse flow velocity) are found to be similar to those measured at RHIC energy for singly strange and non strange particles, in both central and peripheral collisions; conversely the temperature measured for the multiply strange is significantly larger at RHIC. Finally, the results on the centrality dependence of the expansion dynamics indicate that with increasing centrality the transverse flow velocity increases and the final temperature decreases.
References
References
- [1] Cabibbo N and Parisi G 1975 Phys. Lett.B 59 67
- [2] Andersen E et al. 1999 Phys. Lett.B 449 401 Antinori F et al. 1999 Nucl. Phys.A 661 130c
- [3] Rafelski J and Müller B 1982 Phys. Rev. Lett.48 1066 Rafelski J and Müller B 1986 Phys. Rev. Lett.56 2334
- [4] Caliandro R et al., NA57 proposal, 1996 CERN/SPSLC 96-40, SPSLC/P300
- [5] Schnedermann E, Sollfrank J and Heinz U 1993 Phys. Rev.C 48 2462
- [6] Schnedermann E, Sollfrank J and Heinz U 1994 Phys. Rev.C 50 1675
- [7] Torrieri G and Rafelski J 2004 J. Phys. G: Nucl. Phys.30 s557 Torrieri G and Rafelski J 2002 Preprint nucl-th/0212091
- [8] Manzari V et al. 1999 J. Phys. G: Nucl. Phys.25 473 Manzari V et al. 1999 Nucl. Phys.A 661 761c
- [9] Andersen E et al. 1998 Phys. Lett.B 433 209 Lietava R et al. 1999 J. Phys. G: Nucl. Phys.25 181 Fini R A et al. 2001 J. Phys. G: Nucl. Phys.27 375
- [10] Hagiwara K et al. 2002 Phys. Rev.D 66 010001
- [11] Bruno G E et al. 2002 Proceeding of the Rencontres de Moriond, Preprint hep-ex/0207047 Bruno G E 2002 Ph.D. Thesis, University of Bari (Preprint nucl-ex/0402014)
- [12] GEANT, CERN Program Library Long Writeup W5013
- [13] Fanebust K et al. 2002 J. Phys. G: Nucl. Phys.28 160
- [14] Carrer N et al. 2001 J. Phys. G: Nucl. Phys.27 391
- [15] Antinori F et al. 2000 Eur. Phys. J. C 14 633
- [16] Afanasiev S V et al. 2002 Phys. Rev.C 66 054902
- [17] Margetis S et al. 1999 J. Phys. G: Nucl. Phys.25 189
- [18] Afanasiev S V et al. 1996 Nucl. Phys.A 610 188
- [19] Afanasiev S V et al. 2000 Phys. Lett.B 491 59
- [20] Alber T et al. 1997 J. Phys. G: Nucl. Phys.23 1817
- [21] Afanasiev S V et al. 2002 Phys. Lett.B 538 275
- [22] Mitrovski M et al. 2004 J. Phys. G: Nucl. Phys.30 s357
- [23] Afanasiev S V et al. 2000 Phys. Lett.B 486 22
- [24] Bearden I G et al. 2002 Phys. Rev.C 66 044907
- [25] Bearden I G et al. 2002 Eur. Phys. J. C 23 237
- [26] Abreu M C et al. 2001 Phys. Lett.B 499 85
- [27] Quintans C et al. 2001 J. Phys. G: Nucl. Phys.27 405
- [28] van Hecke H, Sorge H and Xu N 1998 Phys. Rev. Lett.81 5764
- [29] Fini R A et al. 2001 Nucl. Phys.A 681 141c
- [30] Esumi S, Chapman S, van Hecke H and Xu N 1997 Phys. Rev. C 55 2163
- [31] Bruno G E 2002 Ph.D. Thesis, University of Bari (Preprint nucl-ex/0402014) Bruno G E et al. 2003 Proceeding of the Rencontres de Moriond, Preprint nucl-ex/0305033 Šándor L et al. 2004 J. Phys. G: Nucl. Phys.30 s129
- [32] Van Leeuwen M et al. 2003 Nucl. Phys.A 715 165 Friese V et al. 2004 J. Phys. G: Nucl. Phys.30 s119
- [33] Wiedemann U A, 2003 private communication
- [34] Lee K S, Heinz U and Schnedermann E 1990 Z. Phys.C 48 525 Csörgő T and Lorstad B 1996 Phys. Rev.C 54 1390
- [35] Sollfrank J, Koch P and Heinz U 1990 Phys. Lett.252 256
- [36] Tomášik B, Wiedemann U A and Heinz U 2003 Heavy Ion Physics 105
- [37] Appelshäuser H et al. 1998 Eur. Phys. J. C 2 661
- [38] Antinori F et al. 2001 J. Phys. G: Nucl. Phys.27 2325
- [39] Adamová et al. 2003 Nucl. Phys.A 714 124
- [40] Adcox K et al. 2003, Preprint nucl-ex/0307010, submitted to Phys. Rev.C
- [41] Adams J et al. 2003, Preprint nucl-ex/0307024, submitted to Phys. Rev. Lett.Castillo J et al. 2004, J. Phys. G: Nucl. Phys.30 s181