In-medium minijet dissipation in Au+Au collisions at = 130 and 200 GeV studied with charge-independent two-particle number fluctuations and correlations.
Abstract
Medium effects on charged-particle production from minijets are studied using three complementary analysis techniques. We find significant angular collinearity and number correlations on even at moderate GeV/. In this range abundant particle multiplicities enable precision measurements of number correlations of non-identified hadrons for kinematic variables (,,). Methods include (1) direct construction of two-particle correlation functions, (2) inversion of the bin-size dependence of non-statistical multiplicity fluctuations and (3) two-dimensional discrete wavelet analysis.
Two-particle correlations on exceed expectations from a model of equilibrated events with fluctuating global temperature. A correlation excess at higher is interpreted as final-state remnants of initial-state semi-hard collisions. Lower- correlations exhibit a saddle structure varying strongly with centrality. Variations in the forms and relative strengths of low and high correlations with increasing centrality suggest transport of semi-hard collision products into the lower region as a manifestation of in-medium dissipation of minijets.
Correlations on can be associated with angular correlations on (,), using analysis methods (1), (2) or (3). In particular, wavelet analysis (3) is performed in the (,) space in bins of ( GeV/). Observed angular correlation structures include those attributed to quantum correlations and elliptic flow, as well as a localized structure, increasing in amplitude with , and presumed to originate with minijets. That structure evolves with increasing centrality in a way which also suggests dissipation, including an increased correlation length on which may be related to the influence of a longitudinally expanding medium on minijet fragmentation.
pacs:
25.75.-qThis note documents experimental observations of medium-modified minijet correlation structures in AuAu collisions at RHIC, presented at a poster session of the Quark Matter 2004 conference. The data come from three distinct analyses which address the same physics topic – quantitative diagnostic of the strong interaction medium created at RHIC. The intrinsic properties of this medium in equilibrium are connected with its observable response to the excitations FDT , experienced in the course of heavy ion collision events due to minijet propagation. In this work we analyze the response on the basis of dynamical information contained in fluctuations and correlations in the number density of non-identified hadrons in the space of kinematic variables , and .
A direct construction of two-particle correlations in has been performed on GeV data. The basic object of this analysis is density of pairs in the two-dimensional space spanned by the of the two particles. To make statistical errors more uniform along the kinematic variable of choice, we replace by . Density of sibling pairs (coming from the same event) is compared with a mixed pair reference .
The physics of small momentum differences is known to be dominated by quantum statistical and Coulomb effects. To focus on the physics of large momentum differences (also referred to as large scale), we eliminate sibling and mixed pairs which simultaneously satisfy conditions , , GeV/c while having a particle with GeV/c. The result in form of a differential density ratio is shown in Fig. 1 for four centrality classes.
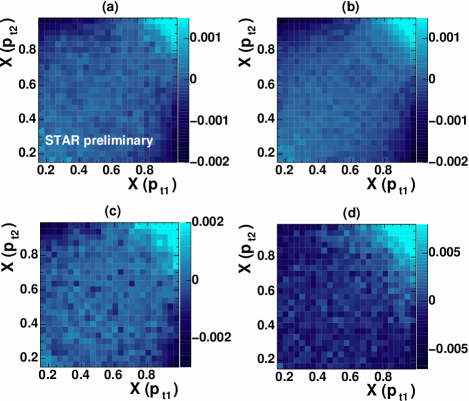
Typical magnitudes of vary with multiplicity as , but there are more subtle shape changes among the panels of that figure. To quantify those, we form a fitting model based on a Lévy distribution . Here the exponent provides a parameter responsible for “equilibration”, being the Boltzmann limit. It is informative to use the sum and difference variables and ; the ratios in Fig. 1 are concave along and convex along . For the mixed pairs, the assumed factorization of two Lévy distributions results in
| (1) |
For the sibling pairs, the fitting model is as in Eq. 1, except that in the first and second term is replaced by, respectively, and . Curvatures of at the origin are along and along , and have different signs.
The strength of the saddle shape is quantified in terms of the two curvatures:
| (2) |
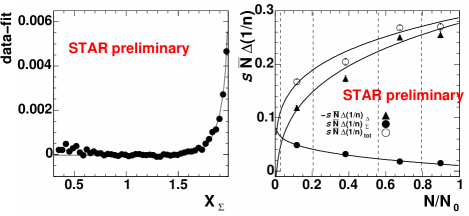
Thus, the correlation structure is decomposed into saddle shape (dissipation) and hard component (high peak). With centrality, the ”dissipation” grows with a linear trend on the mean path length, as seen in the right panel of Fig. 2.
Constructing number correlations directly becomes inefficient when the number of events and multiplicities are large, since number of computations scales with the number of particles as . To analyze the GeV data sample, we use fluctuation analyses of computational complexity .
In the basis of Fourier harmonics, Wiener-Khinchin theorem relates autocorrelation with the local fluctuation power spectrum via Fourier transform. Relations between quantities characterizing fluctuations and correlations can be also obtained in the basis of box functions (bins). or in a discrete wavelet basis.
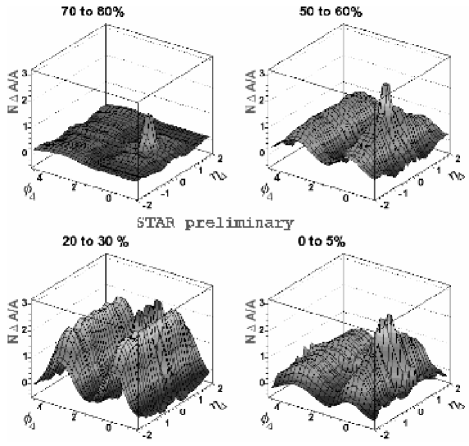
The inversion of the bin size dependence of the number fluctuations is performed to express the results of the fluctuation analysis as a two-point autocorrelation (an quantity). Relation between number fluctuation in a bin and net autocorrelation is
| (3) |
where is autocorrelation, is kernel which depends on the binning used, and are acceptance ranges, and , are difference variables. This integral equation is solved using standard techniques for inverse problems to yield the normalized net autocorrelation shown in Fig. 3. Flow structure underlies a same-side minijet peak broadened on with increasing centrality.
Application of the DWT power spectrum analysis technique in STAR is described in detail in DWT_2002 . The measure of local point-to-point fluctuation is the fluctuation power , constructed out of the DWT expansion coefficients WAILI in the () space, , where indexes the three possible directional sensitivity modes, pseudorapidity , azimuth , and diagonal .
| (4) |
The basic measure of correlation structure is the so-called normalized dynamic texture, , which incorporates the mixed event reference. Here is a number of particles in an event or subevent being analyzed. In case of a one-dimensional random field such as a stationary time series, the relationship between this and an autocorrelation is:
| (5) |
where , and is the kernel function, localized and symmetric around 0, which depends only on the wavelet. For the Haar wavelet which we use, it is positive around 0 and turns negative away from 0, therefore one can think of as a derivative of an autocorrelation over scale (or ), averaged over an event sample.
Centrality in the analysis is characterized by the accepted number of quality tracks in the TPC, , relative to , where is such that 99% of minimum bias events have .
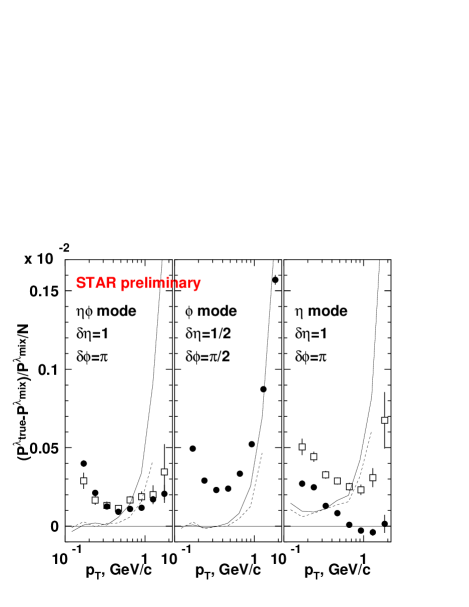
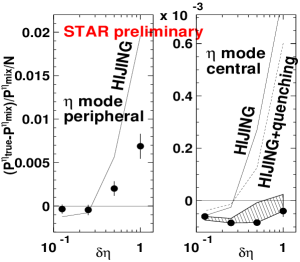
Fig. 4 shows a difference between dynamic texture data for central AuAu events and various expectations. In the experiment, we see a change in the trend above GeV in the mode. Instead of rising with (as in the peripheral events), the STAR data points become negative. This contradicts HIJING HIJING , including the “quenching” mode. In HIJING, the rise of the signal with is obtained by “turning on” jets. To make a comparison between central and peripheral data, bypassing the model, we formulate a “null hypothesis”: the correlation structure in Au+Au collisions is invariant of centrality. Then, the difference in between central and peripheral events (including the trends) is due to the difference in (and in )
Shown in Fig. 4 as is the peripheral data from STAR, rescaled under an assumption of the “null hypothesis”, taking the difference in into account. In the mode it is visible that the actual and rescaled data sets differ in both magnitude and trend. This underscores the difference of correlation structures between central and peripheral events and invalidates the “null hypothesis” of the scaling. The left panel shows that jet-like behavior persists almost unaffected by centrality in the mode.
We hypothesize that we are observing a modification of the minijet structure predominantly in the longitudinal, direction. Longitudinal expansion of the hot and dense medium formed early in the collision makes this direction special and is likely to be part of the modification mechanism. If so, we may be observing an effect of the longitudinally expanding medium on the minijet fragmentation and/or hadronization at “soft” .
Fig. 5 shows the scale dependence of the correlation structure in a range where the centrality effect is most pronounced. We see that the modification of the structure does not imply disappearance of the correlations in the central events, even on the fine scales. Thermalization, while affecting the correlations (more than the popular model HIJING predicts), does not result in a correlation-free system in central events, at least as seen by measuring final state hadrons.
We conclude that large multiplicities of hadrons in the STAR acceptance enable precision studies of the event correlation structure. Our observations are consistent with an emerging picture: minijets from initial state scattering are modified by longitudinally expanding colored medium. These measurments of the effect of the medium on the parton fragmentation and hadronization provide quantitative information about the medium and nonperturbative QCD.
References
- (1) R. Kubo, Rep. Progr. Phys. 29 (1966) 255-284
- (2) M. L. Kopytine for the STAR Collaboration, arXiv:nucl-ex/0211015.
- (3) WAILI software is used to obtain the expansion coefficients. G. Uytterhoeven et al., WAILI: Wavelets with Integer Lifting. TW Report 262, Department of Computer Science, Katholieke Universiteit Leuven, Belgium, July 1997.
- (4) X. N. Wang and M. Gyulassy, Phys. Rev. D 44, 3501 (1991). M. Gyulassy and X. N. Wang, Comput. Phys. Commun. 83, 307 (1994)