Anisotropic flow in the forward directions at GeV
Abstract
The addition of the two Forward TPCs to the STAR detector allows one to measure anisotropic flow at forward pseudorapidities. This made possible the first measurement of directed flow at collision energies of GeV. PHOBOS’ results on elliptic flow at forward rapidities were confirmed, and the sign of was determined to be positive for the first time at RHIC energies. The higher harmonic, , is consistent with the recently suggested scaling behavior.
This write-up contains results presented as a poster poster at the Quark Matter conference in Oakland, California in January 2004.
pacs:
25.75.LdI Introduction
In non-central heavy-ion collisions the initial spatial anisotropy of the collision region translates into a final state anisotropy in momentum space. In a hydrodynamical picture this is believed to be due to pressure gradients in the dense medium which lead to collective motion — so called transverse flow — of the generated particles.
The simplest way of characterizing these final state anisotropies is to perform a Fourier decomposition on the particle’s emission angles with respect to the reaction plane vol . The reaction plane is given by the incident beam direction and the impact parameter and it is experimentally not known a priori. It has to be estimated for every event by looking at the anisotropy of particle emission itself fourier . This leads to a finite resolution of the measured event plane which one has to correct for.
Spurious contributions to the measured transverse flow signal are particle correlations due to non-flow effects (e. g. resonance decays). To cope with these, several new methods of the anisotopic flow analysis, based either on cumulants BDO1 ; BDO2 or on Lee-Yang zeros LeeYangZeros , have been proposed.
II Experimental setup
The two Forward TPCs (FTPCs Ftpc ) of the STAR experiment STAR extend the pseudorapidity coverage of STAR into the region . The pseudorapidity resolution of these radial drift chambers is better than 5% for their full acceptance. During RHIC run 2 about 70 thousand Au+Au collisions at a center of mass energy of GeV were taken with both FTPCs and the STAR TPC Tpc .
III Measurements
III.1 Directed Flow
The first measurement of directed flow at RHIC energies was recently published v1v4Paper (see Fig. 1). It showed that while is close to zero at mid-rapidities, the signal rises to a couple of percent near pseudorapidity .
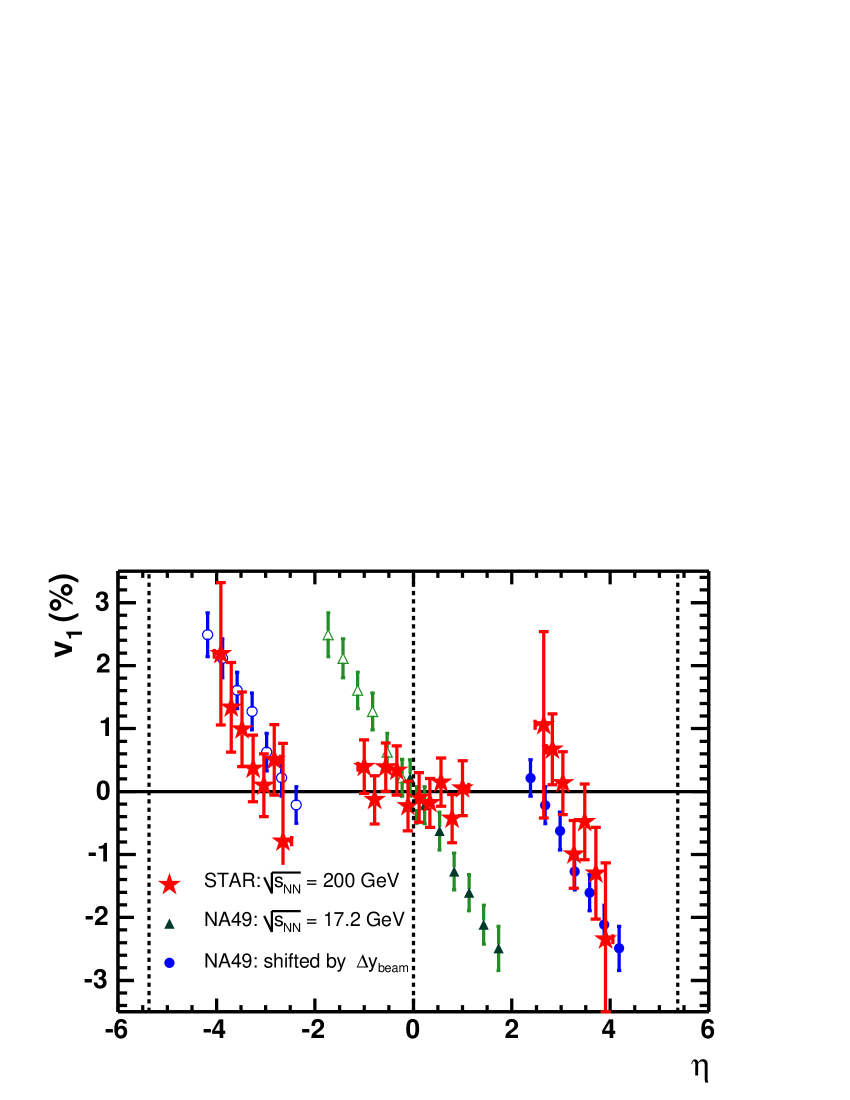
It was noted that our measurement greatly differs from the NA49 results NA49Paper at lower beam energies of GeV. But if the NA49 data are shifted and both measurements are seen in the projectile frame, they look similar.
III.2 Elliptic flow
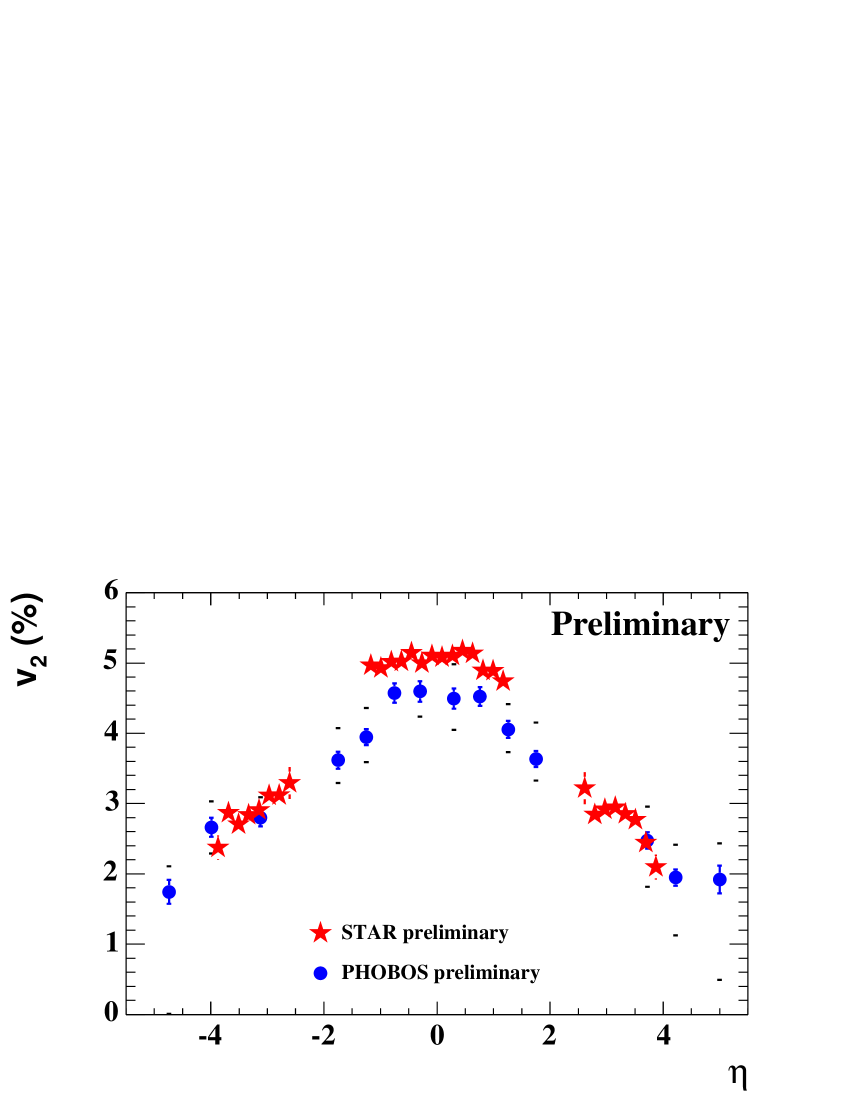
The comparison of our new measurement on elliptic flow at forward pseudorapidities confirms the published result Phobosv2 obtained by the PHOBOS collaboration (see Fig. 2) at high . We observe a similar fall-off by a factor of 1.8 comparing with . Both measurements were done using the event plane method.
If we compare our results for obtained with the method of two-particle cumulants, , to the four-particle cumulants, , we observe almost no difference in the FTPC region, while the two-particle cumulant measurement gives a 15% higher signal in the TPC. Since four-particle cumulants are much less prone to non-flow contributions we conclude that non-flow effects are less strong in the forward regions.
III.3 A new method to measure directed flow
From the above measurements it became clear that the STAR TPC sitting at mid-rapidity has very good capabilities to measure elliptic flow, while the Forward TPCs allow to measure directed flow (which appears to be close to zero at mid-rapidities).
III.3.1
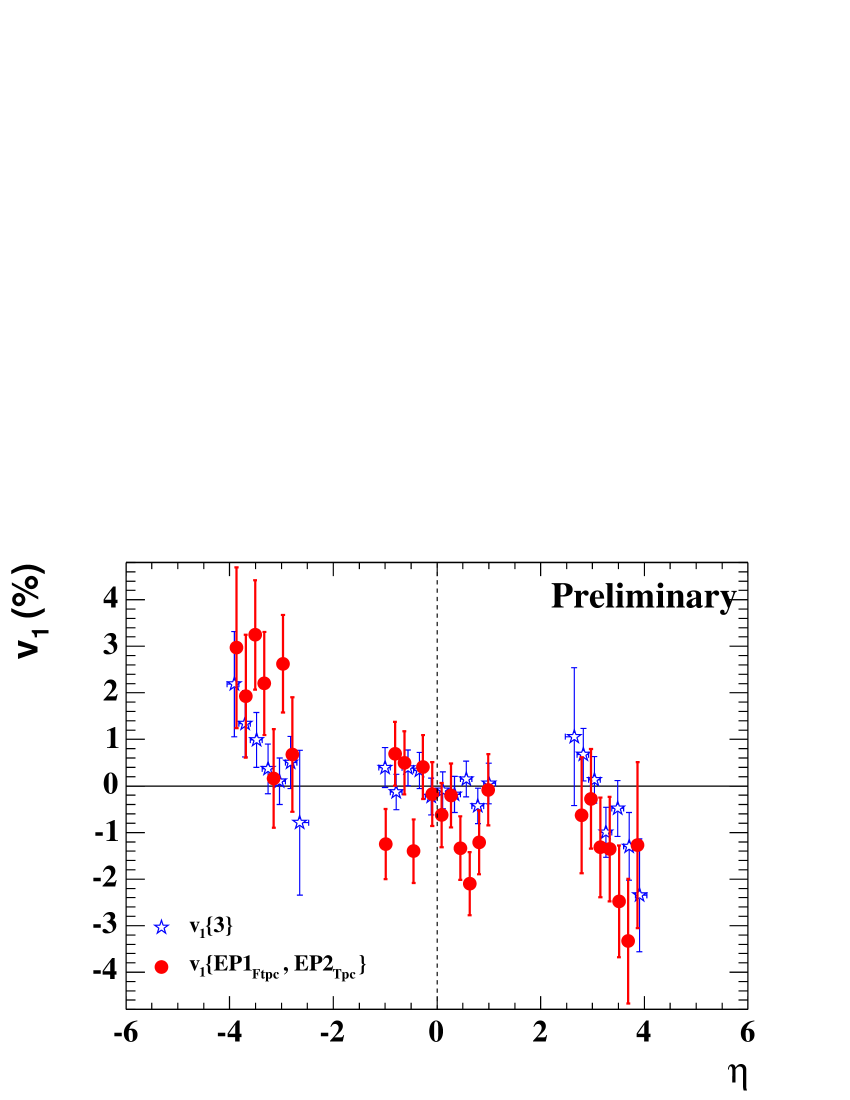
In order to utilize the method of Fourier decomposition but to reduce non-flow contributions at the same time, we measured with respect to the first and second order reaction plane and , where was determined in the FTPCs while was measured in the TPC. Within the recently proposed notation (see v1v4Paper ) we denote this measurement as .
| (1) | |||
As shown in Fig. 3, the results are in reasonable agreement with the published measurement obtained by the three-particle cumulant method .
III.3.2 The sign of
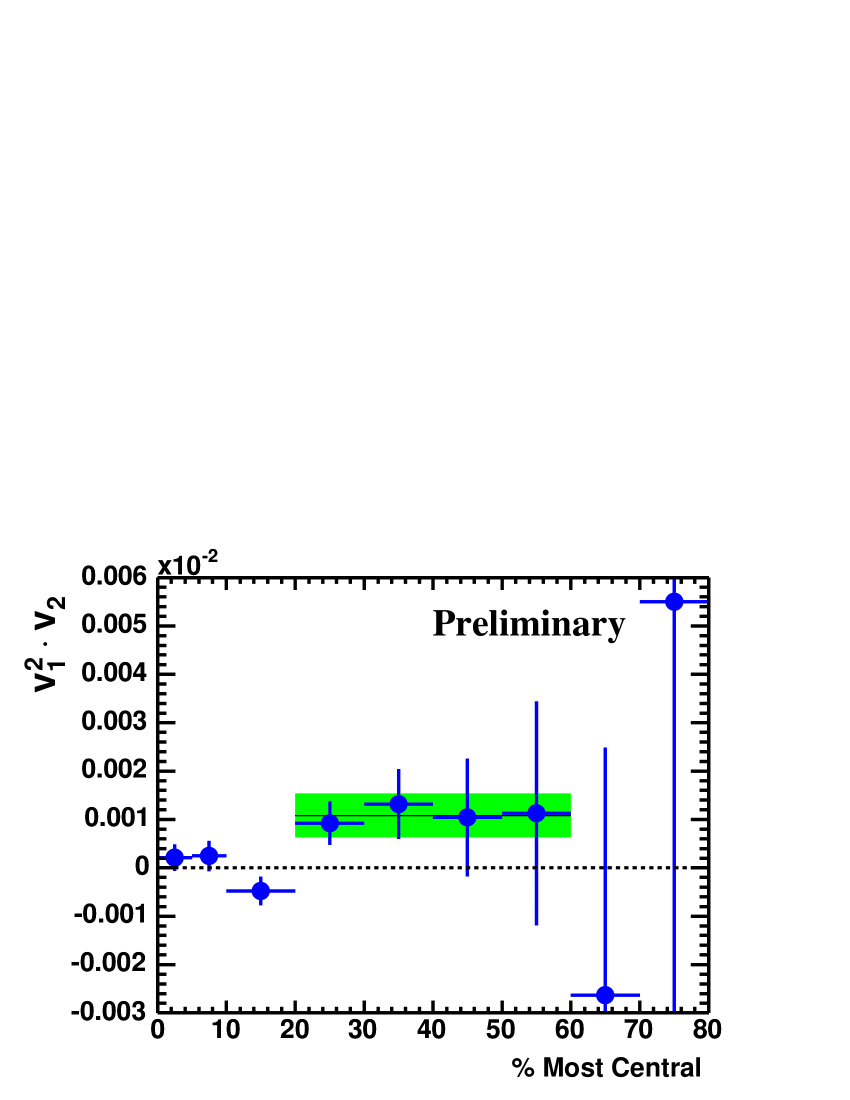
This new method provides an elegant tool to measure the sign of , which was assumed to be positive but had not yet been determined at RHIC energies. One of the quantities involved in the measurement of is approximately equal to the product of integrated values of and :
| (2) |
where , , and denote the multiplicities for a given centrality bin in the two FTPCs and the TPC, respectively. Since is always positive, the sign of determines the sign of .
Averaged over centralities 20–60% we measure in Fig. 4 to be . In this region the expected non-flow contributions are much smaller than for the most central and peripheral centrality bins. Therefore the sign of is determined to be positive: In-plane elliptic flow is confirmed. (This stated value for and its uncertainty is based on an approximation that does not affect the statistical significance of the conclusion that is in-plane.)
III.4 The fourth harmonic
Since elliptic flow is strong, the second order reaction plane can be estimated with high precision at RHIC energies. This makes the study of higher order flow feasible v1v4Paper .
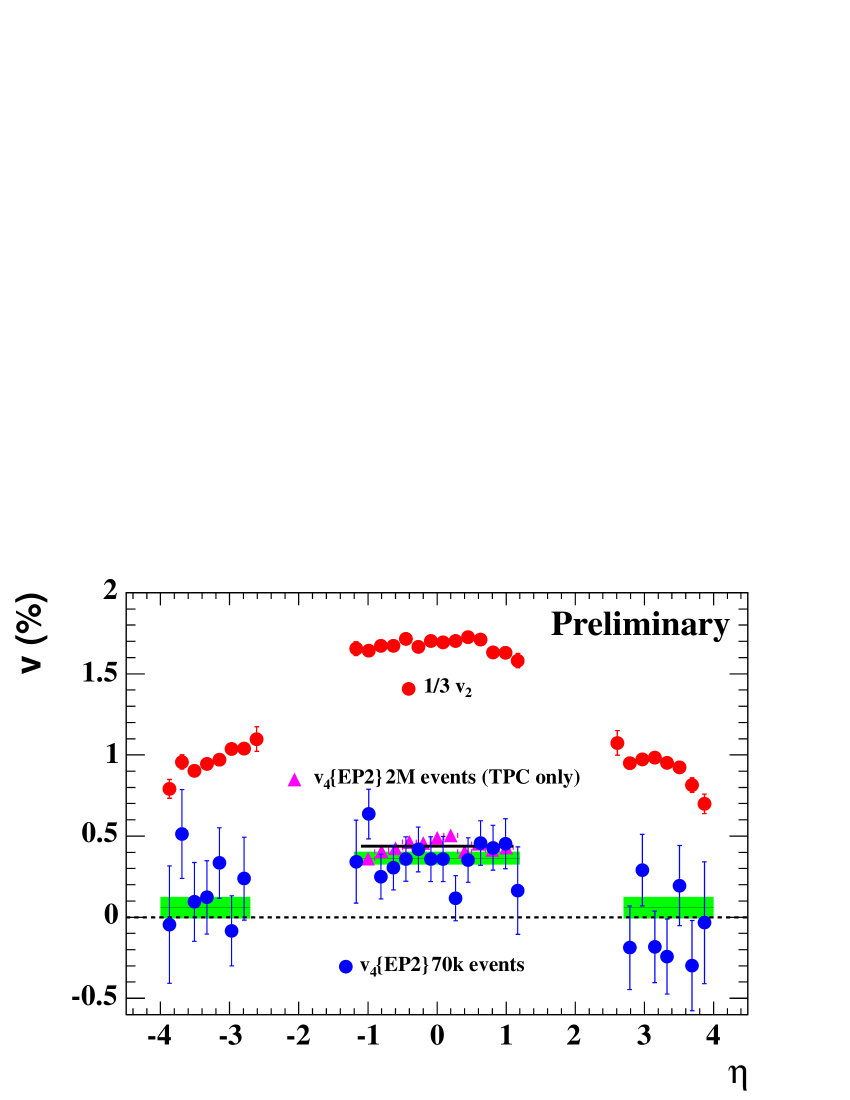
The fourth harmonic shows an average value of in pseudorapidity coverage of the TPC (), see Fig. 5. In contrast, its value of in the forward regions is consistent with zero and we place a upper limit of 0.2%. Therefore the fall-off of from mid-rapidities to forward rapidities appears to be stronger than for . This behavior is consistent with scaling like .
IV Future developments
First attempts to make use of the newly proposed method LeeYangZeros utilizing Lee-Yang zeros are encouraging. This method eliminates higher order non-flow contributions by construction. It is mathematically equivalent to the all-particle cumulant method which takes into account all higher order non-flow effects. The great advantage of the new method is its simplicity and speed compared to the evaluation of the cumulants.
The upcoming RHIC run 4 will greatly enhance our data sample. With it we will reduce our statistical uncertainties in the forward pseudorapiditiy region significantly.
Acknowledgements.
We thank the RHIC Operations Group and RCF at BNL, and the NERSC Center at LBNL for their support. This work was supported in part by the HENP Divisions of the Office of Science of the U.S. DOE; the U.S. NSF; the BMBF of Germany; IN2P3, RA, RPL, and EMN of France; EPSRC of the United Kingdom; FAPESP of Brazil; the Russian Ministry of Science and Technology; the Ministry of Education and the NNSFC of China; Grant Agency of the Czech Republic, FOM and UU of the Netherlands, DAE, DST, and CSIR of the Government of India; the Swiss NSF.References
-
(1)
see http://www.star.bnl.gov/STAR/central/
presentations/2004/qm2004/Oldenburg_Markus.pdf - (2) S. A. Voloshin and Y. Zhang, Z. Phys. C 70, 665 (1996).
- (3) A. M. Poskanzer and S. A. Voloshin, Phys. Rev. C58, 1671 (1998).
- (4) N. Borghini, P. M. Dinh, and J.-Y. Ollitrault, Phys. Rev. C64, 054901 (2001).
- (5) N. Borghini, P. M. Dinh, and J.-Y. Ollitrault, Phys. Rev. C66, 014905 (2002).
- (6) R. S. Bhalerao, N. Borghini, J.-Y. Ollitrault, Nucl. Phys. A 727, 373 (2003).
- (7) K. H. Ackermann , Nucl. Instrum. Meth. A 499, 713 (2003).
- (8) K. H. Ackermann , Nucl. Instrum. Meth. A 499, 624 (2003).
- (9) M. Anderson , Nucl. Instrum. Meth. A 499, 659 (2003).
- (10) J. Adams , Phys. Rev. Lett. 92, 062301 (2004).
- (11) NA49 Collaboration, C. Alt , Phys. Rev. C68, 034903 (2003).
- (12) S. Manly for the PHOBOS Collaboration, Nucl. Phys. A 715, 611c (2003).