Measurement of the decay width of He
Abstract
We have precisely measured decay width of He and demonstrated significantly larger - overlap than expected from the central repulsion - potential, which is derived from YNG -nucleon interaction.
1 Introduction
It is known that hypernuclei mainly decay via mesonic decay(, ) or non-mesonic decay(, ). Mesonic decay releases only some 40 MeV energy and undergoes Pauli suppression by the existence of other nucleons. Thus the mesonic decay rate is sensitive to the overlap of wave function with nucleus, and reflects nucleus- potential shape.
Motoba et al. constructed a single particle potential in He employing realistic interaction “YNG” with folding procedure.[1] This potential is characterized by a repulsive core, which has the effect to push wave function toward the outside of nucleus and leads to an enhancement of the mesonic decay rate by the relaxation of Pauli suppression. They calculated mesonic decay rate of He with the wave function as an initial state, and compared it to the one derived from one-range Gaussian interaction “ORG”. The decay width showed about 30% difference: , , where denotes total decay width of free . Kumagai-Fuse et al. also performed the same kind of calculation and reported similar results for He.[2] However, existing experimental data, , has large error and cannot distinguish above two potentials.[3] It should be noted that both of the interactions are determined to reproduce binding energy of He, and could not be distinguished without measuring the difference in the mesonic decay rate. Therefore, precise measurement of pionic decay rate is important to check the validity of the YNG interaction.
The decay width is obtained by dividing the branching ratio by the lifetime. Thus, both of these observables need to be measured with high precision.
2 Experiment and analysis
The experiment was performed using K6 beam line of KEK 12 GeV proton synchrotron. 6Li target was bombarded with 1.05 GeV/c beam and He hypernucleus were produced via Li, reaction. The incoming pion and outgoing kaon momenta were measured by means of magnetic spectrometers and missing mass was reconstructed. A couple of detector system was installed around the target so as to measure trajectories and velocities of hypernuclear decay products. The decay counter comprises 4 mm-thick plastic scintillators named T2, 2 cm-thick ones named T3, six layers of 5 cm-thick ones named T4, and a drift chamber placed between T2 and T3.
decay branching ratio
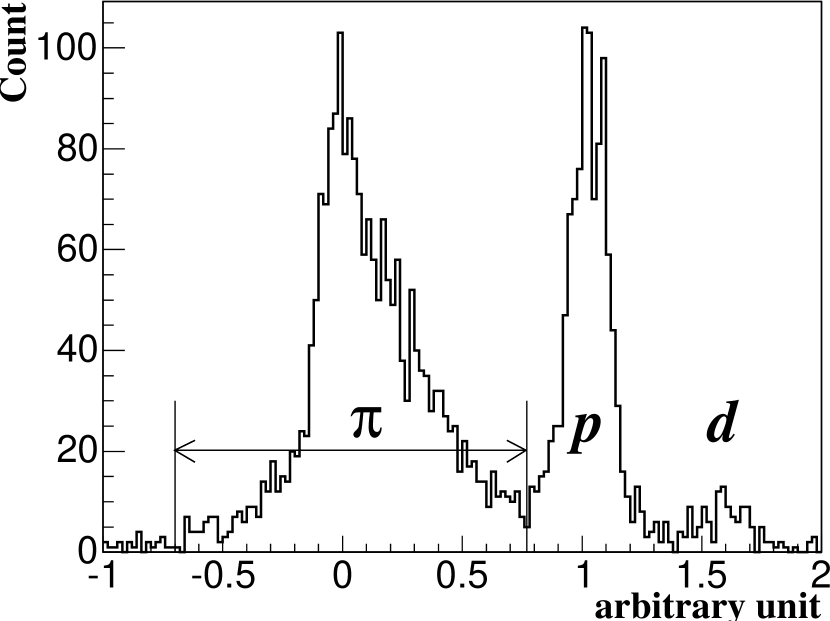
Figure 2 shows PID function of charged particles emitted from the decay of He, which is derived from particle velocity, and total energy deposit in sequentially fired scintillators. A tail on positive side of the pion peak is attributed to an extra energy deposit caused by nuclear pion absorption.
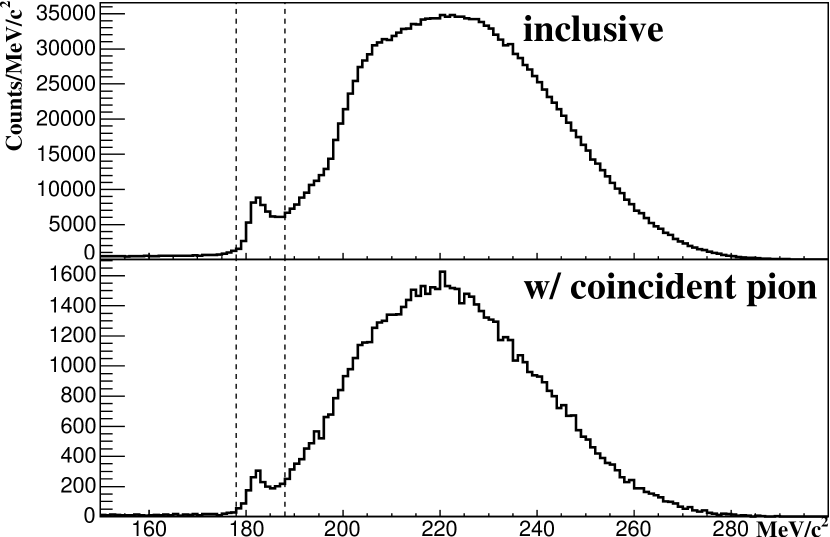
Figure 2 shows the excitation spectra of 6Li reaction. Hypernuclear formation events were successfully separated as a peak structure in both (up) inclusive and (down) pion coincidence spectra. The region between dotted lines represents the events accepted as He production. Use of reaction enabled low background hypernuclear spectroscopy, while the previous measurement using reaction suffers serious background from beam kaon decay and could not avoid large ambiguity in determination of emission ratio.
We cannot well identify such decay particles as have large angles against vertical axis and pass through side of T4 array without losing whole kinetic energy. Our analysis required two(three) segments at the center of T2(T3) counter to be fired so as to avoid such ambiguity and accurately determine pion detection efficiency.
Electrons created by decay followed by electro-magnetic shower cannot be distinguished from pion. The electron contamination rate was evaluated by Monte Carlo method using GEANT and effectively subtracted.[5]
The pion emission rate is stable when the hypernuclear mass gate is narrowed, which confirms that contamination with higher excited states is negligible.
decay branching ratio was determined to be (statistical error only).
Lifetime
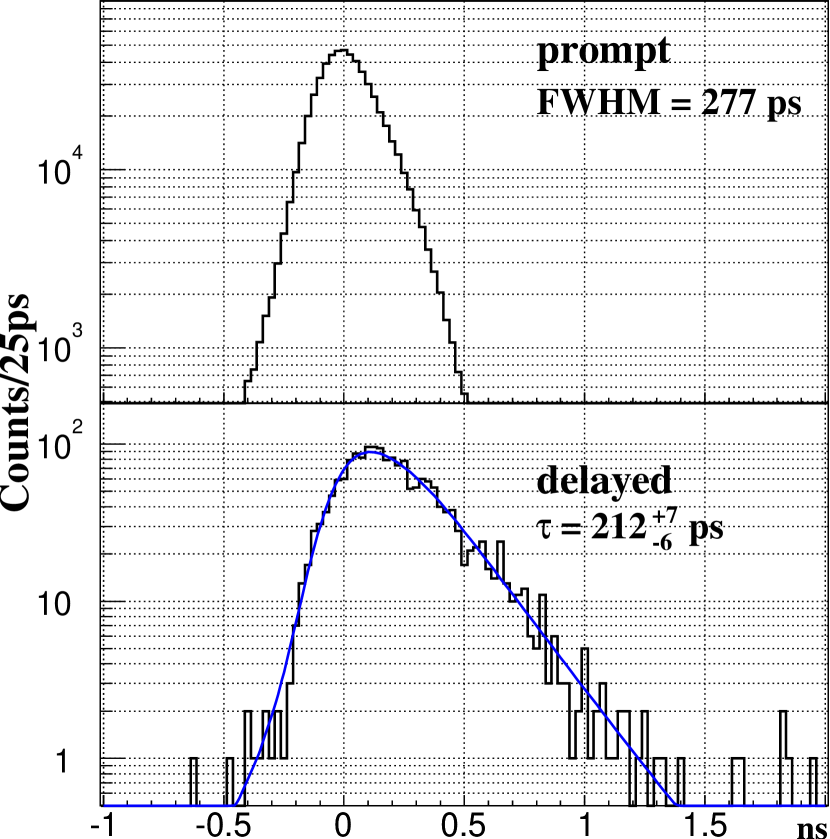
The hypernuclear decay time was directly measured as , where was the time when the decay particles reached T2 counter, is flight length of the decay particles from target to T2 counter, is velocity of the decay particles, is flight length of beam pion from T1 counter to target, is velocity of beam pion, and is beam injection time at T1 counter. The lifetime was derived by fitting the decay time spectrum by exponential function convoluted with time response function of the detector system, which is obtained as spectrum for prompt reaction caused via strong interaction.[4] events, which means that a scattered proton was detected by SKS and another proton was detected by the decay counter, were simultaneously collected for this purpose and fluctuation of the time response function was corrected every two hours during data acquisition. Figure 3(right) shows prompt(up) and delayed(down) time spectra. With above procedure, lifetime of He was determined to be ps.
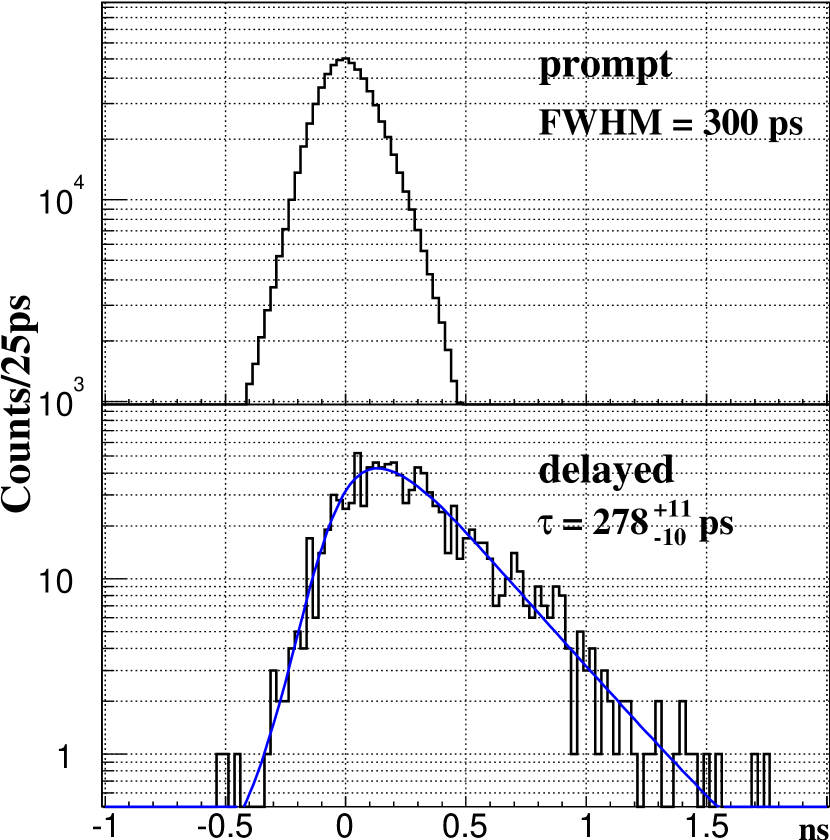
Lifetime of C was also measured as ps, whose value is twice more accurate over the previous measurement.[4] See Figure 3(left) for the fitting of C lifetime.
3 Results and discussion
The total decay width and decay width of He obtained were and , respectively.
Table 1 compares the present experiment with previous one[3] and the theoretical calculation based on ORG/YNG - potential. One can see that data accuracies were drastically improved although further careful check for systematic error is remained to be done. Our measurement shows that decay width is considerably smaller than the theoretical prediction using YNG interaction. This suggests that new - potential such as gives larger overlap between and nucleus need to be considered.
References
- [1] T. Motoba et al., Nucl. Phys. A534, 597 (1994).
- [2] I. Kumagai-Fuse et al., Phys. Lett. B345, 386 (1995).
- [3] J. J. Szymanski et al., Phys. Rev. C43, 849 (1991).
- [4] H. Park et al., Phys. Rev. C61, 054004 (2000).
- [5] CERN Program Library, GEANT.