Low Energy Analyzing Powers in Pion-Proton Elastic Scattering
Abstract
Analyzing powers of pion-proton elastic scattering have been measured at PSI with the Low Energy Pion Spectrometer LEPS as well as a novel polarized scintillator target. Angular distributions between 40 and 120 deg (c.m.) were taken at 45.2, 51.2, 57.2, 68.5, 77.2, and 87.2 MeV incoming pion kinetic energy for scattering, and at 67.3 and 87.2 MeV for scattering. These new measurements constitute a substantial extension of the polarization data base at low energies. Predictions from phase shift analyses are compared with the experimental results, and deviations are observed at low energies.
keywords:
pion proton scattering; active polarized target; sigma termPACS:
13.75.Gx , 24.70.+s , 25.80.Dj, , , , , , , , , , , , , , , , , , ,
1 Motivation
Important quantities of the strong interaction can be extracted from observables: the NN coupling constant, the sigma term of the proton, and the size of isospin breaking. Currently, there is no agreement on the value of any of these quantities [1].
Recent values of the sigma term, extracted from elastic pion-proton scattering, are substantially higher than the classical value [2] based on the KH80 phase shift analysis [3]. Compared to extractions of the sigma term from baryon masses [4, 5], some of these new results [6] imply a strangeness contribution to the mass of the nucleon of up to 50%. This is at variance with other investigations, for example estimates from the nucleon strange meson cloud [7] or neutrino reactions [8].
The size of isospin breaking in the pion-proton system has been investigated by using three experimentally accessible reactions: elastic scattering and single charge exchange . If isospin is conserved, the amplitudes for these reactions are connected by a triangle relation. The violation of this relation for s-waves at low energies (energies below = 100 MeV) has been tested by several groups, leading to contradictory results. While empirical analyses by Gibbs et al. [9] and Matsinos [10] showed large isospin violation of about 7%, a recent work by Fettes and Meißner lead to just 0.7% [11].
These discrepancies could be at least partly due to deficiencies in the data base. While a consistent and dense data base for differential cross sections [12] and analyzing powers [13, 14, 15] exists today for energies across the resonance, this is not the case for energies below 100 MeV. Here, information is still missing, and there are regions where existing experimental data are contradictory; in particular, discrepancies in differential cross-section data have been identified [16]. New measurements of observables at low energies aim at providing the missing information and removing the discrepancies.
Polarization observables are particularly interesting as they provide information complementary to differential cross-section data in the sense that they are sensitive to small amplitudes. They could also help to resolve contradictions in the cross section data base. Until recently, only one set of analyzing powers at one energy was available below 98 MeV [17], largely due to experimental difficulties. Since then, analyzing powers have been measured down to 57 MeV [18] by the CHAOS collaboration at TRIUMF.
In this article, we now report on measurements of analyzing powers in scattering at several energies between 45.2 and 87.2 MeV, as well as a few p data points at 67.3 and 87.2 MeV. All data were acquired with the Low Energy Pion Spectrometer (LEPS) and a novel polarized scintillator target at PSI.
2 Experiment
In pion-proton elastic scattering, a spin 0 projectile is scattered off a spin 1/2 target particle. The reaction is therefore described by a spin-flip and a non-spin-flip amplitude, which gives rise to three polarization observables in addition to the unpolarized differential cross section. Of the polarization observables, only the analyzing power is accessible in single-scattering experiments. The analyzing power describes the modification of the differential cross section when the target protons are polarized perpendicular to the scattering plane. With the scattering angle and the target polarization , this modification is given by
| (1) |
The analyzing power is determined from this linear dependence by measuring the differential cross section for different values of the target polarization . The highest sensitivity is reached when large polarization values with opposite signs are used. Measurements at other polarization values (in particular at ) can be used as systematic checks for the apparatus and the analysis procedure, as the linear dependence on has to be reproduced. For the determination of the analyzing power from Eq. 1, no absolute normalization of the measured cross sections is needed. However, the measurements at different polarizations have to be appropriately normalized to each other.
A major difficulty with measurements of the analyzing power is caused by the composition of the polarized target. The only polarized proton targets available for use in a secondary pion beam are dynamically polarized solid targets. Therefore, the target material contains nuclei (typically carbon) besides the protons, and it is surrounded by liquid helium along with copper and iron walls. Pion reactions on these materials give rise to large backgrounds for the pion-proton reaction. At high energies and backward scattering angles, this difficulty is overcome by measuring the scattered pion and the recoil proton in coincidence. For low energies and forward angles, this technique can not be applied as the recoil energy is too low to allow the proton to leave the target. This difficulty is the main reason for the lack of information on analyzing powers below a pion bombarding energy of = 100 MeV (with the notable exception of the measurement at 68.3 MeV by Wieser et al. [17]). It applies in particular to scattering, where the interesting region with the largest expected energy dependences of the analyzing power lies at forward angles. In the measurements reported here, a polarized active target was the key to the success with background suppression. This device gave access to the recoil proton energy deposition in the target through a scintillation light readout.
The experiment was done at the E3 pion beam line at PSI. It employed the Low Energy Pion Spectrometer LEPS [19]. LEPS is a compact magnetic spectrometer consisting of a quadrupole triplet and a split dipole. The total length of the particle flight path was approximately 5 meters. The trajectory of traversing particles was sampled in 6 layers (3 horizontal, 3 vertical) of proportional chambers between the quadrupole triplet and the dipole, as well as in a drift chamber in the focal plane. The remaining volume of the spectrometer was kept under vacuum. The nominal solid angle of the spectrometer was 25 msr. The momentum resolution was better than 510-3 for pions in the momentum range used in this experiment.
The target sample, a block of 18*18*5 mm3 scintillating organic polymer doped with free radicals (TEMPO) [20], was dynamically polarized in a field of 2.52 T in a vertical 3He-4He dilution refrigerator. The magnetic field was generated by a superconducting split-pair Helmholtz coil located above and below the target cell. Polarization was induced in the sample by microwave irradiation. The polarization was measured by using NMR methods.
Data were collected in two operating modes of the polarized target. In the first mode, the target was continously polarized at the full magnetic field. In the second mode, the field was reduced to 1.2 T and the target temperature reduced to 60 mK (“frozen spin” mode), resulting in a typical polarization decay time of 80h.
A plastic light guide with diameter of 12 or 19 mm (for different parts of the experiment) transported the scintillation light from the sample in the mixing chamber to a photomultiplier outside the cryostat. The photomultiplier signal was read out by a 1 GHz flash ADC which allowed offline definition of integration times. The gain of the photomultiplier was monitored by an LED light pulser system.
The data-taking procedure included frequent changes of the polarization direction, which were achieved by changes of the frequency of the microwave irradiation. This was done in order to verify the long term stability of the experimental system. Typically three changes of the polarization direction were performed for each data set at each angle and energy setting. Additional data were taken at zero polarization.
3 Analysis
Calculation of the analyzing power required determination of the incident pion beam energy , target polarization , scattering angle , and relative cross sections for different target polarizations. The analyzing power for a specific beam energy and scattering angle was then extracted from the linear dependence (Eq. 1). The extraction of the required parameters, the subsequent calculation of the analyzing power, and the determination of systematic errors is described below.
3.1 Beam energy
The incident pion energy at the target center was determined from the pion momentum at the exit of the E3 beamline and the pion energy loss traversing the material from the beam line exit to the center of the target.
The E3 channel had been calibrated to an accuracy of = 0.2% for a previous experiment [17]. This calibration was verified in the current experiment by measuring the kinematic shifts of the outgoing pion momenta for and C elastic scattering with a thin (1 mm) polyethylene target and the LEPS spectrometer at various angles and energies. No deviation from the expected beam momentum was seen within the accuracy of this consistency check.
The energy loss and spread of the pion beam on the path to the target center was calculated by a simulation program which took into account the geometry, the materials, the field of the polarizing magnet, and the vertical dispersion of 5 cm per percent of momentum of the beam at the target position. The resulting energy spread ranged from 0.8 to 1 MeV, dependent on the incident momentum and the target configuration. The mean energy was determined to an accuracy of better than 0.3 MeV from the beam calibration.
3.2 Polarization
NMR absorption signals in the region of the Larmor frequency of the protons were taken periodically while the scintillator target was dynamically polarized. For the absolute calibration of the polarization, thermal-equilibrium (TE) signals were taken repeatedly at a temperature of 2.17 K in a magnetic field of 2.52 T. The dynamic (DYN) polarization was determined as the product of the known TE polarization and the ratio of the areas of the DYN and the TE signals. The maximum polarizations were and . The dominant systematic error of the target polarization comes from the uncertainty in the measurement of the temperature under TE conditions ( = 0.035).
Part of the data (sets 1 and 2) were taken in frozen spin mode in a holding field of 1.2 T. The polarization decay time was in the range of 60 to 100 h. In these cases the polarization was measured in the full polarizing field of 2.52 T before and after the data taking runs. The subsequent analysis assumed an exponential decay of the polarization. Typically, the relative polarization decay between measurements was 20%.
3.3 Scattering angle
The mean scattering angle was determined to an accuracy of 0.3 degrees from the trajectories of the scattered pions, the position of the spectrometer, and the distribution of scattering events over the angular acceptance of the spectrometer. The trajectories of outgoing pions in the magnetic field of the target were calculated by the simulation program mentioned in section 3.1. The spectrometer position was determined to better than 0.05 degrees. The mean scattering angle and the angular acceptance for particles transported through LEPS were extracted from distributions of the accepted angles measured in the LEPS intermediate focus and projected back to the target position. The overall angular acceptance due to the incident beam divergence, vertex position on the target, straggling, and the acceptance of the spectrometer was 2.4 degrees for measurements with a target magnetic field of 1.2 T (sets 1 and 2), and 2.8 degrees for 2.52 T (set 3).
3.4 Relative cross sections
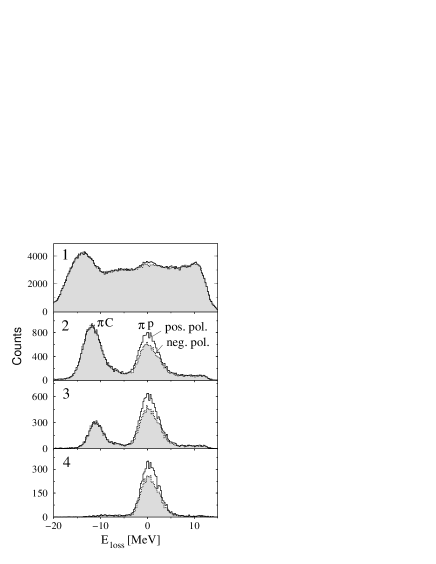
Relative cross sections were extracted from the LEPS focal plane spectra. Fig. 1 shows typical focal plane spectra for different conditions and polarizations. The plotted quantity is , which is defined as the difference between the kinematically expected energy of the outgoing pion in elastic scattering and the energy measured in the spectrometer, corrected for the energy loss in traversed materials. Spectrum 1 shows all events detected in the spectrometer. The solid line represents a measurement with positive target polarization, the dotted line and the shaded area a negative polarization run. The spectra show a broad bump at negative which corresponds to elastic scattering off carbon in the target material as well as scattering off other nuclei, such as copper, in the target cell. The elastic scattering peak around = 0 sits on a large background from other reactions in the target region. In this region (and only there), a difference between the positive- and negative-polarization runs is visible. The edge of the spectrometer acceptance for low energy pions is reflected by the slope above = 10 MeV.
The relative normalization of the runs at a given energy and angle was achieved by a fit of these spectra, outside the region, of all events detected by the LEPS spectrometer (without requiring any target information). This procedure implicitely takes into account wire-chamber and data-taking efficiencies. The systematic error in this procedure was estimated by variation of the region used in the normalization.
Subplots 2 to 4 of Fig. 1 show spectra when a software coincidence of a spectrometer event and a scintillation light signal from the active polarized target was required. The minimum size of the required signal (called ’cut’ in the following) was increased in each of these figures. This target signal requirement removed a major fraction of the background under the peak.
To ensure that the cut was equivalent for all runs at various polarizations used for the calculation of one analyzing power data point, a run-to-run calibration of the target signal amplitude was required. The calibration was done by using the C elastic scattering peak. This peak was independent of polarization, and so the normalized yield in this peak had to be, within statistics, identical for all runs. Therefore the signal size was calibrated by requiring the same cut-dependent normalized yield in the C region for all runs. The calibration was expressed as a dependence of the equivalent cut for one run versus the cut in a reference run. This dependence was found to be well described by a linear function. It was extended linearly to cut regions where the C peak had insufficient yield.
The scattering yield was extracted from the spectra for a wide range of cuts on the target signal size. The region of the peak was fitted by a Gaussian peak and a flat distribution describing the remaining background under the peak. A systematic error of the analyzing power due to the description of the distributions by the fit function was derived from the change of the analyzing power with the applied cut on the active target signal, which is sensitive to an incorrect description of the remaining background distribution (see next section).
3.5 Analyzing power
The analyzing power was calculated from the normalized yields (i.e. relative cross sections) for all runs in one set by using the linear relation between polarization and cross section given in Eq. 1. The normalized yields were plotted against polarization and fitted by a straight line. The analyzing power was then calculated from the line parameters.
As a consistency check for the calibration and yield extraction procedures, the analyzing power was calculated for a wide range of cuts on the target signal size. Fig. 2 shows typical results. The top panel shows the dependence of the analyzing power on the required minimum target signal size. There is no significant dependence at all cut levels. The middle panel shows the corresponding reduced for the straight-line fit to the relative cross section. This quantity tests the internal consistency of the runs. Finally, the bottom panel shows three selected fits of relative cross sections. The corresponding cuts are 1000, 1200, and 1400 in the units of the upper panels, from top to bottom. Good consistency is found.
The statistical error of the calculated analyzing power depends only weakly on the applied cut. This situation is due to the fact that the smaller number of counts for higher cuts is at least partly compensated by a lower background level. The final value of the analyzing power was taken at the minimum of the statistical error.
4 Results and discussion
The results are listed in Tab. 1 and plotted in Figs. 3 and 4 for and scattering, respectively. Provided in the table are the values of the analyzing power with the statistical error as well as the systematic error from the relative normalization, the active target ADC calibration, and the fit to the spectra. The three sets are independently subject to an overall 3.5% relative normalization error due to the systematic uncertainty in the polarization measurement.
The current results are compared with predictions of the KH80 [3] and SAID [21] phase shift analyses and with previous data [17] in Fig. 3. The solid and dashed lines represent the FA02 [21] and KH80 [3] phase shift predictions, respectively. The data from Wieser et al. [17] at 68.3 MeV are shown as stars, the solid points represent the results from the current work (only statistical errors are shown).
The phase shift results are in agreement with the data at 87.2 and 77.2 MeV, with a somewhat better description by the KH80 prediction at the lower energy. At 68.5 MeV, the predictions are significantly above the data in the forward-angle region, which is in agreement with the findings from the earlier measurement [17]. At 57.2 MeV, we again find agreement between the phase shift predictions and the data. The predictions are somewhat above the data at large angles at the two lowest energies. For the three measured points for scattering in Fig. 4, the present data are in agreement with previous data [18] and the phase-shift prediction results within the error bars (which are substantially larger than for the data).
Overall, we do not observe strong deviations of the phase shift predictions from the experimental results. This observation is similar to the findings for low energy analyzing powers in elastic scattering [18]. Further experimental information is expected from measurements of differential cross sections in the Coulomb-nuclear interference region down to very low energies (20 MeV)[22], which have been taken by the CHAOS collaboration and are currently being analyzed. If no significant deviations from the phase shift analyses are observed, then alternative explanations for the large values of the sigma term from recent extractions [6] will have to be found. Several ideas have been put forward, questioning the extraction procedure from data [23], the equivalence of the (sigma) terms extracted from scattering and baryon masses [24], or the validity of the connection [4] of baryon masses and sigma term [25].
4.1 Acknowledgment
This work was supported by the German minister of education and research (BMBF) under contract 06TU201 and the Deutsche Forschungsgemeinschaft (DFG: Europ. Graduiertenkolleg, Heisenberg-Programm).
References
- [1] Ulf-G. Meißner and G.R. Smith in Proceedings from the Institute for Nuclear Theory-Vol.11, 329, Editors A.M. Bernstein, J.L. Goity, U.-G. Meißner, World Scientific (2001).
- [2] R. Koch, Z. Phys. C15, 161 (1982).
- [3] R. Koch and E. Pietarinen, Nucl. Phys. A336, 331 (1980); G. Höhler, in Pion Nucleon Scattering, edited by H. Schopper, Landolt-Börnstein, New Series, Group X, Vol. I, 9b2 (Springer Verlag, Berlin, 1983).
- [4] J. Gasser, Ann. Phys. (N.Y.) 136, 62 (1981).
- [5] B. Borasoy and Ulf-G. Meißner, Ann. Phys. (N.Y.) 254, 192 (1997).
- [6] M.M. Pavan, R.A. Arndt, I.I Strakovsky, and R.L. Workman, in Proceedings of the 9th International Symposium on Meson-Nucleon Physics and the Structure of the Nucleon, Washington D.C., edited by H. Haberzettl and W.J Briscoe [N Newsletter 16, 110 (2002)].
- [7] V.E. Lyubovitskij, T. Gutsche, A. Faessler and E.G. Drukarev, Phys. Rev. D 63, 054026 (2001).
- [8] A.O. Bazarko et al., Z. Phys. C65, 189 (1995).
- [9] W.R. Gibbs, Li Ai, and W.B.Kaufmann, Phys. Rev. Lett. 74, 3740 (1995).
- [10] E. Matsinos, Phys. Rev. C 56,3014 (1997).
- [11] N. Fettes and Ulf-G. Meissner, Phys. Rev. C 63, 045201 (2001).
- [12] M.M. Pavan et al., Phys. Rev. C 64, 064611 (2001).
- [13] M.E. Sevior et al., Phys. Rev. C 40, 2780 (1989).
- [14] G.J. Hofman et al., Phys. Rev. C 58, 3484 (1998).
- [15] G.J. Hofman et al., Phys. Rev. C 68, 018202 (2003).
- [16] N. Fettes and E. Matsinos, Phys. Rev. C 55, 464 (1997).
- [17] R. Wieser et al., Phys. Rev. C 54, 1930 (1996).
- [18] J.D. Patterson et al., Phys. Rev. C 66, 025207 (2002).
- [19] K. Föhl, PhD thesis, University of Tübingen (1996).
- [20] B. van den Brandt et al., Nucl. Instr. Meth. A 446, 592 (2000).
- [21] R.A. Arndt, I.I. Strakovsky, R.L. Workman, M.M. Pavan, Phys. Rev. C 52, 2120 (1995); R.A. Arndt, W.J. Briscoe, I.I. Strakovsky, R.L. Workman, M.M. Pavan, arXiv:nucl-th/0311089v2 (2004); the SAID analysis is available at http://gwdac.phys.gwu.edu/
- [22] H. Denz, in Proceedings of the 9th International Symposium on Meson-Nucleon Physics and the Structure of the Nucleon, Washington D.C., edited by H. Haberzettl and W.J Briscoe [N Newsletter 16, 302 (2002)].
- [23] J. Stahov, arXiv:hep-ph/0206041 (2002).
- [24] W.R. Gibbs, Mod. Phys. Lett. A18, 1171 (2003).
- [25] D.B. Leinweber, A.W. Thomas and S.V. Wright, Phys. Lett. B482, 109 (2000).
| Set | Energy (MeV) | Beam | (deg) | |||
|---|---|---|---|---|---|---|
| 1 | 87.2 | 48.2 | 0.378 | 0.054 | 0.031 | |
| 65.4 | 0.406 | 0.023 | 0.017 | |||
| 81.8 | 0.392 | 0.015 | 0.012 | |||
| 97.3 | 0.214 | 0.018 | 0.006 | |||
| 112.1 | 0.153 | 0.014 | 0.011 | |||
| 126.1 | 0.055 | 0.013 | 0.013 | |||
| 68.4 | 71.1 | 0.317 | 0.036 | 0.016 | ||
| 101.5 | 0.136 | 0.024 | 0.007 | |||
| 57.2 | 58.6 | 0.344 | 0.045 | 0.015 | ||
| 69.7 | 0.317 | 0.026 | 0.015 | |||
| 85.7 | 0.264 | 0.028 | 0.025 | |||
| 101.1 | 0.154 | 0.022 | 0.008 | |||
| 2 | 51.2 | 63.9 | 0.340 | 0.053 | 0.023 | |
| 85.4 | 0.183 | 0.032 | 0.018 | |||
| 100.8 | 0.088 | 0.018 | 0.012 | |||
| 115.6 | 0.051 | 0.022 | 0.016 | |||
| 45.2 | 85.2 | 0.144 | 0.026 | 0.012 | ||
| 100.6 | 0.053 | 0.027 | 0.009 | |||
| 3 | 87.2 | 66.5 | 0.411 | 0.019 | 0.007 | |
| 88.1 | 0.339 | 0.018 | 0.010 | |||
| 77.2 | 63.0 | 0.456 | 0.021 | 0.014 | ||
| 84.7 | 0.353 | 0.019 | 0.008 | |||
| 68.6 | 59.5 | 0.375 | 0.023 | 0.013 | ||
| 81.3 | 0.317 | 0.018 | 0.010 | |||
| 57.3 | 75.8 | 0.302 | 0.024 | 0.014 | ||
| 87.2 | 60.9 | 0.128 | 0.048 | 0.019 | ||
| 90.7 | 0.088 | 0.050 | 0.028 | |||
| 67.3 | 83.5 | 0.092 | 0.048 | 0.016 |