Energy dependence of the production cross section ratio in p–p interactions.
Abstract
The production of the and hyperons has been measured via
the reaction at the internal
COSY–11 facility in the excess energy range between 14 and 60 MeV. The
transition of the cross section ratio from about 28 at
to the high energy level of about 2.5 is covered by
the data showing a strong decrease of the ratio between 10 and 20 MeV excess
energy.
Effects from the final state interactions in the channel
seems to be much smaller compared to the one.
Estimates of the effective range parameters are given for the and
the systems.
pacs:
13.75.-nHadron-induced low- and intermediate-energy reactions and scattering (energy(less-than-or-equal-to)10 GeV) and 13.75.EvHyperon-nucleon interactions and 13.85.LgTotal cross sections and 14.20.JnHyperons and 25.40.EpInelastic proton scattering1 Introduction
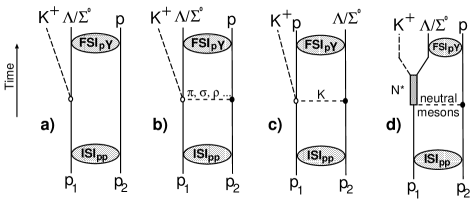
In the kinematical threshold region the strangeness production is commonly described by both non-strange and strange meson exchange with or without explicit inclusion of an intermediate resonance as depicted in the four graphs of Fig. 1. While the exchange of the lightest mesons, namely and , is expected to be dominant in the and production fael97 ; li95 ; li97 ; sib198 ; lag91 ; lag01 ; gas00 there could be also a contribution arising from the exchange of heavier non-strange or strange mesons tsu97 ; tsu99 ; sib00b ; shy01 . In addition, proton-hyperon final state interactions (FSI) play an important role when comparing the and reaction channels.
Since the quark structures of the two neutral and hyperons are analogous to each other one can expect similar production mechanisms. In such a case the cross section ratio should be mainly determined by the isospin relation which leads to , in good agreement with the value observed in proton-proton scattering experiments at excess energies bal88 . It is interesting to note that a comparable cross section ratio was determined in antiproton-proton annihilation experiments leading to , and as performed by the PS185 collaboration at LEAR barn97 ; barn97b .
In contrary to these results, close to threshold data sew99 (i.e. ) taken at the COSY–11 facility bra96 ; pawel:nim revealed as the most remarkable characteristic a ratio of .
At first a dominant -exchange mechanism was discussed sew99 as a possible explanation of the large cross section ratio, which can be determined by the ratio of the squared coupling constants , assuming that all other components in the and production diagrams are the same and when neglecting any final state interactions. It is particularly interesting to note that the ratio of the coupling constants within the SU(6) representation swa63 ; dov84 leads to = 27, which exactly reproduces the experimental result very close to threshold but fails to explain the cross section ratio observed at high excess energies. In reality it is expected that also -exchange contributes significantly in the production process. For a review of that issue the reader is refered to revart .
The first COSY–11 data on the ratio encouraged several groups to explain the experimental results. For example calculations within a meson exchange model gas00 taking into account pion and kaon exchange (graphs b) and c) in Fig. 1) and their interference reproduce the measured excitation functions of and production: while the production channel appears to be dominated by the -exchange mechanism, both and exchange contribute with equal strength to the production. Therefore a - interference becomes significant only in the case. Indeed the authors of Ref. gas00 argue that the data require — independent of the hyperon-nucleon potential used for the description of the low-energy final state scattering process — a destructive interference between the and exchange contributions.
Other recent models lag91 ; lag01 ; sib00b ; shy01 describe the ratio within a factor of two by including heavier exchange mesons (graph b) Fig. 1) or nucleon resonances (graph d) Fig. 1).
More data were needed to differentiate between the various descriptions and to develop a suitable model for the hyperon production. Therefore, additional cross sections were measured at the COSY–11 facility in order to determine the energy dependence of the cross section ratio in the transition region from to where the production ratio changes most drastically.
2 Experiment
The present hyperon (Y) production experiments were performed at the Cooler Synchrotron COSY-Jülich maie97 using the COSY–11 detection facility bra96 ; pawel:nim shown in Fig. 2.
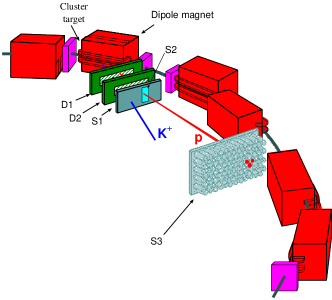
One of the regular COSY dipole magnets serves as a magnetic spectrometer with a H2 cluster beam target domb97 installed in front of it. Due to the advantage of internal beam experiments to use targets with comparatively low areal densities (e.g. 5 atoms/cm3), energy losses and secondary reactions in the target are negligible. The interaction between a proton of the beam with a proton of the cluster target may lead to the production of neutral hyperons (, ) via the reactions .
The selection of events is done by the detection of both positively charged particles in the exit channel (i.e. proton and ) while the unobserved neutral particle is identified via the missing mass method.
Positively charged ejectiles from these reactions have smaller momenta than the protons in the beam and therefore, they are directed from the circulating beam by the magnetic field of the dipole towards the inner part of the COSY ring.
Leaving the vacuum chamber through a very thin exit foil (300 m carbon fibre/30 m Al) bra96 , the charged reaction products are registered in a set of two drift chambers D1 and D2 for the track reconstruction. With the well known magnetic field, their momenta can be determined by tracking back to the interaction point. Furthermore, a time-of-flight measurement between the S1(S2) start and the S3 stop scintillator hodoscopes allows to determine their velocity. Therefore, the four-momentum vectors for all positively charged particles can be established and together with the known initial kinematics, the four-momentum of the unobserved neutral hyperon is uniquely determined.
To avoid systematical uncertainties as much as possible, COSY was operated in the ”supercycle mode” i.e. the beam momenta were changed between the cycles, such that for example 10 cycles with a beam momentum corresponding to the excess energy MeV above the threshold were followed by one cycle with the same above the production threshold. The ratio of the number of the cycles was chosen inverse to the ratio of the cross sections for the and production based on the expectations from previous experiments. Thus, both cross sections were measured under the same conditions and possible changes in the detection system did not influence the data taking procedure, especially for the determination of the cross section ratio.
In Fig. 3 typical missing mass spectra for the threshold production of and hyperons are given, both measured at the same excess energy of = 20 MeV. It is obvious that the peak to background ratio is much larger for the than for the production. The solid lines are background distributions as derived from the experimental data themselves by selecting side bands of the two dimensional invariant vs. missing mass representation below and above the kaon range as described in a previous publication sew99 .

The small excess of counting rate in the lower part of the figure at smaller missing masses than the peak is be due to and reactions with subsequent decay and missidentification of the primary and secondary protons. The dashed line in the lower panel of Fig. 3 shows the distribution for the reaction obtained in Monte-Carlo simulations. The background shoulder beyond the peak in the figure for the hyperon production is predominantly due to the decreasing missing mass resolution with increasing value jurek:annrep .
3 Results
3.1 Total cross section
The total cross sections extracted for all measured beam momenta are listed in Tables 1 and 2 where only the statistical errors are given. In addition, the following systematic uncertainties have to be taken into account: for the background subtraction 15 % for and 7 % for as well as 3.5 % due to the luminosity determination which is performed by a simultaneous measurement of proton–proton elastic scattering pawel:nim . A further systematical error of below 5 % is introduced by the detection efficiency which is determined via GEANT geant simulations assuming an S-wave production process with inclusion of the proton- FSI only in the case of the reaction. The detection efficiencies for different access energies are shown in Tables 1 and 2. To deduce the influence of possible higher partial wave contributions a P-wave in the - system was introduced in the MC simulations. Compared to S-wave pure P-wave production would result in an increase of the total acceptance of about a factor two for the highest . This moderate difference can be explained by the special configuration of the detection system with a nearly full acceptance in the horizontal plane resulting in the full coverage of the angular range for a thin slice in the vertical plane.
In reality P-wave contribution is expected to be below 20% at a -value of tof:blig98 and much smaller at lower values. Therefore, an additional systematical error in acceptance calculation due to the higher partial wave in the - system would be below 20%.
| Excess energy | Total cross section | Detection efficiency |
|---|---|---|
| [MeV] | [nb] | [%] |
| 13.9 0.5 | 630 79 | 0.65 0.02 |
| 15.9 0.7 | 727 57 | 0.56 0.015 |
| 20.2 0.7 | 1011 99 | 0.39 0.01 |
| 30.1 0.5 | 1366 247 | 0.25 0.01 |
| 39.7 1.1 | 2118 266 | 0.145 0.005 |
| 59.3 0.5 | 3838 624 | 0.075 0.005 |
| Excess energy | Total cross section | Detection efficiency |
|---|---|---|
| [MeV] | [nb] | [%] |
| 13.8 0.5 | 34.9 6.5 | 0.76 0.02 |
| 15.9 0.9 | 46.8 6.4 | 0.66 0.015 |
| 20.3 0.7 | 78 14 | 0.47 0.01 |
| 29.9 0.5 | 125 32 | 0.28 0.01 |
| 39.7 1.3 | 196 33 | 0.167 0.005 |
| 59.1 0.5 | 482 144 | 0.078 0.005 |
Previous COSY–11 measurements of the excitation function for the and reactions at excess energies up to = 13 MeV above the production threshold are summarized in sew99 , where it was pointed out that the energy dependence of the cross section is much better described by a 3-body phase space behaviour modified by the proton-hyperon () final state interaction fael97 than by a calculation taking into account pure phase space only. However, it should be emphasized, that in sew99 these fits were naturally limited to the excess energy range of the available data, i.e. 13 MeV.
In Fig. 4 the first COSY–11 data sew99 ; bal98a and one data point obtained by the COSY–TOF collaboration tof:blig98 are now extended by the new results up to = 60 MeV.
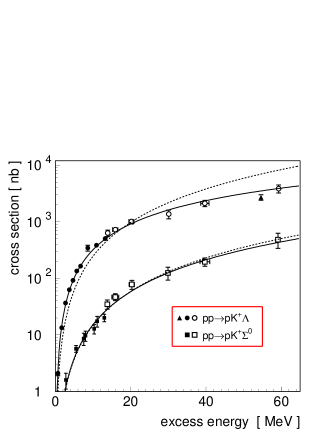
The dashed lines in Fig. 4 represent fits to the full set of data points in the excess energy range with a pure phase space behaviour byckling :
| (1) |
with the normalisation constant resulting in:
= (3.08 0.06) nb/MeV2
= (0.150 0.008) nb/MeV2.
The solid lines in Fig. 4 are fits by the Fäldt and Wilkin parametrisation fael97 with inclusion of the energy dependent flux factor which accounts for the different kinematics revart
| (2) |
The phase space volume and the flux factor F are given by byckling
| (3) |
| (4) |
The triangle function is defined, e.g., in byckling . The parameter , which is related to the strength of the final state interaction, and the normalisation constant are determined by the fits for each reaction separately resulting in:
= (98.2 3.7) nb/MeV2
= () MeV
= (2.97 0.27) nb/MeV2
= () MeV.
In case of the production the -value for the fit is = 1.8, which demonstrates a much better description of the data than by pure phase space representation with = 27.
Contrary, in case of production there is almost no difference between the fit results assuming phase space either with or without FSI, resulting in = 1.16 and = 1.11, respectively. This might indicate a rather weak FSI111 With in Eq. (2) one obtains the pure phase space distribution given by Eq. (1). although this could be also feigned by either higher partial wave contributions or an energy dependence of the elementary amplitude gas01 .
Having extracted from the fit to the data it is possible to express the results in terms of the averaged effective range parameters, namely the scattering length and the effective range . Assuming only S-wave production, the systems can be described using the Bargmann potentials newt82 , where and are expressed as:
| (5) |
While is a shape parameter, the value of is calculated via where is the reduced mass of the () system newt82 . The sign of is ambiguous but the negative value is chosen since (at least for ) an attractive interaction is expected hol89 ; Rij:1998 .
As can be seen from Eq. (5) the parameters and are interdependent and only a deduction of the correlations between them is possible. The extracted correlations for the and systems are presented in Fig. 5 by solid and dashed lines, respectively. The error ranges (thinner lines) result from the errors in .

The results obtained for the system are consistent with the value of the spin averaged parameters determined experimentally bal98b and represented in Fig. 5 by the cross. In the system, the scattering length seems to be much smaller. However, one should be cautious with the interpretation of the result for . Because of possible transitions in the final state (like ) the use of the Fäldt and Wilkin parametrization allows only to obtain a qualitative estimation of the FSI effects induced by the interaction but not directly on the channel.
3.2 Energy dependence of the cross section ratio
The cross section ratios for the excess
energy range
are listed in
Table 3 (and graphically presented in
Fig. 6), where only statistical errors of the ratios are
given.
The data show a strong decrease of the - production ratio in the excess energy range from to . Above 20 MeV the slope is much smaller and the ratio seems to approach slowly the high energy level.
| Excess energy | |
|---|---|
| [MeV] | |
| 13.90.6 | 18.1 4.1 |
| 15.90.8 | 15.5 2.4 |
| 20.30.8 | 13.0 2.6 |
| 30.00.7 | 10.9 3.4 |
| 39.71.2 | 10.8 2.3 |
| 59.20.7 | 8.0 2.7 |
4 Comparison with model expectations
Within different meson exchange models attempts have been made to reproduce the behavior of the cross section ratio, the high threshold value as well as the energy dependence.
A strong final state conversion sew99 is rather excluded as a dominant origin of the observed suppression — at least according to a coupled channel calculation of the Jülich group gas00 , where both and exchange are taken into account with inclusion of the final state interaction (FSI) effects. Here production is dominated gas00 by kaon exchange, which is in line with the experimental results obtained by the DISTO collaboration bal99 at higher excess energies (), where the importance of exchange is confirmed by a measurement of the polarisation transfer coefficient. Contrary, in case of production both and exchange are found to contribute with about the same strength gas00 .
A destructive interference of the and exchange, suggested by Gasparian et al. gas00 ; gas01 , is able to describe the large cross section ratio close–to–threshold. Contributions from direct production as well as from heavy meson exchange were not considered in these calculations but might have an influence on the ratio of the production as suggested in Refs. tsu97 ; tsu99 ; kai99a .
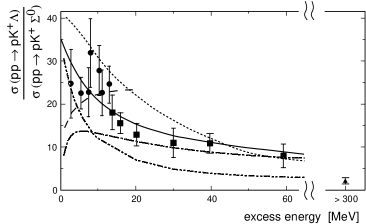
In Fig. 6 the energy dependence of the cross section ratio given by the different models is shown together with the available data. The predictions of the different models are of comparable quality even though different production mechanisms are considered. However, none of them reproduces the data really well.
Studies of the production ratio in Ref. sib00b consider two different models: The first one is based on and exchange calculations neglecting completely any interferences of the amplitudes sib95 (dashed-dotted line). The second one considers the exchange of or heavier mesons with an excitation of intermediate resonances coupled to the channel tsu97 ; tsu99 (dashed-double-dotted line). Again, any interference of the amplitudes are neglected.
The resonance production is also taken into account in an effective Lagrangian approach shy01 (dotted line) based on methods discussed in references shy98 ; shy99 ; eng96 , where the strangeness production mechanism is modeled by the exchange of , , and mesons with a subsequent excitation of the nucleon resonances , and . In those calculations the experimental data are reproduced within a factor of two.
The one-boson exchange calculation performed by Laget lag91 ; lag01 takes interference effects of pion and kaon exchanges into account by selecting the relative sign for these two mechanism which gives the best description of the cross sections. The results of those calculations not only reproduce the threshold data of the ratio within a factor of two and the polarisation transfer results of the DISTO experiment bal99 but also describe the missing mass distribution obtained in the inclusive production measurements performed at SATURNE sie94 . However, since the predicted ratio is given only in the excess energy range lag91 ; lag01 , the results are not shown in Fig. 6.
The solid line in Fig. 6 results for the ratio of the fit functions as shown in Fig. 4 which suggests that the energy dependence is simple governed by the different strengths of the - final state interactions but here the amplitudes are simply independently normalized without considering the differences in the contributing production amplitudes.
5 Conclusion
At the internal hydrogen cluster target facility COSY–11 the energy dependence of the total cross sections for the and production was measured in the range of excess energies between 14 and 60 MeV in order to investigate the transition of the cross section ratio from at to at .
A strong decrease of the cross section ratio in the excess energy range between 10 and 20 MeV is observed. Various models are able to describe the data within a factor of two with comparable quality, even though they differ in the dominant contribution to the production mechanism.
Below the measured excitation functions were consistent with comparable final state interaction strengths in both channels, and sew99 . The new data sugest much weaker final state interactions in the channel than in the case of , at least as far as the present results are not feigned by contributions from higher partial waves and/or an energy dependence of the elementary production amplitude.
A measurement with high statistics at an excess energy of is highly desirable to study the angular distribution of the produced and hyperons. This would allow to determine whether higher partial waves already contribute in this energy range. Also, for a significant improvement of the accuracy of the information extracted from the FSI a measurement of the corresponding invariant mass spectra would be very useful gas03 .
In addition, data with polarized beam and hyperon polarization will be helpful to disentangle the contributing exchange mesons. Also other isospin channels have to be considered. Calculations within the Jülich meson exchange model gas00 for other channels have shown that e.g. the reaction channel is strongly dependent on the interference. For a destructive interference the cross section for is expected to be a factor of three higher and for constructive interference a factor of three lower than the cross section for .
Data of the reaction have already been taken c11:prop at COSY-11 and the analysis is in progress.
6 Acknowledgements
This work has been supported by the International Büro and the Verbundforschung of the BMBF, the Polish State Committee for Scientific Research, the FFE grants from the Forschungszentrum Jülich and the European Community – Access to Research Infrastructure action of the Improving Human Potential Programme.
References
- (1) G. Fäldt and C. Wilkin, Z. Phys. A357 (1997) 241.
- (2) G.Q. Li and C.M. Ko, Nucl. Phys. A594 (1995) 439.
- (3) G.Q. Li, C.M. Ko and W.S. Chung, Phys. Rev. C57 (1998) 434.
- (4) A. Sibirtsev and W. Cassing, e-Print Archive (1998), nucl-th/9802019.
- (5) J.M. Laget, Phys. Lett. B259 (1991) 24.
- (6) J.M. Laget, Nucl. Phys. A691 (2001) 11.
- (7) A. Gasparian et al., Phys. Lett. B480 (2000) 273.
- (8) K. Tsushima, A. Sibirtsev and A.W. Thomas, Phys. Lett. B390 (1997) 29.
- (9) K. Tsushima, A. Sibirtsev and A.W. Thomas, Phys. Rev. C59 (1999) 369, Erratum-ibid.C61:029903,2000.
- (10) A. Sibirtsev et al., e-Print Archive (2000), nucl-th/0004022.
- (11) R. Shyam, G. Penner and U. Mosel, Phys. Rev. C63 (2001) 022202.
- (12) A. Baldini et al., Total Cross–Sections for Reactions of High–Energy Particles (Landolt–Börnstein, New Series I/12, Springer, Berlin, 1988).
- (13) P. Barnes et al., Phys. Rev. C54 (1996) 2831.
- (14) P. Barnes et al., Phys. Lett. B402 (1997) 227.
- (15) S. Sewerin et al., Phys. Rev. Lett. 83 (1999) 682.
- (16) S. Brauksiepe et al., Nucl. Instr. & Meth. A376 (1996) 397.
- (17) P. Moskal et al., Nucl. Instr. & Meth. A466 (2001) 448.
- (18) J.J. de Swart, Rev. Mod. Phys. 35 (1963) 916.
- (19) C.B. Dover and A. Gal, Prog. Part. Nucl. Phys. 12 (1984) 171.
- (20) P. Moskal et al., Prog. Part. Nucl. Phys. 49 (2002) 1.
- (21) R. Maier, Nucl. Instr. & Meth. A390 (1997) 1.
- (22) H. Dombrowski et al., Nucl. Instr. & Meth. A386 (1997) 228.
- (23) J. Smyrski et al., Phys. Lett. B474 (2000) 182.
- (24) GEANT-Detector Description and Simulation Tool, CERN Program Library Long Writeup W5013, CERN, 1211 Geneva 23, Switzerland (1993).
- (25) A. Bilger et al., Phys. Lett. B420 (1998) 217.
- (26) J. Balewski et al., Phys. Lett. B420 (1998) 211.
- (27) E. Byckling and K. Kajantie, Particle Kinematics (John Wiley Sons Ltd., 1973), ISBN 0 471 12885 6.
- (28) A. Gasparyan et al., Schriften des FZ-Jülich: Matter & Materials 11 (2002) 205.
- (29) R.G. Newton, Scattering Theory of Waves and Particles (Springer-Verlag, New York, 1982).
- (30) B. Holzenkamp, K. Holinde and J. Speth, Nucl. Phys. A500 (1989) 485.
- (31) T.A. Rijken, V.G.J. Stoks and Y. Yamamoto, Phys. Rev. C59 (1999) 21.
- (32) J. Balewski et al., Eur. Phys. J. A2 (1998) 99.
- (33) F. Balestra et al., Phys. Rev. Lett. 83 (1999) 1534.
- (34) N. Kaiser, Eur. Phys. J. A5 (1999) 105.
- (35) A. Sibirtsev, Phys. Lett. B359 (1995) 29.
- (36) R. Shyam and U. Mosel, Phys. Lett. B426 (1998) 1.
- (37) R. Shyam, Phys. Rev. C60 (1999) 055213.
- (38) A. Engel et al., Nucl. Phys. A603 (1996) 387.
- (39) R. Siebert et al., Nucl. Phys. A567 (1994) 819.
- (40) A. Gasparyan et al., (2003), hep-ph/0311116.
- (41) T. Rożek and D. Grzonka, COSY Proposal 117 (2002).