Measurement of Strange Quark Contributions to the Nucleon’s Form Factors at =0.230 (GeV/c)2
Abstract
We report on a measurement of the parity-violating asymmetry in the scattering of longitudinally polarized electrons on unpolarized protons at a of 0.230 (GeV/c)2 and a scattering angle of . Using a large acceptance fast PbF2 calorimeter with a solid angle of sr the A4 experiment is the first parity violation experiment to count individual scattering events. The measured asymmetry is . The Standard Model expectation assuming no strangeness contributions to the vector form factors is . The difference is a direct measurement of the strangeness contribution to the vector form factors of the proton. The extracted value is or .
pacs:
12.15.-y, 11.30.Er, 13.40.Gp, 13.60.Fz, 14.20.DhThe understanding of sea-quark degrees of freedom of the nucleon
and the interaction of the quarks with the vacuum in the nonperturbative
low energy regime of quantum chromodynamics (QCD) is very poor even today.
Since the nucleon has no net strangeness,
any contribution of strange quarks to the nucleon structure observables
is of particular interest because it would be a pure sea-quark effect.
For example the scalar strangeness content of the nucleon that gives a contribution
to the mass of the nucleon has been discussed in the context of the commutator
which can be related to the -N scattering amplitude Olsson et al. (2002).
New measurements suggest a large contribution
of strange quarks to the mass of the nucleon on the order of .
The interpretation of the unexpected nucleon spin
content results Adams et al. (1997) suggests a sizeable contribution,
, of the strange quarks to the nucleon
spin.
Estimates of the strange quark contribution to the magnetic
and electric vector form factors predict sizeable effects
accessible to experiments Beck and Holstein (2001); Silva et al. (2003). Recently, two experiments,
SAMPLE at Bates Hasty et al. (2000) and HAPPEX at TJNAF Aniol et al. (2001),
have explored parity-violating (PV) asymmetries on the
proton and the deuteron in two different kinematical regions.
We report here on a new measurement at a four momentum transfer
of (GeV/c)2 at the
Mainzer Mikrotron accelerator facility (MAMI) Euteneuer et al. (1994).
The A4 experiment at MAMI is complementary to other experiments
for two reasons. Firstly its -value tests models predicting
an enhanced strangeness contribution at this point Weigel et al. (1995)
and secondly, for the first time counting techniques
are used in a scattering experiment measuring
a PV asymmetry. Therefore possible systematic contributions to
the experimental asymmetries and the associated uncertainties are of a different
nature as compared to previous experiments, which use analogue integrating
techniques.
Access to the strangeness nucleon vector current matrix elements is possible
in the framework of the standard model by a measurement of
the weak vector form factors of the proton Kaplan et al. (1988).
They can be expressed in terms of the known nucleon
electro-magnetic vector form factors and the unknown
strangeness contribution .
The interference between weak (Z0) and electro-magnetic ()
amplitudes leads to a PV asymmetry in the elastic scattering cross section
for right- and left-handed electrons ( and respectively),
which is given in the framework of the Standard Model Musolf et al. (1994) and can be
expressed as a sum of three terms, , with
| (1) | |||||
| (2) | |||||
| (3) |
represents the vector coupling on the proton vertex where the possible
strangeness contribution has been taken out and has been put into .
is a term arising only if a contribution from strangeness to the
electro-magnetic vector form factors is present and the
term represents the contribution from the axial coupling at the proton
vertex due to the neutral current weak axial form factor .
The quantity represents .
is the Fermi coupling constant as derived from muon decay.
is the fine structure constant,
the negative square of the four momentum transfer,
with the proton mass and
with the laboratory scattering angle of the electron.
The electro-magnetic form factors are taken from a recent
parametrization (version 1, page 5) by Friedrich and Walcher Friedrich et al. (2003),
where we assign an experimental error of to and ,
of to , and of to .
Electro-weak radiative corrections are included in the factors
and which have been evaluated in the
renormalization scheme Marciano and Sirlin (1984).
We use a value for of
0.23113(15) Hagiwara et al. (2002).
The electro-weak radiative corrections to have also been estimated within
the renormalization scheme and
the radiative corrections given in Zhu et al. (2000) as well
as a value of are included
in .
Electro-magnetic internal and external radiative corrections to the asymmetry
and the effect of energy loss due to ionization in the target have been
calculated. They reduce the expected asymmetry in our kinematics by about
.
In order to compare to the measured asymmetry, we include the effects of electro-magnetic
radiative corrections and energy loss in the target and average
over the acceptance of the detector and the target length. We obtain
the expected value for the asymmetry at the averaged without
strangeness contribution to the vector form factors of
ppm.
The PV asymmetry was measured at the MAMI accelerator facility in Mainz Euteneuer et al. (1994)
using the setup of the A4 experiment Maas et al. (2003).
The polarized MeV electrons were produced using a strained layer
GaAs crystal which is illuminated with circularly polarized laser
light Aulenbacher et al. (1997). Average beam polarization was about .
The helicity of the electron beam has been selected every 20.08 ms
by setting the high voltage of a fast Pockels cell according to a pattern of
four helicity states, either or .
The pattern was selected randomly
by a pseudo-random bit generator. A 20 ms time window enabled the
histogramming in all detector channels and an integration circuit
in the beam monitoring and luminosity
monitoring systems. The exact window length was locked
to the power frequency of 50 Hz in the laboratory by a phase locked loop.
For normalization, the gate length was measured for each helicity.
Between each 20 ms measurement gate, there was an 80 s time
window for the high voltage at the Pockels cell to be changed.
The intensity 20 A of the electron current was stabilized
to better than . An additional -plate in the
optical system was used to rotate small remaining linear polarization components and
to control the helicity correlated asymmetry in the electron beam current
to the level of ppm in each five min run.
We have used a system of microwave
resonators in order to monitor beam current, energy, and position in two
sets of monitors separated by a drift space of about m in front of the
hydrogen target.
In addition, we have used a system of 10 feed-back loops in order to stabilize
current, energy Seidl et al. (2000), position, and angle of the beam.
The polarization of the electron beam was measured using a
Møller polarimeter which is located on a beam line in
another experimental hall.
This Møller polarimeter Bartsch (2001) has an accuracy of
. Due to the fact, that we have to interpolate between
the weekly Møller measurements, the uncertainty in the
knowledge of the beam polarization increased to
.
The 10 cm high power, high flow liquid hydrogen target was optimized to guarantee
a high degree of turbulence with a Reynolds-number of
in the target cell in order to increase the effective
heat transfer. This new technique allowed us for the first time to avoid
a fast modulation of the beam position of
the intense cw 20 A beam and it also allowed us to stabilize the beam position on the
target cell without target density fluctuations arising from boiling.
The total thickness of the entrance and exit aluminum windows is 250 m.
The luminosity was monitored for each helicity state (R, L) during the experiment using eight
water-Cerenkov detectors (LuMo) that detect scattered particles symmetrically around the
electron beam for small scattering
angles in the range of , where the PV asymmetry is
negligible. The photomultiplier tube currents of these luminosity detectors are
integrated during the 20 ms measurement period by gated integrators and then digitized by customized 16-bit
analogue-to-digital converters (ADC). The same method was used for all the beam parameter signals
and these data were stored with the helicity information as a function of time
for each 20 ms time window.
A correction was applied for the nonlinearity of the
luminosity monitor photomultiplier tubes. This was measured and verified separately
by varying the beam current from 0-23 A several times per week.
From the beam current helicity pair data and luminosity monitor helicity pair
data we calculated
the target density for the two helicity states
independently for the analysis of the data.
As particle detector we developed a new type of a very fast, homogeneous, total absorption
calorimeter consisting of individual lead fluoride (PbF2) crystals Maas et al. (2002). The material
is a pure Cerenkov radiator and has been chosen for its fast timing characteristics and
its radiation hardness Achenbach et al. (2001). This is the first time this material
is used in a large scale
calorimeter for a physics experiment. The crystals are dimensioned so that
an electron deposits of its total energy in an electro-magnetic shower
extending over a matrix of crystals. Together with the readout electronics
this allows us a measurement of the particle energy with a resolution of
and a total dead time of 20 ns. At the time of the data taking, 511 channels of the
detector and the read out electronics were operational. The detector modules were located
in two sectors covering an azimuthal angle interval of 90∘
symmetrically around the beam axis.
The particle rate within the acceptance of this solid angle
is s-1. Due to the short dead time, the
losses due to double hits in the calorimeter are at 20 A.
The signals from each cluster of 9 crystals are summed and integrated
for 20 ns in an analogue summing and triggering circuit and digitized by a transient 8-bit
ADC. There is one summation, triggering, and digitization circuit
per crystal. The energy, helicity, and impact information are stored together in a three dimensional
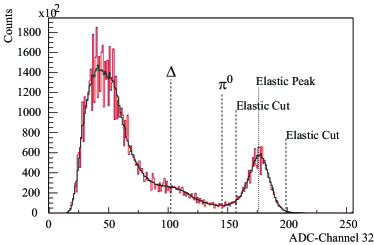
histogram. Figure 1 shows a typical
energy spectrum of scattered particles from the hydrogen target at an electron current of 20 A .
It was taken during five minutes and is a direct output of the histogramming memory.
The elastic scattering peak is clearly isolated at the high end of the spectrum.
The energy resolution of each group of 9 crystals was determined
by analyzing such spectra. The number of elastic scattered electrons is
determined for each detector channel by integrating
the number of events in an interval from above pion
production threshold to above the elastic peak
in each helicity histogram. The usage of those cuts ensures a clean separation between
elastic scattering and pion production or -excitation which has an unknown PV
cross section asymmetry. We determined the number of elastically scattered
electrons for each helicity state ( and ) by summing over the inner
345 detector channels which are the centers of a full crystal matrix.
The linearity of the PbF2 detector system with respect to particle counting rates
and possible effects due to dead time were investigated by varying the beam current.
We calculate the raw normalized detector asymmetry as
.
The possible dilution of the measured asymmetry by background
originating from the production of which
subsequently decays into two photons where one of the photons carries
almost the full energy of an elastic scattered electron was
estimated using Monte Carlo simulations to be much less than
and is neglected here.
The largest background comes from quasi elastic scattering at the thin aluminum entrance
and exit windows of the target cell. We have measured the aluminum quasielastic
event rate and calculated in static approximation a correction factor
for the aluminum of
1.030 0.003 giving a smaller value for the corrected asymmetry.
Corrections to false asymmetries arising from helicity correlated changes of beam parameters
were applied on a run by run base. The analysis was
based on the five min runs for which the counted elastic events in the PbF2 detector were combined
with the correlated beam parameter and luminosity measurements. In the analysis we applied
reasonable cuts in order to exclude runs where the accelerator or parts of the
PbF2 detector system were malfunctioning.
The analysis is based on a total of
histograms corresponding to
elastic scattering events.
We extracted an experimental asymmetry from
.
The six denote the correlation coefficients between the observed
false asymmetry and the electron current asymmetry (), the
horizontal and vertical beam position differences , (, ),
the horizontal and vertical beam angle differences , (, ),
and the beam energy difference ().
For the analysis, the correlation parameters were extracted by
multidimensional regression analysis from the data.
The have been calculated in addition from the geometry of the
precisely surveyed detector geometry and the calculated
using the two different methods agree very well within statistics.
The experimental asymmetry was normalized to the electron beam polarization
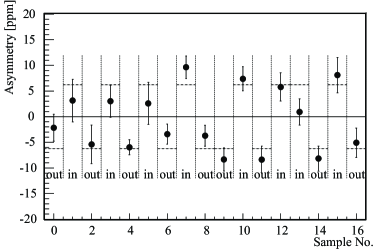
to extract the physics asymmetry, . We have taken half of our data with a second -plate inserted between the laser system and the GaAs crystal. This reverses the polarization of the electron beam and allows a stringent test of the understanding of systematic effects. The effect of the plate can be seen in Fig. 2: the observed asymmetry extracted from the different data samples changes sign, which is a clear sign of parity violation if, as in our case, the target is unpolarized. Our measured result for the PV physics asymmetry in the scattering cross section of polarized electrons on unpolarized protons at an average value of (GeV/c)2 is ppm. The first error represents the statistical accuracy, the second error the systematical uncertainties including beam polarization. The absolute accuracy of the experiment represents the most accurate measurement of a PV asymmetry in the elastic scattering of longitudinally polarized electrons on unpolarized protons. Table 1 gives an overview of the applied corrections and the
| correction [ppm] | error [ppm] | |
|---|---|---|
| Statistics | 0.54 | |
| Target density, luminosity | 0.58 | 0.09 |
| Target density, beam current | 0.00 | 0.04 |
| Nonlinearity of LuMo | 0.30 | 0.04 |
| Dead time correction | -0.11 | 0.08 |
| 0.64 | 0.04 | |
| -0.05 | 0.02 | |
| , | -0.03 | 0.02 |
| , | 0.03 | 0.03 |
| Aluminum windows (H2 target) | 0.16 | 0.02 |
| Dilution from decay | 0.00 | 0.06 |
| measurement | -1.07 | 0.11 |
| interpolation | 0.00 | 0.19 |
| Systematic error | 0.26 |
contributions to the systematical error of the experimental asymmetry.
The interpretation of the measurement in terms of strangeness contribution is possible
by comparing the measured physics asymmetry with the averaged theoretical value
without strangeness contribution to the vector form factors .
The difference is proportional to an averaged combination of the Sachs form factors
and the extracted value is
.
If one uses the Dirac and Pauli form factors instead, the extracted value is
.
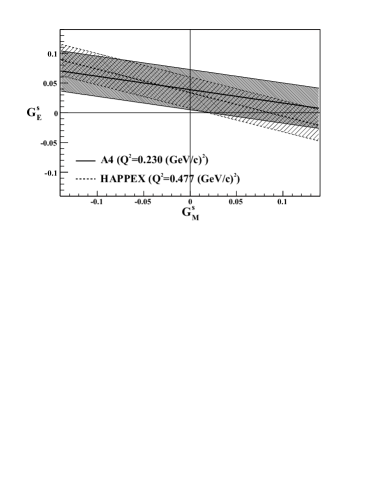
The solid line in Fig. 3 illustrates the possible combinations
of and given by our result on the
measured combination of at
(GeV/c)2. The hatched area represents the error on
.
The measured combination is small and is 1.2 standard deviations away from
zero, which clearly rules out the pole fit type of theoretical models
on the strangeness in the nucleon Jaffe (1989); Hammer et al. (1996).
From the published result on the measured asymmetry of the HAPPEX collaboration
Aniol et al. (2001) at =0.477 (GeV/c)2 and ,
we recalculated the combination using our parametrization for the electro-magnetic form factors Friedrich et al. (2003)
and yield
and .
In lack of more detailed information
we make the ad hoc assumption, that in the -range between 0.1 (GeV/c)2
and 0.5 (GeV/c)2 can be approximated by ,
corresponding to .
This assumption is guided by the fact that this value covers within two standard deviations
all theoretical estimates as well as the SAMPLE result from Hasty et al. (2000).
This yields a value for evaluated from our measurement of
(GeV/c) and
(GeV/c).
If one makes the further approximation of
neglecting the -dependence in , we can combine
our result with the recalculated HAPPEX result by calculating the weighted average and yield an estimate of
(GeV/c) (GeV/c) and
(GeV/c) (GeV/c).
The significance level of 2.2 for and 2.5 for
which we reach using the assumption described above, leads us
to the conclusion, that the combination of our measurements presented here with the earlier work
of the HAPPEX collaboration shows for the first time evidence for the observation of
a contribution of the strange quarks to the electric vector form factor of the nucleon.
This work is supported by the Deutsche Forschungsgemeinschaft
in the framework of the SFB 201, SPP 1034, by the IN2P3 of CNRS
and in part by the US Department of Energy.
We are indebted to K.H. Kaiser and the whole MAMI crew for their
tireless effort to provide us with good electron beam. We also
would like to thank the A1 Collaboration for the use of the
Møller polarimeter.
References
- Olsson et al. (2002) M. G. Olsson et al., PiN Newslett. 16, 382 (2002).
- Adams et al. (1997) D. Adams et al., Phys. Rev. D 56, 5330 (1997).
- Beck and Holstein (2001) D. H. Beck and B. R. Holstein, Int. J. Mod. Phys. E 10, 1 (2001).
- Silva et al. (2003) A. Silva et al., Nucl. Phys. A 721, 417 (2003).
- Hasty et al. (2000) R. Hasty et al., Science 290, 2117 (2000).
- Aniol et al. (2001) K. A. Aniol et al., Phys. Lett. B 509, 211 (2001).
- Euteneuer et al. (1994) H. Euteneuer et al., Proc of the EPAC 1994 1, 506 (1994).
- Weigel et al. (1995) H. Weigel et al., Phys. Lett. B 353, 20 (1995).
- Kaplan et al. (1988) D. B. Kaplan et al., Nucl. Phys. B 310, 527 (1988).
- Musolf et al. (1994) M. Musolf et al., Phys. Rep. 239, 1 (1994).
- Friedrich et al. (2003) J. Friedrich et al., Eur. Phys. J. A 17, 607 (2003).
- Marciano and Sirlin (1984) W. J. Marciano and A. Sirlin, Phys. Rev. D 29, 75 (1984).
- Hagiwara et al. (2002) K. Hagiwara et al., Phys. Rev. D 66, 010001 (2002).
- Zhu et al. (2000) S.-L. Zhu et al., Phys. Rev. D 62, 033008 (2000).
- Maas et al. (2003) F. E. Maas et al., Eur. Phys. J. A 17, 339 (2003).
- Aulenbacher et al. (1997) K. Aulenbacher et al., Nucl.Ins.Meth.A 391, 498 (1997).
- Seidl et al. (2000) M. Seidl et al., Proc. of the EPAC 2000 p. 1930 (2000).
- Bartsch (2001) P. Bartsch, Dissertation Mainz (2001).
- Maas et al. (2002) F. E. Maas et al., Proc. of the ICATPP-7 (World Scientific, 2002), chap. Crystal Detectors, p. 758.
- Achenbach et al. (2001) P. Achenbach et al., Nucl. Instrum. Meth. A 465, 318 (2001).
- Jaffe (1989) R. Jaffe, Phys. Lett. B 229, 275 (1989).
- Hammer et al. (1996) H. W. Hammer et al., Phys. Lett. B 367, 323 (1996).