Nuclear Stopping in Au+Au Collisions at GeV
Abstract
Transverse momentum spectra and rapidity densities, , of protons, anti–protons, and net–protons () from central (0-5%) Au+Au collisions at GeV were measured with the BRAHMS experiment within the rapidity range . The proton and anti–proton decrease from mid–rapidity to . The net–proton yield is roughly constant for at , and increases to at . The data show that collisions at this energy exhibit a high degree of transparency and that the linear scaling of rapidity loss with rapidity observed at lower energies is broken. The energy loss per participant nucleon is estimated to be GeV.
PACS numbers: 25.75 Dw.
The energy loss of colliding nuclei is a fundamental quantity determining the energy available for particle production (excitation) in heavy ion collisions. This deposited energy is essential for the possible formation of a deconfined quark–gluon phase of matter (QGP). Because baryon number is conserved, and rapidity distributions are only slightly affected by rescattering in late stages of the collision, the measured net–baryon () distribution retains information about the energy loss and allows the degree of nuclear stopping to be determined. Such measurements can also distinguish between different proposed phenomenological mechanisms of initial coherent multiple interactions and baryon transport Bass:1999zq ; Soff:2002bn ; Bass:2002vm .
The average rapidity loss, 111The rapidity, , is defined as . Rapidity variables are in the center-of-mass system with positive., is used to quantify stopping in heavy ion collisions Busza:1983rj ; Videbaek:mf . Here, is rapidity of the incoming projectile and is the mean net–baryon rapidity after the collision :
| (1) |
where is the number of participating nucleons in the collision. The two extremes correspond to full stopping, where initial baryons lose all kinetic energy () and full transparency, where they lose no kinetic energy (). For fixed collision geometry (system size and centrality) at lower energy (SIS, AGS, and SPS) it was observed that is proportional to the projectile rapidity. For central collisions between heavy nuclei (Pb, Au), Videbaek:mf ; Hong:1997mr ; e917 .
Bjorken assumed that sufficiently high energy collisions are “transparent”, thus the mid–rapidity region is approximately net–baryon free Bjorken:1982qr . The energy density early in the collision, , can then be related in a simple way to the final particle production. At RHIC it has been estimated that , well above the lattice QCD prediction ( Karsch:2001vs ) for the hadron gas to QGP phase transition.
In this letter, results on proton and anti–proton production, and baryon stopping in collisions at GeV are presented. The data were collected with the BRAHMS detector at RHIC. The BRAHMS experiment consists of two independent spectrometer arms, the Mid-Rapidity Spectrometer (MRS) and the Forward Spectrometer (FS), described in detail in BRAHMSNIM . The spectrometers consist of dipole magnets, Time Projection Chambers (TPC) and Drift Chambers (DC) for tracking charged particles, and detectors for particle identification (PID). The MRS can be rotated and the FS , where is the polar angle with respect to the beam axis. By combining different settings of angle and magnetic fields, (anti–)proton transverse momentum spectra at different rapidities () were obtained.
The interaction point (IP) is determined by the Beam–Beam counters (BB), with a precision of cm. The IP was required to be within 15 (20) cm of the nominal IP for the MRS (FS) analysis to minimize acceptance corrections.
Protons and anti–protons are identified using Time Of Flight detectors (TOF) in the MRS (TOFW) and FS (H1 and H2), and by the Ring Imaging Cherenkov (RICH) in the FS. The TOF resolution is , . To identify (anti–)protons it is required that the derived square of the mass, , is within of the proton and at least 2 away from the for kaons. This allows (anti–)protons to be identified up to momentum GeV/ for TOFW, GeV/ for H1, and GeV/ for H2. The refractive index of the RICH, allows protons to be directly identified via a measurement of their ring radius in the range GeV/. By using the RICH to veto pions and kaons the PID can be extended down to .
The collision centrality is determined using a multiplicity array located around the nominal IP BRAHMSNIM . In this analysis only the 0-5% most central collisions were used. The mean number of participants for this centrality class was found by Glauber model calculations to be Bearden:2001qq .
From the identified particles, invariant differential yields were constructed for each spectrometer setting. The differential yields were corrected for geometrical acceptance, tracking and PID efficiency, absorption and multiple scattering. The corrections for absorption and multiple scattering were less than 20% at the lowest and less than 5% at the highest in all settings. No corrections were applied for secondary protons from e.g. the beam pipe, since the contribution was found to be negligible in GEANT based Monte Carlo (MC) simulations geant using HIJING Wang:1991ht as input, when the tracks were required to point back to the IP. The acceptance correction is purely geometrical and calculated using a MC simulation of the BRAHMS detector. The tracking efficiency was estimated for the TPCs, by embedding simulated tracks in real events (method I), and in the FS where there are 5 tracking detectors (2 TPCs and 3 DCs) by comparing the number of identified track segments in the chamber to the number of reference tracks determined by other detectors disregarding the chamber under consideration (method II). In the front part of the FS (FFS) where both methods are applicable, there was a 10% discrepancy between the two methods which has been included in the systematic errors quoted below. For the spectrometers the total tracking efficiency depends on the spectrometer angle and is 90-95% in the MRS, 80-90% in the FFS (settings at ) and 60-70% in the full FS (, ). The efficiencies of the TOF detectors were found to be 93-98%. For the part of the spectrum at , where the RICH was used to veto pions and kaons a correction for contamination of pions and kaons with no identified ring radius was applied. The RICH inefficiency is .
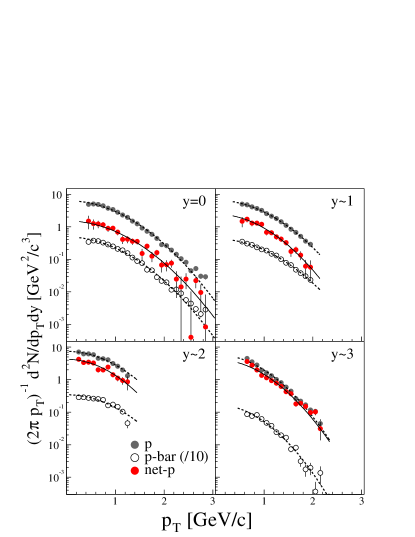
Figure 1 shows transverse momentum spectra for four of the nine measured rapidities. The net–proton spectra were constructed by subtracting the anti–proton spectrum from the proton spectrum. At each rapidity, the proton, anti–proton, and net–proton spectra have similar shape, indicating that produced and transported protons have similar spectral properties. To obtain rapidity densities, , for and net- their spectra are fitted, and the fit was used to extrapolate to the full range. Different functional forms were tested: -exponential, Boltzmann and Gaussian. The function found to best describe the data was the Gaussian in [] and this function has been used for all fits. This functional form was also used in Adler:2001aq .
The mean transverse momentum of the spectra calculated from the fit is found to be within 0.1 GeV/ at each rapidity for the three functional forms. For protons which have the best counting statistics, decreases from at to at .
The differential yield within the measured range varies from 85% of the total near mid–rapidity to 45% at . The systematic errors on were estimated from the difference in values obtained using different spectrometer settings covering the same regions, the discrepancy between the two different efficiency methods, and by estimating the effects of the extrapolation. The systematic errors were found to be 10-15% for mid-rapidity () and 20-30% for forward rapidities.
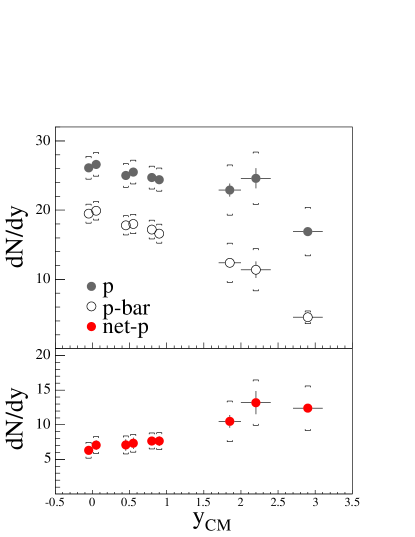
Figure 2 shows the resulting rapidity densities as a function of rapidity. The most prominent feature of the data is that while the proton and anti–proton decrease at rapidities away from mid–rapidity the net–proton increases over all three units of rapidity, from to .
A Gaussian fit to the anti-proton distribution gives the total extrapolated anti–proton yield : (92% in ). For protons the yield from a Gaussian fit to in the range, , is .
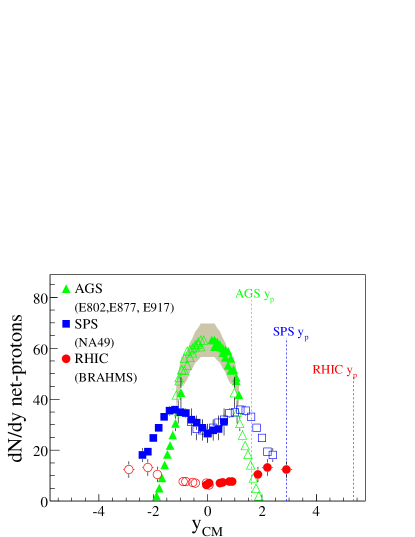
Figure 3 shows net–proton measured at AGS and SPS compared to these results. The distributions show a strong energy dependence, the net–protons peak at mid–rapidity at AGS, while at SPS a dip is observed in the middle of the distribution. At RHIC a broad minimum has developed spanning several units of rapidity, indicating that at RHIC energies collisions are quite transparent.
To calculate the rapidity loss, must be known from mid–rapidity to projectile rapidity, . BRAHMS measures to , so the shape of the rapidity distribution must be extrapolated to calculate . The baryon number of participating nucleons () is conserved, while the net–proton number is not necessarily conserved. To obtain net–baryons, the number of net–neutrons and net–hyperons have to be estimated and the contribution from weak decays included in the measured net–protons has to be deduced. Using MC simulations we find these contributions to be protons for each , and protons for each decay. There is a weak rapidity dependence which is included in the systematic error. The number of net–baryons is, then,
where are the primary number of net-neutrons (), net-protons(), net-lambdas(), and net-sigmas(), respectively, and is the measured net–proton yield. In addition to primaries, net-lambdas, includes contributions from other hyperons that decay to protons through s e.g. .
The ratio was found from HIJING Wang:1991ht and AMPT Zhang:1999bd in the rapidity interval . The equilibration of protons and neutrons close to mid–rapidity has been experimentally observed at AGS energies Barish:2001cf .
At mid-rapidity the ratio was found to be equal within statistical errors to at GeV Adcox:2002au . Those results indicate that . We use at GeV and find at the number of feed-down corrected protons and anti–protons to be and respectively, in agreement with the measurement at GeV by PHENIX : Adler:2003cb . Assuming that is constant over the full rapidity interval the feeddown correction for alone can be done as . At forward rapidity s have not been measured, and the conservative estimate is used.
The yield of and have not been measured at RHIC. In thermal models and Broniowski:2001uk at RHIC ( GeV), and is used here.
The final correction is . The systematic error on the final correction depends almost entirely on the error on and because the partial derivative of Eq. Nuclear Stopping in Au+Au Collisions at GeV with respect to and is very small for the numerical values used.
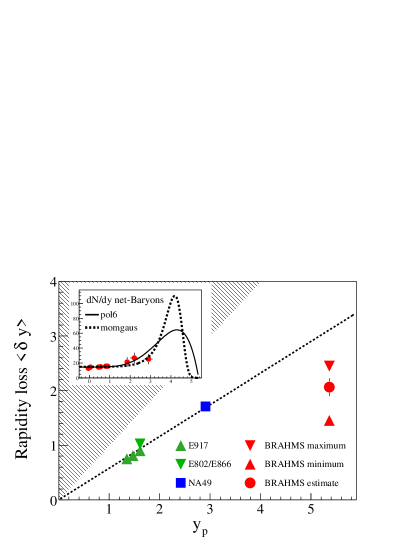
Figure 4 (insert) shows the net–baryon obtained from the measured net–proton . The net–baryon density in the rapidity region where BRAHMS has no acceptance can be constrained by the total integral, equal to , and since diffractive scatterings can be ignored in central collisions where each nucleon on the average experiences several scatterings, . To illustrate the extrapolation from the measured region, , to beam rapidity, , two different functions have been used: A six order symmetric polynomial (pol6) which is the simplest polynomial that describes the data points, has the correct integral, and , and a Bjorken inspired symmetric sum of 2 Gaussians in momentum space (momgaus), converted to rapidity space using where is the proton mass. The momgaus gives a simple description of the data as the product of the two fragmenting nuclei with no mid-rapidity source. The data are consistent with Bjorken’s picture of the collision where the fragmentation regions are far from mid–rapidity ( 3-4), but shows that there is still a significant number of baryons transported to mid–rapidity. From the momgaus fit a mean momentum of 31 GeV/ with a spread of 13 GeV/ is found. The rapidity loss is using the pol6 fit and for the momgaus fit, and the last value has been used as estimate in Fig. 4. From the pol6 fit there are net-baryons in the rapidity interval, , with a . If the remaining 118.5 net-baryons are placed at y=3.5, maximum , and , minimum , a conservative estimate for the possible range of values is obtained, also shown in Fig. 4. The rapidity loss at RHIC is clearly less than the phenomenological linear rapidity scaling would predict; this scaling is broken at RHIC.
Using the functional forms the total energy, , per net-baryon after the collision can be derived:
| (2) |
The is known for protons from the spectra in the covered rapidity interval. Linear and Gaussian extrapolations of to projectile rapidity changes by less than 5%. The energy is GeV for pol6 and GeV for the momgaus fits. Taking , GeV of the initial 100 GeV per participant is available for excitations. Using the same minimum and maximum estimates above : GeV.
In conclusion BRAHMS has measured proton, anti–proton, and net–proton yields from mid–rapidity () to forward rapidity (). The net–proton distribution shows that collisions at RHIC energies are quite transparent compared to lower energies. By extrapolation to the full net–baryon distribution, we find that the rapidity loss scaling observed at lower energy is broken and the rapidity loss seems to saturate between SPS and RHIC energies.
This work was supported by the division of Nuclear Physics of the Office of Science of the U.S. DOE, the Danish Natural Science Research Council, the Research Council of Norway, the Polish State Committee for Scientific Research and the Romanian Ministry of Research.
References
- (1) S. A. Bass et al., Nucl. Phys. A 661 (1999) 205.
- (2) S. Soff, J. Randrup, H. Stocker and N. Xu, Phys. Lett. B 551 (2003) 115.
- (3) S. A. Bass, B. Muller and D. K. Srivastava, Phys. Rev. Lett. 91 (2003) 052302.
- (4) W. Busza and A. S. Goldhaber, Phys. Lett. B 139 (1984) 235.
- (5) F. Videbaek and O. Hansen, Phys. Rev. C 52 (1995) 2684.
- (6) B. Hong et al. [FOPI Collaboration], Phys. Rev. C 57 (1998) 244 [Phys. Rev. C 58 (1998) 603].
- (7) B. B. Back et al. [E917 Collaboration], Phys. Rev. Lett. 86 (2001) 1970.
- (8) J. D. Bjorken, Phys. Rev. D 27 (1983) 140.
- (9) F. Karsch, Nucl. Phys. A 698 (2002) 199.
- (10) M. Adamczyk et al. [BRAHMS Collaboration], Nucl. Instr. and Meth. A 499 (2003) 437.
- (11) I. G. Bearden et al. [BRAHMS Collaboration], Phys. Rev. Lett. 88 (2002) 202301.
- (12) GEANT 3.2.1, CERN program library.
- (13) X. N. Wang and M. Gyulassy, Phys. Rev. D 44 (1991) 3501.
- (14) C. Adler et al. [STAR Collaboration], Phys. Rev. Lett. 87 (2001) 262302
- (15) L. Ahle et al. [E802 Collaboration], Phys. Rev. C 60 (1999) 064901.
- (16) J. Barette et al. [E877 Collaboration], Phys. Rev. C 62 (2000) 024901.
- (17) H. Appelshauser et al. [NA49 Collaboration], Phys. Rev. Lett. 82 (1999) 2471.
- (18) B. Zhang, C. M. Ko, B. A. Li and Z. w. Lin, Phys. Rev. C 61 (2000) 067901.
- (19) K. N. Barish et al., Phys. Rev. C 65 (2002) 014904.
- (20) K. Adcox et al. [PHENIX Collaboration], Phys. Rev. Lett. 89 (2002) 092302.
- (21) S. S. Adler et al. [PHENIX Collaboration], Submitted to Phys. Rev. C, arXiv:nucl-ex/0307022.
- (22) W. Broniowski and W. Florkowski, Phys. Rev. C 65 (2002) 064905