Present address: ]University of Illinois at Urbana–Champaign, Urbana, Illinois 61801, USA
Experimental study of –atomic and –molecular processes in pure helium and deuterium–helium mixtures
Abstract
We present experimental results of –atomic and –molecular processes induced by negative muons in pure helium and helium–deuterium mixtures. The experiment was performed at the Paul Scherrer Institute (Switzerland). We measured muonic x–ray series transitions relative intensities in atoms in pure helium as well as in helium–deuterium mixture. The muon stopping powers ratio between helium and deuterium atoms and the radiative decay probability of for two different helium densities in mixture were also determined. Finally, the probability for a atom formed in an excited state to reach the ground state was measured and compared with theoretical calculations using a simple cascade model.
pacs:
34.70.+e, 36.10.Dr, 39.10.+j, 82.30.FiI Introduction
The experimental study of atomic and molecular processes induced by negative muons captured in hydrogen and helium provides a test of many–body calculations Petitjean (2001) comprising different methods of atomic, molecular, and nuclear physics. In spite of about 50 years of experimental Bystritsky et al. (1995); Bystritsky (1995); Marshall et al. (2001); Nagamine (2001); Petitjean (1992) and theoretical Fesenko and Korenman (1996); Faifman and Men’shikov (2001); Cohen (1999); Markushin and Jensen (2001); Adamczak and Faifman (2001) studies for processes occurring in helium and deuterium, as well as helium–deuterium mixtures, there exist still some open questions. The most important are listed here:
-
–
direct atomic muon capture in –He mixtures ( and );
- –
- –
- –
-
–
ground state muon transfer from to helium via the intermediate molecular state, Bystritsky et al. (1983); Aristov et al. (1981); Tresch et al. (1998b); Kravtsov et al. (1993); Gartner et al. (2000), and the subsequent decay to the unbound state Bystritsky et al. (1995); Augsburger et al. (2003); Tresch et al. (1998a); Kino and Kamimura (1993); Czapliński et al. (1997).
In the case of a deuterium–helium mixture the molecule, created in collisions, has three possible decay channels:
| (1a) | |||||
| (1b) | |||||
| (1c) |
Here, is the molecular decay channel for the 6.85 keV –ray emission, for the Auger decay, and for the break–up process. The molecule is formed, with a rate , in either a or a rotational state ( denotes the total angular momentum of the three particles). The state is mostly populated at slow –He collisions. The deexcitation due to inner or outer Auger transition is also possible Czapliński et al. (1996a, 2002a, 2002b). In principle it competes with the decay processes of Eq. (1a), and can be followed by another decay due to nuclear deuterium–helium fusion from the state Bogdanova et al. (1998); Pen’kov (1997).
In this paper we present experimental results for fundamental characteristics of –atomic (MA) and –molecular (MM) processes in a mixture, namely the muon stopping power ratio, the probability, the radiative branching ratio for the radiative decay of the molecule (1aa), and delayed Lyman series transitions in atoms for two different target densities and at nearly constant helium concentrations. Results for relative intensities of series transitions in pure and for different target densities are also presented.
II Experimental conditions
A study of MA and MM processes mentioned above requires the simultaneous use of miscellaneous detectors appropriate for the detection of the muon beam, the muonic x rays of and atoms (formed in the target due to direct muon capture by the correspondent nuclei or due to muon transfer from hydrogen to helium), products of nuclear reactions occurring in complexes, and muon decay electrons. Detection of the latter is necessary not only for yield normalization but also for background reduction. This was realized by requesting that the muon survives atomic and molecular processes. Thus, muon decay electrons were detected within a certain time interval after the principal particle detection. For a precise measurement of the characteristics of MA and MM processes the detection system and the associated electronics should posses high energy and time resolutions.
The experiment was performed at the Paul Scherrer Institute (PSI) at the E4 muon channel. It is described in details in Refs. Boreiko et al. (1998); Knowles et al. (2001); Bystritsky et al. (2003). A schematic muon eyes view of the setup is given in Fig. 1.
The experimental setup was designed and developed to study nuclear reactions in charge asymmetric muonic molecules such as Knowles et al. (2001); Maev et al. (1999a); Czapliński et al. (1996b); Czapliński et al. (1998); Pen’kov (1997); Bogdanova et al. (1999, 1998); Bystritsky and Pen’kov (1999); Bystritsky et al. (1999b):
| (2) |
Charged muon–capture products were detected by three silicon telescopes located directly in front of the kapton windows but still within the cooled vacuum environment (SiUP, SiRI, and SiDO). Muon decay electrons were detected by four pairs of plastic scintillator counters (ELE, EUP, ERI, EDO) placed around the target. The cryogenic target body was made of pure aluminium and had different kapton windows in order to detect in particular
-
–
the MeV/c momentum muon beam,
-
–
the 6.85 keV rays emitted via the radiative decay given in Eq. (1aa),
-
–
the x–ray Lyman series transitions from the deexcitation ( at 8.2 keV, at 9.6 keV, and at 10.2 keV).
The 0.17 cm3 germanium detector (GeS) used for the and x–ray detection was placed just behind a 55 m thick kapton window.
The experiment includes four groups of measurements as depicted in Table 1. The first two groups, I and II, are and measurements at different temperatures and pressures. The remaining measurements, III and IV, were performed with mixtures at two different densities. The density is normalized to the liquid hydrogen density (LHD), . Run III was by far the longest run because its original purpose was to measure the fusion rate in the molecule, Eq. (2), and the muon transfer rate from atoms to nuclei Knowles et al. (2001). The germanium detector energy calibration was carried out during the data taking period using standard sources, namely 60Co, 57Co, 55Fe, and 137Cs.
| Run | Gas | Temp. | Pressure | |||
| [K] | [atm] | [LHD] | [%] | [106] | ||
| I | 32.9 | — | — | 100 | — | |
| Ia | 6.92 | 0.0363 | 640.4 | |||
| Ib | 6.85 | 0.0359 | 338.1 | |||
| Ic | 6.78 | 0.0355 | 375.3 | |||
| Id | 6.43 | 0.0337 | 201.7 | |||
| II | — | — | — | 100 | — | |
| IIa | 20.3 | 12.55 | 0.1060 | 239.4 | ||
| IIb | 19.8 | 9.69 | 0.844 | 554.1 | ||
| IIc | 20.0 | 4.52 | 0.039 | 32.3 | ||
| 32.8 | — | — | 4.96 | — | ||
| III | 5.11 | 0.0585 | 4215.6 | |||
| IV | 12.08 | 0.1680 | 2615.4 |
III Method of the measurement
The MA and MM processes occurring in mixtures after the muon has stopped in a target volume is explained in detail in Ref Bystritsky et al. (2003). The main characteristics are shown in Fig. 2. Depending on the time elapsed after a muon stop in a mixture one can distinguish between prompt and delayed MA processes.
The following processes are considered as prompt ones:
- –
-
–
the formation of excited muonic atoms, , , s Jensen and Markushin (2001);
-
–
the cascade transitions in and muonic atoms, s Koike (2001);
- –
The delayed processes are:
- –
- –
III.1 Pure helium
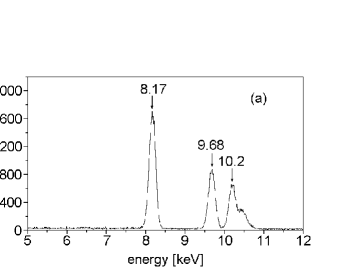
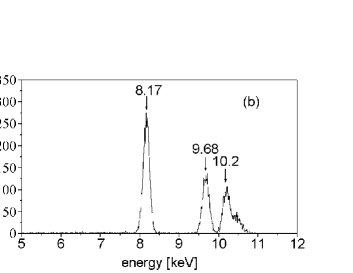
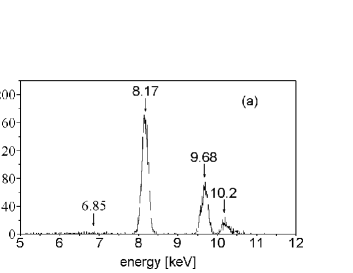
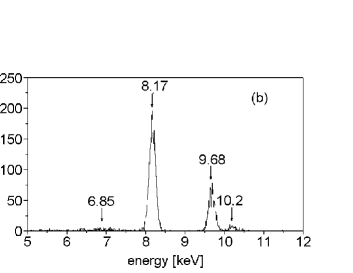
One of the main characteristics of MA processes occurring in pure helium are absolute and relative intensities of muonic series x–ray transitions in atoms. Their knowledge provides important information about the excited states initial population of the atoms and the dynamics of deexcitation. According to the above given classification of MA processes and the conditions of runs I and II it is clear that only prompt series transitions from were observed. Events detected by the germanium detector within a time range around time (defined as the muon stop time) were classified as prompt. The chosen time range is a consequence of the detector and its related electronic time resolution. The relative intensities, , of the lines () are:
| (3) |
where are the yields of lines with energies 8.17 keV, 9.68 keV, and 10.2 keV, respectively. These yields are determined as follows:
| (4) |
with being the total yield of all lines. The quantities are the prompt events numbers corresponding to the lines. are the total attenuation coefficients of the corresponding lines and are the corresponding detection efficiencies. The intensity is the cumulative photon yield of the Lyman series .
In fact, only detection efficiency ratios are required for the determination of the relative intensities. Therefore Eq. (3) can be rewritten as
| (5) |
with
| (6) |
being the total yield normalized to the detection efficiency . This fact significantly increases the accuracy of measured in experiment. The corresponding errors were mainly due to insufficient knowledge of the respective attenuation coefficients. One can expect, however, that attenuation coefficients, as compiled in Ref. Storm and Israel (1970), differ only slightly because the differences between energies of lines ( keV, keV) are relatively small. Recent experimental results also confirmed this assumption (see Refs. Augsburger et al. (2003); Gartner et al. (2000)).
The detection efficiencies, are determined using Eqs. (3) and (4) via
| (7) |
where is the number of muons stopping in helium, given in Table 1. For an accurate determination of the series transitions attenuation coefficient we performed Monte Carlo (MC) calculations taking into account the experimental geometry and all material layers placed between the x–ray emission and the germanium detector. The total attenuation coefficient of each line includes the x–ray attenuation while passing through the gas, the target and chamber kapton window, and through the germanium detector Be window taken from Ref. Hubbell (1982). We obtained , , and .
A significant reduction of the germanium detector background was achieved by using delayed coincidences between x rays and electrons. This method is called the “del-” criterion. Ground state muonic helium atoms disappear mainly by muon decay,
| (8) |
and by nuclear muon capture (with proton, deuteron, or triton emission Maev et al. (1996); Philips et al. (1975); Bystritsky et al. (2003)). The average disappearance rate is
| (9) |
where and Maev et al. (1996). Thus, delayed electrons were measured during a time interval corresponding to two atom life times (s Suzuki et al. (1987)).
The relative intensities of lines, , detected in coincidences with muon decay electrons, are given by
| (10) |
with
| (11) |
where are the number of events in pure helium detected by the germanium detector in coincidence with muon decay electrons within a fixed time interval , with and the time of the germanium and decay electron counters, respectively. Both times are measured relative to the muon stop time . is the detection efficiency of muon decay electrons and the time factor
| (12) |
is the probability that a muon decays in the ground state of during the time interval .
It should be noted, that the coefficient is not required as an absolute number for the determination of the intensities as it enters the numerator and denominator of Eq. (10) in the same manner. However, it is needed for the analysis. The quantity is determined by comparing Eqs. (5) and (10) yielding
| (13) |
Another interesting problem is the study of atoms in excited metastable states. One can expect, according to Refs. Cohen (1982); von Arb et al. (1984); Eckhause et al. (1986); Cohen and Struense (1988), that the atom population varies between 5% and 7% under our experimental conditions for runs I and II. The two possible channels of deexcitation are two–photon transition with a rate Johnson (1972); Bacher (1984) and the Stark deexcitation Cohen (1982); von Arb et al. (1984); Eckhause et al. (1986) induced by collisions of atoms with the surrounding atoms or molecules. The corresponding rate for the experimental conditions of runs I and II is . If the time of Stark induced transitions is shorter than the resolution time of the germanium detector the corresponding transition would be experimentally classified as a prompt event. Otherwise, it would be possible to extract an upper bound for Stark induced transition rates.
III.2 mixtures
In a mixture one observes lines arising from the deexcitation of atoms formed not only due to direct muon capture by helium nuclei (as in pure helium) but also due to muon transfer from muonic deuterium to helium. Because the atoms deexcitation time is of the order (under our experimental conditions) the corresponding emission of series transitions occurs practically immediately after a muon stop in the mixture and can be classified as a prompt event. Muons are captured by and according to the capture law Bystritsky et al. (1995). Information about relative rates of atomic muon capture by deuterons and helium nuclei in a mixture as well as the probability that an excited atom reaches its ground state when the muon also has the possibility of transferring directly from an excited state to a heavier nucleus, in our case helium ( probability) is of unquestionable importance for understanding kinetics in muon catalyzed fusion (CF). A method for determining the characteristics of MA processes in mixture is presented in the following subsections.
III.2.1 Muon stopping powers ratio
A muon entering the mixture may be captured by deuterium or helium into atomic orbits of excited or atoms. The corresponding relative probability has the following form Kottmann (1993, 1987); Korenman et al. (1990/91); Bubak and Bystritsky (1986); Hartmann (1990)
| (14) |
where is the relative atomic helium concentration in the mixture and is the muon stopping power ratio,
| (15) |
with and the ionization energy loss of muon per one atom of helium and deuterium.
The muon stopping power ratio may be experimentally determined from the yield of electrons produced in muon decay processes in pure helium and in mixture. However, the same constant momentum of the muonic beam must be kept during expositions with both targets. The experiment relies upon the determination of a density of a pure helium target, , (by variation of the target density) such that the number of muon stops in the target (and consequently the number of electrons arising from muons decaying from the and ground state atoms) is the same as the one obtained for a given mixture. Under this condition the moderation thickness of the pure helium target is the same as the one of the mixture with density and helium concentration , given in Table 1, run III. Using Eq. (14) one can determine the corresponding equivalent density of the pure helium target as
| (16) |
where is the atomic density of the mixture normalized to LHD and and are the relative deuterium and helium concentrations .
Analogously, one can use a pure deuterium target instead of the helium one to determine the equivalent deuterium target density . Then, equating numbers of electrons detected in runs with pure deuterium and in the target one can obtain the equivalent density, , and hence the coefficient
| (17) |
It should be noted, however, that a determination of from Eq. (17) with the same accuracy as from Eq. (16) requires a significantly greater helium concentration in the mixture.
III.2.2 The probability
Prompt Lyman series transitions in atoms are also observed in a mixture. As mentioned previously, they originate from direct muon capture by deexcitation of atoms or by muon transfer from excited muonic deuterium to helium. However, the relative intensities of series transitions measured in a mixture differ from the ones in pure helium because effective reaction rates of deexcitation processes depend on the target conditions.
represents the atom probability to reach the ground state in a mixture and is defined as
| (18) |
where is the number of atoms created in the excited state due to direct muon capture in deuterium atoms, and is the number of the atoms which reach the ground state during the cascade. The number of atoms created in the excited state can be written as
| (19) |
where represents the number of muon stops in the gas mixture.
Since our setup is not able to measure , we used another method to determine . The number of atoms formed in excited states due to muon transfer from to helium, , is and corresponds to
| (20) |
The total number of atoms created in the excited states and emitting prompt lines is given by the yield
| (21) |
On the other hand, is the number of atoms formed in the excited states in a mixture due to direct muon capture by helium atoms
| (22) |
Isolating in Eq. (20), using Eqs. (19) and (22), we obtain the probability as
| (23) |
In the case of detecting events by the germanium detector in coincidence with muon decay electrons, the total yield in Eq. (23) has to be replaced by
| (24) |
III.2.3 Radiative molecular peak
The delayed muonic x rays are generated by two different mechanisms initiated by atoms in their ground state. The first mechanism described in this section is simply molecular muon transfer, specifically Eq. (1aa) accompanied by a 6.85 keV –rays. Experimental molecular muon transfer from muonic deuterium to helium is presented in detail in many papers, in particular in Refs. Czapliński et al. (1996a); Bystritsky et al. (2003) together with the corresponding reaction rates. Below radiative decay rate of the complex Eq. (1aa) can be measured as follows.
The time distribution of the rays (relative to the muon stop time) falls (in a pure target) experimentally off with the disappearance rate of the muonic deuterium ground state, ,
| (25) |
with the amplitude and
| (26) | |||||
is the molecular formation rate for the molecule, is the free muon decay rate. is the effective molecule formation rate, the relative probability of nuclear fusion in with neutron production in the final channel and is the muon sticking probability to helium produced in nuclear fusion (see Bystritsky et al. (2003)).
The probability of the radiative decay of the system (corresponding to the transition) is defined by
| (27) |
where , , and are the reaction rates for the molecular decay according to channels (a), (b) and (c) of Eq. (1a), respectively, also shown in Fig. 2. The formation of the molecule practically coincides with the subsequent –ray emission because of the very short average life–time of molecule ( Bystritsky et al. (1995); Augsburger et al. (2003); Tresch et al. (1998a); Gartner et al. (2000); Kino and Kamimura (1993)).
In the present experiment only the radiative decay channel is detected. The corresponding probability is determined by the ratio
| (28) |
where and are the total number of molecules formed in the mixture and the number of molecules subsequently decaying via the radiative channel, Eq. (1aa), respectively). The latter quantity may be expressed as
| (29) |
where is the number of 6.85 keV -rays during time elapsed after a muon stop and is the corresponding detection efficiency. The factor
| (30) |
is the –ray detection time factor and is the 6.85 keV –ray attenuation coefficient. For the rays detected with the del- criterion, a corresponding value is obtained using Eq. (29) divided by the coefficients.
A comparison of the value measured with and without del- criterion provides also a test for the validity of our coefficients , , and . The detection efficiency was determined by MC simulations including feasible space distributions of muon stops in the target volume and experimental detection efficiencies of lines for the pure runs.
The total number of the molecules formed in mixture is determined by analyzing the 6.85 keV –ray time distribution. It is expressed as
| (31) |
where is the number of atoms formed via direct muon capture and reached the ground state after deexcitation. By measuring the exponential time distribution (25) and using the known quantities Balin et al. (1984a, b); Vorobyov (1988) one can determine the molecular formation rate from Eq. (26). The determination of from Eq. (31) requires in addition the knowledge of , isolated in Eqs. (18) and (19). By substituting and into Eq. (28) one finally obtains the probability.
III.2.4 Delayed series transitions from muonic helium
As already said, the delayed muonic x rays are generated by two different mechanisms initiated by the ground state atoms. The second one discussed here is proceeded by formation (in collision of with molecule) and subsequently by nuclear fusion. Muons freed after fusion form excited muonic helium atoms due to direct muon capture by helium or due to muon capture by deuterium and subsequent muon transfer to helium. Then the delayed x rays of muonic helium series transitions are observed.
The time distribution is also determined by . Besides, the relative intensities (or ) of the delayed series transitions are assumed to be the same as those of the prompt radiation of lines. It is worthwhile to note that the measurement of the corresponding absolute intensities enabled us to determine the third component of in Eq. (26) and, consequently, to extract the effective formation rate of the molecule in the mixture using the coefficients (also obtained in this paper) and average values for , and (taken from Refs. Balin et al. (1984a, b); Vorobyov (1988)).
IV Analysis
IV.1 Relative intensities of series transitions
| Yield | |||||||||
|---|---|---|---|---|---|---|---|---|---|
| Range [keV] | |||||||||
| Runs | |||||||||
| I () | 34 319(190) | 4785(70) | 17 835(139) | 2551(52) | 20 045(150) | 2834(54) | 7.536(90) | 3.795(53) | 4.231(62) |
| IIa () | 7295(87) | 985(32) | 4919(72) | 688(26) | 2616(55) | 408(20) | 0.897(14) | 0.585(10) | 0.309(8) |
| IIb () | 11 587(111) | 1593(40) | 7547(91) | 1009(32) | 4627(76) | 613(25) | 1.766(25) | 1.126(18) | 0.677(13) |
| IIc () | 1303(38) | 174(14) | 709(29) | 91(10) | 846(33) | 123(12) | 0.287(9) | 0.151(6) | 0.178(7) |
| [%] | [%] | [%] | [%] | [%] | [%] | |
|---|---|---|---|---|---|---|
| I () | 48.4(8) | 47.8(9) | 24.4(4) | 24.8(6) | 27.2(4) | 27.4(6) |
| IIa () | 50.0(9) | 47.3(19) | 32.7(7) | 33.1(14) | 17.3(5) | 19.6(13) |
| IIb () | 49.5(9) | 49.5(15) | 31.5(6) | 31.4(11) | 19.0(5) | 19.1(8) |
| IIc () | 46.6(18) | 44.8(44) | 24.5(11) | 23.5(29) | 28.9(13) | 31.7(35) |
| Augsburger et al. Augsburger et al. (2003) () | 46.9(45) | — | 27.9(28) | — | 25.2(19) | — |
| Tresch et al. Tresch et al. (1998a)111for () and for () | 47.0(2) | — | 20.3(10) | — | 32.7(16) | — |
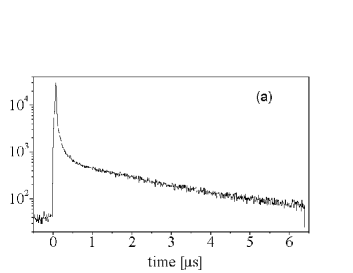
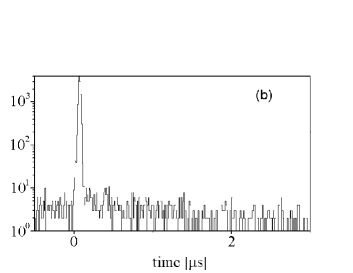
To obtain the relative intensities of muonic x–ray series transitions of and atoms in helium targets we analyzed the corresponding energy and time distributions detected by the germanium detector in runs I and II. Figures 3 and 4 present the energy and time distributions obtained in runs I with and without muon decay electrons coincidences. As seen, the del- criterion significantly suppresses the background level and improved the signal–to–background ratio. As already mentioned before, events detected within a time interval s relative to muon stops were classified as prompt ones. The prompt lines events were determined by fitting the experimental amplitude distributions by a Gaussian distribution
| (32) |
where is the mean value of the corresponding line energy, the standard deviation for the line and the normalization constant. The germanium detector background is taken into account by a straight line, with and being the constants. Results obtained in measurements I and II are presented in Tables 2 and 3. Statistical errors are quoted in parentheses throughout the whole text.
The analysis performed for both mixtures is similar. The prompt intensities are measured within the same time interval as for the pure helium runs, both with and without the delayed electron coincidence condition. The results, given in Table 5, depend on the pressure of the mixture. For comparison, results of Augsburger et al. Augsburger et al. (2003) taken at a similar pressure as in run III, are also shown in the table. The differences in relative intensity between pure helium and the deuterium–helium mixtures are essentially due to excited state transfer. Additionally, such an analysis allows us to determine the transition energy differences between the two helium isotopes. The energy differences are given in Table 4. A theoretical prediction exists for the transition Rinker (1976) which is slightly lower than our measured value.
| Transitions | [eV] | ||
|---|---|---|---|
| Our work | Tresch et al. Tresch et al. (1998a) | Rinker Rinker (1976) | |
| 74.2 | |||
| — | |||
| — | |||
| Runs | III | IV | Augsburger et al. Augsburger et al. (2003) | ||
|---|---|---|---|---|---|
| Transitions | full | del- | full | del- | |
| 66.4(7) | 65.7(15) | 72.0(6) | 72.9(16) | 68.6(51) | |
| 26.6(5) | 26.5(8) | 24.5(3) | 24.1(8) | 24.5(19) | |
| 7.0(4) | 7.8(4) | 3.5(1) | 3.0(3) | 6.9(6) | |
IV.2 Stopping power ratio measurement
The stopping power ratio was determined by analyzing the time spectra of muon decay electrons measured by the scintillator pairs in the runs with pure helium (run I) and the mixture (run III). Measurements with pure helium were performed to find a corresponding equivalent density (see Eq. (16) resulting in the same number of muon stops in the target volume as the one in the mixture (run III). Variation of the helium target density enabled us to find a density dependence of muon stops and hence . The stopping power ratio was the determined according to Eq. (16). Note that the linear density dependence of muon stops in gases is a good approximation, if the gaseous mixture thickness expressed in terms of energy is significantly greater than the energy dispersion of the muon beam. This condition is fulfilled in our experiments.
Due to muons stopping also in aluminum and gold (target walls) besides in the gas, the electron time spectra are a sum of exponential functions:
| (33) | |||||
where , , and are the corresponding normalization amplitudes and
| (34) | |||||
are the muon disappearance rates in the different elements (the rates are the inverse of the muon lifetimes in the target wall materials). The nuclear capture rates in aluminum and gold, s-1 and s-1, are known Suzuki et al. (1987). and are the Huff factors, which take into account that muons are bound in the state of the respective nuclei when they decay. This factor is negligible for helium but necessary for aluminum and important for gold Suzuki et al. (1987). The constant characterizes the random coincidence background.
By measuring the helium amplitude, ,
| (35) |
and knowing the electron detection efficiencies averaged over the energy distributions (), one obtains the number of muons stopping in helium .

Figure 5 shows the time distribution of the muon decay electrons measured in run I with the three exponential fit (Eq. (33)). The ratio of muons stopped in the target, i.e., the number of detected electrons , divided by the number of muons entering the target
| (36) |
depends on the helium density. Table 6 shows the measured values of in percent for each measurements. By fitting as a function of , one obtains
| (37) |
The value of was determined from the condition
| (38) |
where and are the ratios for pure (at the density ) and for the mixture, respectively. We found
| (39) |
The corresponding value of , using Eq. (16), is then
| (40) |
| Run | ||||
|---|---|---|---|---|
| [LHD] | ||||
| Ia | 1362.5 | 103.8(4) | 7.62(3) | 0.0363 |
| Ib | 704.3 | 54.3(3) | 7.72(4) | 0.0359 |
| Ic | 750.7 | 58.2(3) | 7.75(4) | 0.0355 |
| Id | 413.6 | 32.5(2) | 7.85(6) | 0.0337 |
| III | 8875.2 | 683.6(11) | 7.70(1) | 0.0585 |
The muon stopping power ratio of helium to deuterium atoms coincides (within the experimental errors) with the results of Refs. Kottmann (1993); Bystritsky et al. (1993) obtained under quite different experimental conditions. Our rather large relative errors, , are a consequence of small statistics and the relatively small range of variations of and target densities.
IV.3 probability
On of the main aim of runs III and IV was a measurement of the probability. In order to determine this quantity it was necessary to know (according to Eqs. (18)-(23)) the muon stopping power ratio , the prompt series transition yields of atoms in pure and in mixtures, and , and the numbers of muon stops in pure and in mixtures, . Significant background reduction was achieved by using the del- criterion. The results are presented in Table 7. Note the excellent agreement between full statistics and del- analysis.
| Runs | Statistics | |||
|---|---|---|---|---|
| III | full | 35 376(270) | 7.70(15) | 0.882(18) |
| del- | 4968(72) | 7.60(29) | 0.885(21) | |
| IV | full | 37 402(205) | 5.71(11) | 0.844(20) |
| del- | 5161(75) | 5.85(23) | 0.838(23) |
Figure 6 shows the energy dependence of the theoretical values versus collision energy calculated for runs III and IV in the framework of the simple cascade model Bystritsky et al. (1999a); Bystritsky et al. (2000, 1999c) and compares then with experiment. The model assumes that the kinetic energy of atoms remains unchanged during deexcitation. The value is determined from deexcitation and muon transfer to helium. A complicated interplay between these two processes is described by a system of linear first order differential equations for level populations, , with . The is defined as
| (41) |
The deexcitation scheme is taken from Ref. Bystritsky et al. (1999a) and the corresponding reaction rates are collected in Refs. Bystritsky et al. (1999a); Bystritsky et al. (2000).

As seen from Fig. 6, the experimental values of coincide with the theoretical ones for an average –He collision energy around 8 eV. Note the pronounce difference between the experimental values of and the theoretical ones corresponding to fully thermalized atoms. However, more refined theoretical calculations of based on Monte Carlo simulations of acceleration of atoms due to deexcitation processes and muon transfer to helium as well as thermalisation due to elastic collisions are required to arrive at definite conclusions. It should also be noted that experimental results presented in this paper agree with earlier ones (see Ref. Bystritsky et al. (1990/91)). On the other hand, analogous comparison with results presented in Refs. Kottmann (1993); Augsburger et al. (2003); Tresch et al. (1998a); Kottmann (1987) is not possible due to significantly different helium concentrations and densities.
IV.4 Radiative branching ratio
The experimental method to determine the radiative decay branching ratio is described in Sec. III.2.3. Energy and time distributions of prompt and delayed events detected in runs III and IV with muon decay electron coincidences are presented in Figs. 7 to 9.
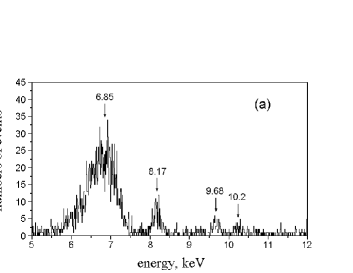
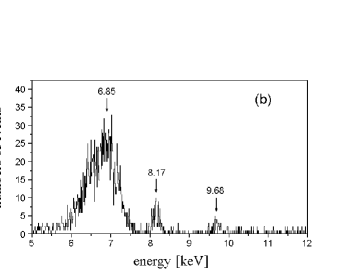
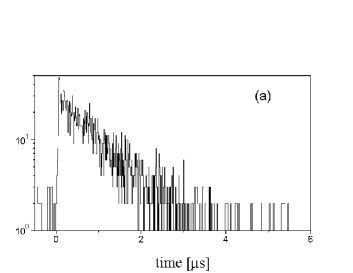
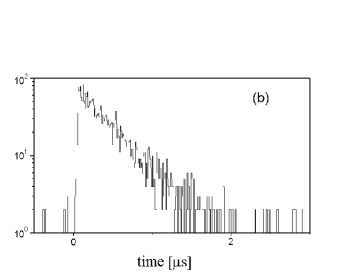
To determine the and rates (see Eq. (26)) the –ray time distributions were fitted within the energy range keV using the expression
| (42) | |||||
where , , and are the normalization constants of the different target elements. and are the constants describing the germanium background.
The results of runs III and IV for the muonic deuterium ground state disappearance rate and the molecular formation rate , using Eq. (26), are shown in Table 8. The averaged value , where the errors include statistical as well as systematic errors is consistent with the measurement of Maev et al. Maev et al. (1999b), but is in disagreement with the work of Gartner et al. Gartner et al. (2000).
| Runs | ||
|---|---|---|
| III | ||
| IV | ||
| Average | ||
| Maev et al. Maev et al. (1999b) | , 111at 50 K and 39.5 K, respectively | |
| Gartner et al. Gartner et al. (2000) |
According to Eq. (28) the determination of the branching ratio requires the knowledge of both the total number of molecules formed in a mixture and the number of ’s decaying via the radiative channel, Eq. (1aa). The corresponding numbers and were determined using Eqs. (29) and (31). The rays were measured during a time and the del- time interval was . The detection efficiency was determined using detection efficiencies of atom series transitions in runs I and II by a MC simulation. This MC calculation took into account the attenuation of rays passing through all layers between the germanium detector and the gas. The time factors for the electrons and for the rays are slightly different for both runs, and for run III, and and for run IV. All results are presented in Table 9.
| Parameter | Units | Run III | Run IV | ||
|---|---|---|---|---|---|
| full | del- | full | del- | ||
| [s] | |||||
| [s] | – | – | |||
| 17.42(21) | 2.15(6) | 20.07(23) | 2.63(7) | ||
| 20.81(136) | 20.86(136) | 16.50(70) | 16.41(72) | ||
| 4.20(10) | 4.37(17) | 3.76(10) | 3.53(18) | ||
| 4.15(8) | 5.76(15) | 6.26(19) | 8.72(32) | ||
| 0.203(14) | 0.209(17) | 0.228(12) | 0.213(15) | ||
The values obtained in the present experiment for two different densities differ somewhat from the experimental result of Ref. Augsburger et al. (2003), i.e., performed under slightly different experimental conditions . Our results differ slightly from the calculated value in Ref. Czapliński et al. (1997) for a total angular momentum of the complex. However, they are in a good agreement with the calculations of Refs. Kino and Kamimura (1993); Belyaev et al. (1996) for a total angular momentum .
A close comparison of the existing theoretical results for , Kino and Kamimura (1993); Gershtein and Gusev (1993); Kravtsov et al. (1993); Czapliński et al. (1997); Belyaev et al. (1995, 1996), with their experimental results obtained in the present paper and in Ref. Augsburger et al. (2003) may throw some light on the mechanism of rotational transitions of molecules in the state, labeled in Fig. 2. Specifically, two different mechanism of the transition were proposed in Refs. Czapliński et al. (1996a, 2002a, 2002b) and Bogdanova et al. (1998). Both mechanisms start with an Auger transition in a collision,
| (43) |
The first mechanism Czapliński et al. (1996a, 2002a, 2002b) consists of a two stage process, namely the formation of a neutral complex in the collision
| (44) |
followed by a subsequent deexcitation due to external Auger effect
| (45) |
In the second mechanism Bogdanova et al. (1998), the transition involves a number of molecular processes. However, the corresponding transition rate is essentially determined by a molecular cluster formation
| (46) |
and a subsequent inner electron conversion
| (47) |
The first mechanism yields an effective transition rate
| (48) |
the second mechanism gives
| (49) |
(see Refs. Bystritsky and Pen’kov (1999); Bystritsky et al. (1999b)). The effective decay rates are defined as
| (50) |
for both rotational states, and .
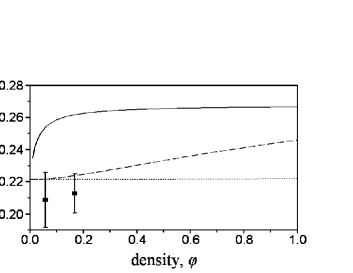
Because the effective transition rate is model dependent, the ratio may allow us to check the validity of both models. A proposal for a corresponding experiment was presented in Refs. Bystritsky and Pen’kov (1999); Bystritsky et al. (1999b). It exploits the –dependence of the probability for the radiative decay ratio . An unequivocal identification of the transition mechanism should be possible by measuring the 6.85 keV –ray yields for a series of different densities of mixtures. The density dependence of normalized to a single molecule is
| (51) |
Here, the decay rates Czapliński et al. (1997), , and (obtained by averaging the corresponding results taken from Refs. Kino and Kamimura (1993); Gershtein and Gusev (1993); Kravtsov et al. (1993); Korobov et al. (1993); Belyaev et al. (1997); Czapliński et al. (1997); Ishida et al. (1993); Belyaev et al. (1995, 1996)) are model independent. Concerning the first mechanism, we used Czapliński et al. (1996a), and Czapliński et al. (2002a, b). For the second mechanism, we used and Bogdanova et al. (1998). All density dependent rates are normalized to LHD.
As can be seen from Fig. 10, our experimental values of are in better agreement with the theoretical results corresponding to the first mechanism as described in Czapliński et al. Czapliński et al. (1996a, 2002a, 2002b). More refined calculations of the transition including realistic interaction potentials have however to be performed before definite conclusions can be drawn. Calculations in Refs. Czapliński et al. (2002a, b) go in this sense but withing the framework of a semi–classical treatment. Such a treatment seems rather problematic considering the collision energies in such a system. More accurate, i.e., purely quantum calculations are now in progress.
IV.5 Delayed series transitions of atoms
| Run | Units | III | IV |
|---|---|---|---|
| [s] | |||
| [s] | |||
| [%] | 0.605(75) | 0.728(85) | |
| [%] | 0.185(47) | 0.160(48) | |
| [%] | 0.209(62) | 0.112(60) |
The relative intensities and of delayed series transitions were determined by measuring the events during a time interval after the muon stop (see Table 10). The corresponding relative intensities were obtained from the ratios
| (52) |
Our results should, in principle, coincide with the prompt intensities of series transitions if we assume that the incoming muon energy distribution as well as the primary atom excited states distribution due to direct muon capture are the same as the corresponding ones for muons freed after the fusion. The observed prompt relative intensities of the corresponding series transitions (see Table 3) are however somewhat different from the delayed ones indicating that the above conditions are probably not fulfilled.
V Conclusions
The measured relative intensities of line muonic x rays in and atoms (see Tables 3 and 5) agree very well with other experiments. Only slight variation due either to the isotope or to the pressure are visible. The stopping power ratio of helium to deuterium atoms is also in good agreement with earlier work Kottmann (1993); Bystritsky et al. (1993).
Regarding the probability for a atom to reach its ground state in a mixture at two different densities, our results are
| (53) |
in agreement with theoretical calculations for an average collision energy around 8 eV.
As for the molecular formation rate for both our mixtures, our averaged value is
| (54) |
Our result agrees very well with the measurement of Maev et al. Maev et al. (1999b), but is in disagreement with the work of Gartner et al. Gartner et al. (2000). This difference has not yet been understood.
Concerning the radiative decay branching ratio for , also measured for two different densities of the mixture, the measured values,
| (55) |
are the same for both densities, but disagree with the recent results by Augsburger et al. Augsburger et al. (2003), , measured at a density approximately two times bigger, namely .
Finally, the relative intensities of the delayed series transitions of atoms, due to direct muon capture or due to muon transfer from deuterium to helium, after the muons were freed after fusion were also measured. They differ from the prompt relative intensities, probably due to a different primary distribution of excited states.
In conclusion, we were able to measure various interesting characteristics of muon atom (MA) and muonic molecule (MM) processes occurring in pure helium and in mixtures with good accuracy. This was possible by exploiting different germanium detectors for –ray detection in a wide energy range , silicon Si(d) telescope for the detection of charged particles coming from nuclear fusion or nuclear muon capture on and muon decay electron detectors. The self consistent methods increased the reliability of the presented results. Further measurements of quantities such as the muon stopping ratio , the probability, and the branching ratio in wider range of target densities and helium concentrations should significantly improve the accuracy of the corresponding values and clarify the complicated picture of muonic processes occurring in deuterium–helium targets.
Acknowledgements.
This work was supported by the Russian Foundation for Basic Research, Grant No. 01–02–16483, the Polish State Committee for Scientific Research, the Swiss National Science Foundation, and the Paul Scherrer Institute.References
- Petitjean (2001) C. Petitjean, Hyp. Interact. 138, 191 (2001).
- Bystritsky et al. (1995) V. M. Bystritsky et al., Yad. Fiz. 58, 808 (1995), [Phys. At. Nucl. 58, 746–753 (1995)].
- Bystritsky (1995) V. M. Bystritsky, Yad. Fiz. 58, 688 (1995), [Phys. At. Nucl. 58, 631–637 (1995)].
- Marshall et al. (2001) G. M. Marshall et al., Hyp. Interact. 138, 203 (2001).
- Nagamine (2001) K. Nagamine, Hyp. Interact. 138, 5 (2001).
- Petitjean (1992) C. Petitjean, Nucl. Phys. A 543, 79c (1992).
- Fesenko and Korenman (1996) G. A. Fesenko and G. Y. Korenman, Hyp. Interact. 101/102, 91 (1996).
- Faifman and Men’shikov (2001) M. P. Faifman and L. I. Men’shikov, Hyp. Interact. 138, 61 (2001).
- Cohen (1999) J. S. Cohen, RIKEN Review 20, 8 (1999).
- Markushin and Jensen (2001) V. E. Markushin and T. S. Jensen, Hyp. Interact. 138, 71 (2001).
- Adamczak and Faifman (2001) A. Adamczak and M. P. Faifman, Phys. Rev. A 64, 052705 (2001).
- Markushin (1994) V. E. Markushin, Phys. Rev. A 50, 1137 (1994).
- Bystritsky et al. (1996) V. M. Bystritsky et al., Phys. Rev. A 53, 4169 (1996).
- Jensen and Markushin (2001) T. S. Jensen and V. E. Markushin, Hyp. Interact. 138, 113 (2001).
- Popov and Pomerantsev (2001) V. P. Popov and V. N. Pomerantsev, Hyp. Interact. 138, 109 (2001).
- Bystritsky et al. (2000) V. M. Bystritsky et al., Eur. Phys. J. D 8, 75 (2000).
- Bystritsky et al. (1999a) V. M. Bystritsky, W. Czapliński, and N. Popov, Eur. Phys. J. D 5, 185 (1999a).
- Kravtsov and Mikhailov (1994) A. V. Kravtsov and A. I. Mikhailov, Phys. Rev. A 49, 3566 (1994).
- Sakamoto et al. (1999) S. Sakamoto, K. Ishida, T. Matsuzaki, and K. Nagamine, Hyp. Interact. 119, 115 (1999).
- Augsburger et al. (2003) M. Augsburger et al., Phys. Rev. A 68, 022712 (2003).
- Kottmann (1993) F. Kottmann, in Muonic Atoms and Molecules, edited by L. A. Schaller and C. Petitjean (Birkhäuser Verlag, CH–4010, Basel, 1993), pp. 219–233, [Proceedings of the Int. Workshop on Muonic Atoms and Molecules, Ascona].
- Tresch et al. (1998a) S. Tresch et al., Phys. Rev. A 58, 3528 (1998a).
- Lauss et al. (1996) B. Lauss et al., Phys. Rev. Lett. 76, 4693 (1996).
- Bystritsky et al. (1983) V. M. Bystritsky et al., Zh. Eksp. Teor. Fiz. 84, 1257 (1983), [Sov. Phys. JETP 57, 728–732 (1983)].
- Aristov et al. (1981) Y. A. Aristov et al., Yad. Fiz. 33, 1066 (1981), [Sov. J. Nucl. Phys. 33, 564–568 (1981)].
- Tresch et al. (1998b) S. Tresch et al., Phys. Rev. A 57, 2496 (1998b).
- Kravtsov et al. (1993) A. V. Kravtsov, A. I. Mikhailov, and V. I. Savichev, Hyp. Interact. 82, 205 (1993).
- Gartner et al. (2000) B. Gartner et al., Phys. Rev. A 62, 012501 (2000).
- Kino and Kamimura (1993) Y. Kino and M. Kamimura, Hyp. Interact. 82, 195 (1993).
- Czapliński et al. (1997) W. Czapliński, A. Kravtsov, A. Mikhailov, and N. Popov, Phys. Lett. A 233, 405 (1997).
- Czapliński et al. (1996a) W. Czapliński, M. Filipowicz, E. Guła, A. Kravtsov, A. Mikhailov, and N. Popov, Z. Phys. D 37, 283 (1996a).
- Czapliński et al. (2002a) W. Czapliński, A. I. Mikhailov, and I. A. Mikhailov, Hyp. Interact. 142, 577 (2002a).
- Czapliński et al. (2002b) W. Czapliński, E. Gula, and N. Popov, Kerntechnik 67, 290 (2002b).
- Bogdanova et al. (1998) L. N. Bogdanova, S. S. Gershtein, and L. I. Ponomarev, Pis’ma Zh. Eksp. Teor. Fiz. 67, 89 (1998), [JETP Lett. 67, 99–105 (1998)].
- Pen’kov (1997) F. M. Pen’kov, Yad. Fiz. 60, 1003 (1997), [Phys. Atom. Nucl. 60, 897–904 (1997)].
- Boreiko et al. (1998) V. F. Boreiko et al., Nucl. Instrum. Methods A 416, 221 (1998).
- Knowles et al. (2001) P. E. Knowles et al., Hyp. Interact. 138, 289 (2001).
- Bystritsky et al. (2003) V. M. Bystritsky et al., Phys. Rev. A (2003), accepted for publication.
- Maev et al. (1999a) E. M. Maev et al., Hyp. Interact. 118, 171 (1999a).
- Czapliński et al. (1996b) W. Czapliński, A. Kravtsov, A. Mikhailov, and N. Popov, Phys. Lett. A 219, 86 (1996b).
- Czapliński et al. (1998) W. Czapliński, A. Kravtsov, A. Mikhailov, and N. Popov, Eur. Phys. J. D 3, 223 (1998).
- Bogdanova et al. (1999) L. N. Bogdanova, V. I. Korobov, and L. I. Ponomarev, Hyp. Interact. 118, 183 (1999).
- Bystritsky and Pen’kov (1999) V. M. Bystritsky and F. M. Pen’kov, Yad. Fiz. 62, 316 (1999), [Phys. At. Nucl. 62, 281–290 (1999)].
- Bystritsky et al. (1999b) V. M. Bystritsky, M. Filipowicz, and F. M. Pen’kov, Nucl. Instrum. Methods A 432, 188 (1999b).
- Schmidt et al. (1998) R. Schmidt et al., Eur. Phys. J. D 3, 119 (1998).
- Hauser et al. (1993) P. Hauser, F. Kottmann, C. Lüchinger, and R. Schaeren, in Muonic Atoms and Molecules, edited by L. A. Schaller and C. Petitjean (Birkhäuser Verlag, CH–4010, Basel, 1993), pp. 235–241, [Proceedings of the Int. Workshop on Muonic Atoms and Molecules, Ascona].
- Adamczak (1996) A. Adamczak, Hyp. Interact. 101/102, 113 (1996).
- Kottmann et al. (1999) F. Kottmann et al., Hyp. Interact. 119, 3 (1999).
- Koike (2001) T. Koike, Hyp. Interact. 138, 95 (2001).
- Storm and Israel (1970) E. Storm and H. I. Israel, Nucl. Data, Sec. A 7, 565 (1970).
- Hubbell (1982) J. H. Hubbell, Int. J. Appl. Radiat. Isot. 33, 1269 (1982).
- Maev et al. (1996) E. M. Maev et al., Hyp. Interact. 101/102, 423 (1996).
- Philips et al. (1975) A. C. Philips, F. Roig, and J. Ros, Nucl. Phys. A 237, 493 (1975).
- Suzuki et al. (1987) T. Suzuki, D. F. Measday, and J. P. Koalsvig, Phys. Rev. C 35, 2212 (1987).
- Cohen (1982) J. S. Cohen, Phys. Rev. A 25, 1791 (1982).
- von Arb et al. (1984) H. P. von Arb et al., Phys. Lett. B 136, 232 (1984).
- Eckhause et al. (1986) M. Eckhause et al., Phys. Rev. A 33, 1743 (1986).
- Cohen and Struense (1988) J. Cohen and M. Struense, Phys. Rev. A 38, 53 (1988).
- Johnson (1972) W. R. Johnson, Phys. Rev. Lett. 29, 1123 (1972).
- Bacher (1984) R. Bacher, Z. Phys. A 315, 135 (1984).
- Kottmann (1987) F. Kottmann, in Second international Symposium on the interaction of muons and pions with matter (JINR, Dubna, 1987), p. 268.
- Korenman et al. (1990/91) G. Y. Korenman, S. V. Leonova, and V. P. Popov, Muon Catal. Fusion 5/6, 49 (1990/91).
- Bubak and Bystritsky (1986) M. Bubak and V. M. Bystritsky, JINR Preprint E1–86–107 (1986).
- Hartmann (1990) F. J. Hartmann, in Electromagnetic Cascade and chemistry of exotic atoms, edited by L. M. Simons, D. Horváth, and G. Torelli (Plenum Press, New York, USA, 1990), p. 23, [Proceedings of the Fifth Course of the International School of Physics of Exotic Atoms, held in Erice, Italy].
- Balin et al. (1984a) D. V. Balin et al., Phys. Lett. B 141, 173 (1984a).
- Balin et al. (1984b) D. V. Balin et al., Pis’ma Zh. Eksp. Teor. Fiz. 40, 318 (1984b), [JETP Lett. 40, 1112–1114 (1984)].
- Vorobyov (1988) A. A. Vorobyov, Muon Catal. Fusion 2, 17 (1988).
- Rinker (1976) G. A. Rinker, Phys. Rev. A 14, 18 (1976).
- Bystritsky et al. (1993) V. M. Bystritsky et al., Kerntechnik 58, 185 (1993).
- Bystritsky et al. (1999c) V. M. Bystritsky et al., Kerntechnik 64, 294 (1999c).
- Bystritsky et al. (1990/91) V. M. Bystritsky, A. V. Kravtsov, and N. P. Popov, Muon Catal. Fusion 5/6, 487 (1990/91).
- Maev et al. (1999b) E. M. Maev et al., Hyp. Interact. 119, 121 (1999b).
- Belyaev et al. (1996) V. B. Belyaev, O. I. Kartavtsev, V. I. Kochkin, and E. A. Kolganova, Hyp. Interact. 101/102, 359 (1996).
- Gershtein and Gusev (1993) S. S. Gershtein and V. V. Gusev, Hyp. Interact. 82, 185 (1993).
- Belyaev et al. (1995) V. B. Belyaev, O. I. Kartavtsev, V. I. Kochkin, and E. A. Kolganova, Phys. Rev. A 52, 1765 (1995).
- Korobov et al. (1993) V. I. Korobov, V. S. Melezhik, and L. I. Ponomarev, Hyp. Interact. 82, 31 (1993).
- Belyaev et al. (1997) V. Belyaev, O. Kartavtsev, V. Kochkin, and E. A. Kolganova, Z. Phys. D 41, 239 (1997).
- Ishida et al. (1993) K. Ishida et al., Hyp. Interact. 82, 111 (1993).