Astrophysical S-factor of
Abstract
We report on a new measurement of the capture cross section at to 400 keV using the 400 kV LUNA accelerator facility at the Laboratori Nazionali del Gran Sasso (LNGS). The uncertainties have been reduced with respect to previous measurements and their analysis. We have analyzed the data using the R-matrix method and we find that the ground state transition accounts for about 15% of the total S-factor. The main contribution to the S-factor is given by the transition to the 6.79 MeV state. We find a total keV b, in agreement with recent extrapolations. The result has important consequences for the solar neutrino spectrum as well as for the age of globular clusters.
pacs:
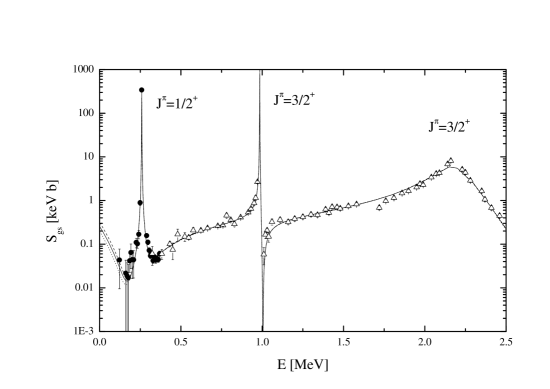
24.30.-v, 24.50+g, 26.20.+fThe capture reaction ( keV) is the slowest process in the hydrogen burning CNO cycle C.Rolfs and W.S.Rodney (1988) and thus of high astrophysical interest. This reaction plays a role of setting the energy production and neutrino spectrum of the sun J.N.Bahcall and M.H.Pinsonneault (1992) as well as the age determination of globular clusters P.A.Bergbusch and B.A.Vandenberg (1992). Below 2 MeV, several 15O states contribute to the cross section (fig. 1): a subthreshold state at keV ( MeV), and 3 resonant states: at keV, and 3/2+ at keV and keV. The reaction was previously studied over a wide range of energies, i.e. to 3300 keV (U.Schröder et al. (1987) and references therein). The non resonant capture to excited states in 15O led the authors of ref. U.Schröder et al. (1987) to an extrapolated astrophysical S-factor at zero energy of keV b. The data for the capture into the 15O ground state were analyzed using the Breit-Wigner formalism and indicated an important influence of a subthreshold state at keV, leading to keV b with a deduced gamma width of eV, thus keV b.

A reanalysis C.Angulo and P.Descouvemont (2001) of the capture data to the ground state U.Schröder et al. (1987) using an R-matrix approach indicated a negligible contribution of the subthreshold state to the total S(0)-factor, mainly due to a significantly smaller of this state. This indication was supported by a lifetime measurement of the keV subthreshold state via the Doppler-shift method P.F.Bertone et al. (2001) leading to eV, and a measurement via the Coulomb excitation method K.Yamada et al. (2004) resulted in eV. In view of the uncertainties in and thus , a new measurement of the capture process into the 15O ground state was highly desirable, extending possibly the low energy limit below that of previous work i.e., below keV. We report on the results of such measurements using the 400 kV underground accelerator facility LUNA at Gran Sasso, Italy.

The 400 kV LUNA facility and the setup have been described elsewhere A.Formicola et al. (2003). Briefly, the accelerator provided a proton current on target of up to 500 A. The absolute energy is known with an accuracy of 0.3 keV and the energy spread and the long-term energy stability were observed to be 100 eV and 5 eV/h, respectively. Near the target, the beam passed a liquid-nitrogen cooled shroud (to minimize carbon-buildup on target) and an electrically insulated collimator with a negative voltage of 300 V (to suppress the effects of secondary electrons). The water-cooled target was oriented with its normal at 55∘ to the beam direction. The target consisted of a TiN layer (with a typical thickness of 80 keV) reactively sputtered on a 0.2 mm thick Ta backing. The target quality was checked frequently at the keV resonance: no significant deterioration was observed after a bombarding time of several days. Typically, a new TiN target was used after a running time of 1 week. The stoichiometry of the TiN layer was verified via Rutherford Backscattering Spectrometry using a 2.0 MeV 4He+ beam, resulting in .
To deduce cross section values in the non-resonant energy region, one can use either thin targets (say, a few keV) or thick targets (say, a few 10 keV). Due to sputtering effects at low energies thin targets deteriorate significantly in a short time changing correspondingly the observed -ray yields. In the case of thick targets, the sputtering effect on the observed yields is negligible, as long as the thickness stays large enough, which was verified experimentally (see above). For the chosen thick targets, we made an analysis of the line shape of the primary -rays as described below to deduce a capture cross section.

For the measurement of excitation functions the capture -rays were observed with one Ge detector (126% efficiency) placed at 55∘ in close geometry to the target ( cm was the distance between the target and the front face of the detector). In one experiment the distance was increased up to 20.5 cm for the determination of the detector efficiency and summing effects. In another experiment, Ge detectors were placed at 0∘ (126 %), 90∘ (120 %), and 125∘ (108 %), relative to the beam axis ( cm) for the measurement of Doppler shifts, excitation energies, and angular distributions. Sample spectra are shown in fig. 2 where the influence of different background sources can be observed: (a) beam induced background, which is mainly due to proton capture on 11B, 18O, and 23Na while at keV (b) the remaning beam induced background from 11B contaminations is equal to the cosmic background.
| [keV] | Doppler shift | Branching [%]111for the keV resonance | |||
|---|---|---|---|---|---|
| present | F.Ajzenberg-Selove (1991) | present222TiN target | P.F.Bertone et al. (2001)333N implanted in Ta | present | F.Ajzenberg-Selove (1991) |
| 444transition to the ground state | 444transition to the ground state | ||||
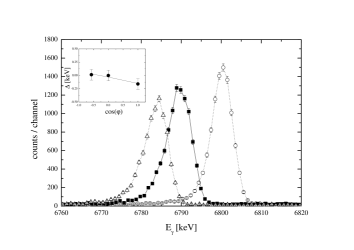
In a similar way as described in A.Formicola et al. (2003), the line shape of the -capture transition in may be used for various purposes. Fig. 3 shows the -ray line shape observed at and keV, i.e. at the low-energy tail of the keV resonance; the dispersion in the spectrum was 1 keV/channel. The line shape can be interpreted as the sum of the resonant and non resonant contributions; when convoluted with the detector resolution, the solid curve through the data points is obtained. In this way, the drop in the -ray yield towards lower energies reflects directly the drop of the cross section. For the calculated line shape the dependence on energy of the -efficiency and of the stopping power of protons in TiN J.F.Ziegler and Biersack (2003) was included. The high-energy edge of the peak contains the information on the incident beam energy, hence possible C-build up on target could be corrected for; this correction was never larger than 2 keV. The method to extract the cross section from the -ray line shape requires further investigation of the following points: (i) energy, width, branching ratios, and strength of the keV resonance, (ii) energy calibration and efficiency of the Ge detector, (iii) summing effects in close geometry, (iv) Doppler shift, and (v) effects of angular distributions. In the same way the transition to the 6.79 MeV state was analysed. Below keV the information of the data from the secondary transition was used in the analysis. For this energy region a constant was assumed over the target thickness. A detailed description of all these points is given elsewhere H.Costantini (2003); A.Formicola (2004), where a complete analysis of the data to all final states will be presented.
The resonance energy could in principle be determined from the -energy after correction for Doppler shift and recoil. One requirement is the precise energy calibration of the Ge detector. We have used the information obtained from the experiment with the 3 Ge detectors (, 90∘, and 125∘). From P.F.Bertone et al. (2001) it is known, that the keV state in 15O shows an attenuated Doppler shift and the 6172 and 6791 keV states have lifetimes resulting in nearly full Doppler shifts. Using the known energy of the resonance from the accelerator calibration together with keV G.Audi et al. (2003) and calibration points from radioactive sources we have performed a combined fit of the data obtained at the three angles. It was necessary to vary also the excitation energies of the first three excited states. In addition, we varied the attenuation coefficients for the Doppler shifts. The Doppler shift data for the keV state are shown in Fig. 4 and all results are summarized in Table 1. We confirm the results of P.F.Bertone et al. (2001) for the first excited state in 15O but could not extract a lifetime for the 6791 keV state due to a nearly full Doppler shift. For all the subsequent work we calibrated the -ray spectra using the new excitation energies given in Table 1.
| ground state | subthreshold state | Eres | transition to | ||||
| radius | ANC | 2.19 MeV | 6 MeV | MeV | MeV | ||
| [fm] | C [fm-1/2] | [MeV] | [eV] | [eV] | [eV] | S(0) [keV b] | S(0) [keV b] |
| 5 | 5.8 | 0.40 | 1.2 | 4.3 | 25 | 0.19 | 1.31 |
| 5.5 | 7.3 | 0.42 | 0.8 | 4.4 | 23 | 0.25 | 1.35 |
| 6 | 8.8 | 0.44 | 0.5 | 4.7 | 26 | 0.31 | 1.39 |
| average | |||||||
The detector efficiency was determined using calibrated radioactive sources and the cascade condition for the transitions to the first three excited states at the keV resonance, as for all of them no other decay than that to the ground state was observed. This procedure was performed with the Ge detector placed at 1.53, 5.5, 10.5, and 20.5 cm distances from the target in order to determine the summing-in contribution to the ground state transition and the summing-out for the transitions to the excited states. It turned out, that the summing-in yield was about 3.5 times higher than the actual ground state intensity at the 1.53 cm position. This 1.53 cm position was used for the entire cross section measurements. The efficiency curve was also calculated using the GEANT routine Gea and found to be in excellent agreement with observation H.Costantini (2003). Branching and strength values of the keV resonance were determined with low beam current to avoid dead time effects and at far distance (20.5 cm) to minimize summing effects from cascade transitions. The branching results are given in Table 1; they are in good agreement with previous work D.F.Hebbard and G.M.Bailey (1963), except for the ground state transition. Our strength value of (statistical) (systematical) meV, which was determined absolutely, is also in good agreement with previous work U.Schröder et al. (1987); F.Ajzenberg-Selove (1991), meV. The fitted total width of keV is consistent with previous work (U.Schröder et al. (1987): keV).
All transitions show isotropy at the keV, resonance and no forward-backward asymmetry H.Costantini (2003) outside the resonance. Consequently, an angle-integrated -ray yield may be derived directly from the yield collected by the Ge detector at . Finally, the summing due to the large solid angle of the detector and the cascade coincident events in the transition to the ground state was corrected for by studying all other capture transitions. The absolute scale of the cross section deduced from the -ray line shape was obtained by normalizing to the thick target yield in the 259 keV resonance C.Rolfs and W.S.Rodney (1988) whose strength was determined absolutely (see above).
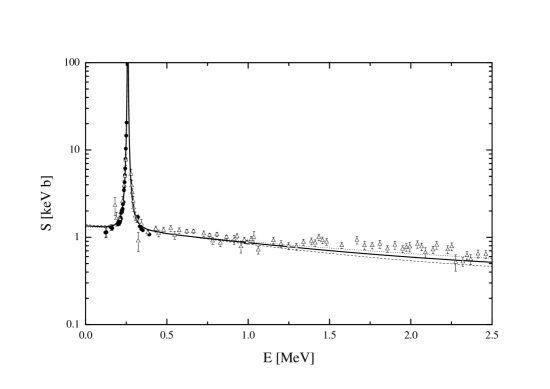
The capture data from LUNA and previous work U.Schröder et al. (1987) for the transition to the 6.79 MeV state are shown in figure 5: there is an excellent agreement between both data sets in the region of overlap. As shown from previous work U.Schröder et al. (1987); C.Angulo and P.Descouvemont (2001), the S-factor has an external non-resonant contribution and a contribution from the keV resonance, where the latter contribution was derived from and values of the present work. The R-matrix fit C.Angulo and P.Descouvemont (2001); A.N.Lane and R.G.Thomas (1958) included both contributions. The resulting ANC value of fm-1/2 agrees with indirect determinations (A.M.Mukhamedzhanov et al. (2003): fm-1/2; P.F.Bertone et al. (2002): fm-1/2) and leads to the fitted curve shown in figure 5. For large values of the R-matrix radius the fit deviates from the data for energies above MeV (see Fig. 5). We have adopted the results for fm leading to the extrapolated value (statistical) (systematical) keV b. This value is about 20 % lower than the R-matrix fit C.Angulo and P.Descouvemont (2001) of the data from U.Schröder et al. (1987) alone.
The data from LUNA and previous work U.Schröder et al. (1987) for the ground state capture are shown in figure 6. We have corrected the previous data for summing effects, which are at most 10 % above keV, except near the destructive interference structure of the keV resonance. The data were fitted including the 3/2+ subthreshold state, the 1/2+, 259 keV, the 3/2+, 987 keV and the 3/2+, 2187 keV resonances as well as a background pole located at 6 MeV. For the subthreshold state, we used the reduced width obtained from the fit of the data for the 6.79 MeV transition. The fit parameters were the of the subthreshold state, the 987 keV and 2187 keV resonances, the and of the background pole. For the external contribution we used the ANC of A.M.Mukhamedzhanov et al. (2003) as a starting value. The results are shown in Fig. 6 for fm and fm-1/2 (dotted line), fm and fm-1/2 (solide line), and fm and fm-1/2 (dashed line). The corresponding values for the subthreshold state and extrapolated S-factor values are listed in Table 2. It can be noted that our deduced value eV is in good agreement with the value from a life time measurement by P.F.Bertone et al. (2001) eV as well as with eV, the value from coulomb excitation work K.Yamada et al. (2004). All values from Table 2 are consistent within uncertainties with our observation of a nearly full Doppler shift for the transition of the 6.79 MeV state (see Fig. 4). The best for the fit to the ground state transition is obtained for fm (), however the differences are small (for fm, ; contributions to near the narrow resonances have been omitted in the values given above). The best overall agreement with all available data U.Schröder et al. (1987); P.F.Bertone et al. (2001); K.Yamada et al. (2004); P.F.Bertone et al. (2002); A.M.Mukhamedzhanov et al. (2003) is obtained for fm, where our fitted ground state ANC is fm-1/2, that can be compared with the result of A.M.Mukhamedzhanov et al. (2003) which gives fm-1/2, after conversion to the coupling scheme used in the present work. For the total S-factor a contribution from the transition to the 6.17 MeV state of keV b from C.Angulo and P.Descouvemont (2001) has been added to obtain an average ( to 6 fm) of (statistical) (systematical) keV b, which can be compared with keV b C.Angulo and P.Descouvemont (2001) and keV b A.M.Mukhamedzhanov et al. (2003) from previous analyses.
In summary, the present work improves the experimental information concerning the ground state transition in . The previous data U.Schröder et al. (1987) corrected by summing effects discussed above are now in good agreement with the present work. The large ambiguity for the extrapolation of the ground state transition has been reduced. In the energy region between to 300 keV the S(E)-factor is dominated by the 259 keV resonance. Only at energies of about 100 keV and below the contributions of the subthreshold resonance and non-resonant mechanisms should become clearly observable. Using large volume Ge detectors it is impossible to obtain additional information on Sgs(E) at lower energies (than current work) with acceptable uncertainty due to the sizable summing correction. An improved information on Stot(E) can be achieved possibly using a 4-summing crystal to observe the total S(E)-factor. Such an experiment is presently underway at the LUNA facility.
After submission of the present work several relevant publications appeared:
(i) The authors of S.O.Nelson et al. (2003) reanalyzed the data of U.Schröder et al. (1987) based on conclusions from their analyzing power data. This led to a different extrapolation for the transition to the 6.79 MeV state (about 10 to 20 % lower than the analysis of C.Angulo and P.Descouvemont (2001) and 11 % higher than present work) and for the transition to the 6.17 MeV state (about a factor 3 higher than C.Angulo and P.Descouvemont (2001)). However, the primary aim of the present letter was to clarify the strength of the ground state transition.
(ii) The analysis in G.Imbriani et al. (2004); S.Deg’Innocenti et al. (2003); J.N.Bahcall and M.H.Pinsonneault (2004) were partly based on the results of the present work and led to the conclusion that the solar neutrino flux from CNO cycle is reduced by a factor 2 and the age of the globular clusters is increased by about 1 billion years.
References
- C.Rolfs and W.S.Rodney (1988) C.Rolfs and W.S.Rodney, Cauldrons in the Cosmos (University of Chicago Press, 1988).
- J.N.Bahcall and M.H.Pinsonneault (1992) J.N.Bahcall and M.H.Pinsonneault, Rev.Mod.Phys. 64, 885 (1992).
- P.A.Bergbusch and B.A.Vandenberg (1992) P.A.Bergbusch and B.A.Vandenberg, Ap.J.Suppl 81, 163 (1992).
- U.Schröder et al. (1987) U.Schröder et al., Nucl.Phys. A 467, 240 (1987).
- C.Angulo and P.Descouvemont (2001) C.Angulo and P.Descouvemont, Nucl.Phys.A. 690, 755 (2001).
- P.F.Bertone et al. (2001) P.F.Bertone et al., Phys.Rev.Lett. 87, 152501 (2001).
- K.Yamada et al. (2004) K.Yamada et al., Phys. Lett. B 579, 265 (2004).
- A.Formicola et al. (2003) A.Formicola et al., Nucl.Instr.Meth. A 507, 609 (2003).
- F.Ajzenberg-Selove (1991) F.Ajzenberg-Selove, Nucl. Phys. A 523, 1 (1991).
- J.F.Ziegler and Biersack (2003) J.F.Ziegler and J. Biersack, Srim-program, version 2003-20, srim.org (2003).
- H.Costantini (2003) H.Costantini (2003), eprint Thesis, University of Genova and to be published.
- A.Formicola (2004) A.Formicola, Thesis (Ruhr-Universität Bochum, 2004).
- G.Audi et al. (2003) G.Audi, A.H.Wapstra, and C.Thibault, Nucl. Phys. A 729, 337 (2003).
- (14) eprint GEANT4: An Object-Oriented Toolkit for Simulation in HEP. The RD44 Collaboration, CERN/LHCC 95-70, 1995 and The Geant4 Collaboration, http://wwwinfo.cern.ch/asd/geant4/geant4.html.
- D.F.Hebbard and G.M.Bailey (1963) D.F.Hebbard and G.M.Bailey, Nuc. Phys. 49, 666 (1963).
- A.N.Lane and R.G.Thomas (1958) A.N.Lane and R.G.Thomas, Rev. Mod. Phys. 36, 257 (1958).
- A.M.Mukhamedzhanov et al. (2003) A.M.Mukhamedzhanov et al., Phys. Rev. C 67, 065804 (2003).
- P.F.Bertone et al. (2002) P.F.Bertone et al., Phys.Rev. C 66, 055804 (2002).
- S.O.Nelson et al. (2003) S.O.Nelson et al., Phys. Rev. C 68, 065804 (2003).
- G.Imbriani et al. (2004) G.Imbriani et al. (2004), eprint astro-ph/0403071 and accepted by Astron. and Astrophy.
- S.Deg’Innocenti et al. (2003) S.Deg’Innocenti et al. (2003), eprint astro-ph/0312559.
- J.N.Bahcall and M.H.Pinsonneault (2004) J.N.Bahcall and M.H.Pinsonneault (2004), eprint astro-ph/0402114 and accepted by Phys. Rev. Lett.