8000
Acoustical Scociety of America \copyrightyear2001
Analysis of the meson production mechanism via the reaction
Abstract
Polarisation observables constitute a powerful tool for establishing the production mechanism of the meson and for infering the presence of higher partial waves in the final system. Measurements of the proton analysing power for the reaction have been performed by the COSY-11 group at three different excess energies: Q=10, 37 and 40 MeV. Data at Q=40 MeV indicate that the meson is probably produced in partial waves higher than wave.
Keywords:
Document processing, Class file writing, LaTeX 2ε1 Introduction
Despite the fact that the discovery of the meson took place over fourty years ago Pevsner et al. (1961), its production mechanism still remains an open question. Based on the close-to-threshold total cross section measurements for the reaction Bergdolt et al. (1993); Chiavassa et al. (1994); Calén et al. (1996, 1997); Hibou et al. (1998); Smyrski et al. (2000), investigations on differential cross sections for this reaction Calén et al. (1999); Tatischeff et al. (2000); Moskal et al. (2001a, 2002a, 2002b); Abdel-Bary et al. (2003); Moskal et al. (2003a, b) and recently performed measurements of the proton analysing power for the reaction Winter et al. (2002); Winter (2002), there is a consensus that in the NN collisions the meson is produced in a two-step process, where in the first stage exchange of one of the pseudoscalar or vector mesons excites the resonance and subsequently this resonance decays into a N pair. The resonance seems to play an important role as an intermediate state since it has a large width covering the threshold energy for the reaction, and it couples strongly to the N system with a branching ratio corresponding to 30-55 % Caso et al. (1998).
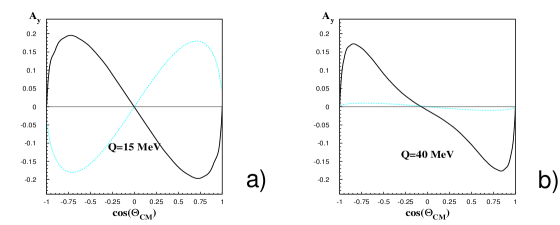
Although there exists a variety of models based on different assumptions concerning the mechanism of the production, these models are in quite good agreement with the existing data on close-to-threshold total cross sections for the reaction Moskal et al. (2002c). As it was shown in reference Nakayama et al. (2002), the excitation function for the process can be equally well described by the intermediate excitation of the S11 via the exchange of either pseudoscalar or vector mesons. This implies that more limitations have to be added to the models in order to extract the way the meson is really being created. One solution would be the verification of different models by means of the polarisation observables. At present there exist two models that predict the energy dependence of the proton analysing power for the reaction Nakayama et al. (2002); Faldt and Wilkin (2001). Theoretical forecasts for the two different excess energies Q=15 MeV and Q=40 MeV are shown in fig.1. There are significant differences between the models visible in both: the relative sign (at lower Q values) and in the magnitude of the proton analysing power. Measurements of this observable might therefore help to establish the adequacy of mechanisms of meson production.
2 Experiments
There have been, so far, performed three measurements of proton analysing power for the reaction at different excess energies. All these experiments made use of the COSY-11 installation Brauksiepe et al. (1996), which is an internal detection setup mounted inside the COSY ring111Accelerator’s name ’COSY’ is an acronym of COoler SYnchrotron. Maier (1997) in the Research Centre Jülich. Experiments were performed in three separate runs in January ’01 (at excess energy Q=40 MeV), September ’02 (Q=37 MeV) and April ’03 (Q=10 MeV). Data taken during the first run have been analysed and published Winter et al. (2002) whereas the data from the two last runs await the full analysis. In the following the results from measurement at the excess energy Q=40 MeV will be presented as well as some preliminary estimations for the other runs.
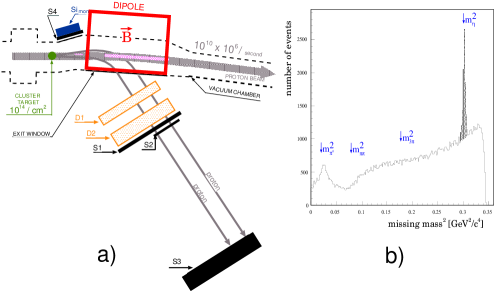
The mentioned COSY-11 detection setup is displayed schematically in fig. 2a. Due to the short lifetime, the meson cannot be registered in any of the detectors available at COSY-11. Its identification, however, can be performed using the missing mass method. Having known the beam and target’s four-momenta, denoted as and respectively, and having reconstructed the four-momenta of the two protons in the exit channel ( and ), it is possible to determine the square mass of the unregistered particle or system of particles according to the formula:
| (1) |
The missing mass spectrum for events with two protons in the exit channel, obtained from the whole measurement at Q=40 MeV is shown in figure 2b. A high peak at the value of the mass square is clearly seen. with about 6000 events inside the peak above the background. The background mainly originates from multi-pion production. The increase of the background in the higher-energy part of the spectrum is a reflection of the increasing acceptance of the detection system in this region. The mass resolution achieved during this measurement was equal to MeV/c2.
In order to determine the analysing power222For detailed calculation of the analysing power, which takes into account the efficiency corrections, the reader is referred to Winter et al. (2002). one has at the same time to monitor both the luminosity and the beam polarisation. During the first two measurements we made use of the EDDA experimental setup Bisplinghoff et al. (1993) in order to extract the beam polarisation, whereas in the last two runs we monitored the polarisation by means of the COSY internal polarimeter Bauer (2001) and our own monitoring system, allowing to measure elastically scattered protons in the horizontal and vertical planes.
3 Results
The analysing power values for the reaction as obtained from the measurement at an excess energy Q=40 are presented in figure 3. The range of the centre-of-mass polar angle has been divided into four bins, with a width of 0.5 in cos. There are about 1000-1500 events in each bin. Figure 3a shows the results of analysis within the framework of the vector meson exchange model Nakayama et al. (2003) for the reaction. The dashed line in this figure represents the partial wave contribution, the waves are represented by the dashed-dotted line, whereas the full model calculations, taking into account also the higer partial waves are shown as a solid line, which is close to the dash-dotted line. It is worth to note that the pure wave should force Ay to be equal to 0. However, at present level of the measurement’s accuracy we are not able to infer any quantitative conclusions.

The interference term between Pp and Ps waves (denoted as G, where we follow the notation from Meyer et al. (2001)) as well as the sum of (Pp)2 and (SsSd) interference terms (H + I) have been calculated and are equal to Winter et al. (2002):
G = ( 0.003 0.004 ) b,
H + I = ( - 0.005 0.005 ) b.
The vanishing value of G may suggest that there is no interference between Pp and Ps waves in the final state system. Unfortunatelly, during the first measurement the precision of data was not good enough to disentangle the sum of H and I.
4 Outlook
As can be seen from figure 3b both model predictions lie within 2 distance from experimental data, therefore at the level of accuracy obtained during the first measurement we are not able to distinguish between two different hypotheses of the production. Thus further investigations were necessary. During the last two measurements the beam polarisation was increased from about 50% (which was the averaged polarisation during the first run) up to 75-80%. This nice feature, together with the fact that the luminosity integrated over the whole measurement’s period was larger by a factor 1.5, should result in about two times better accuracy of the last two measurements. Moreover, the difference between predictions of two mentioned models are the largest at the excess energy Q=10 MeV, studied in present experiments, which should additionally help to discriminate one of the reactions models.
References
- Pevsner et al. (1961) Pevsner, A., et al., Phys. Rev. Lett., 7, 421–423 (1961).
- Bergdolt et al. (1993) Bergdolt, A. M., et al., Phys. Rev., D 48, 2969–2973 (1993).
- Chiavassa et al. (1994) Chiavassa, E., et al., Phys. Lett., B 322, 270–274 (1994).
- Calén et al. (1996) Calén, H., et al., Phys. Lett., B 366, 39–43 (1996).
- Calén et al. (1997) Calén, H., et al., Phys. Rev. Lett., 79, 2642–2645 (1997).
- Hibou et al. (1998) Hibou, F., et al., Phys. Lett., B 438, 41–46 (1998).
- Smyrski et al. (2000) Smyrski, J., et al., Phys. Lett., B 474, 182–187 (2000).
- Calén et al. (1999) Calén, H., et al., Phys. Lett., B 458, 190–196 (1999).
- Tatischeff et al. (2000) Tatischeff, B., et al., Phys. Rev., C 62, 054001 (2000).
- Moskal et al. (2001a) Moskal, P., et al., N Newsletter, 16, 367–369 (2001a).
- Moskal et al. (2002a) Moskal, P., et al. (2002a), e-Print Archive: nucl-ex/0208004.
- Moskal et al. (2002b) Moskal, P., et al. (2002b), e-Print Archive: nucl-ex/0210019.
- Abdel-Bary et al. (2003) Abdel-Bary, M., et al., Eur. Phys. J., A16, 127–137 (2003).
- Moskal et al. (2003a) Moskal, P., et al., Nucl. Phys., A721, 657 (2003a).
- Moskal et al. (2003b) Moskal, P., et al. (2003b), e-Print Archive: nucl-ex/0307005.
- Winter et al. (2002) Winter, P., et al., Phys. Lett., B 544, 251–258 (2002), erratum-ibid. B553,339 (2003).
- Winter (2002) Winter, P., Erste Messung der Analysierstärke in der Reaktion am Experiment COSY-11, Diploma thesis, Rheinische Friedrich-Wilhelms-Universität Bonn (2002), ,IKP Jül-3943.
- Caso et al. (1998) Caso, C., et al., Eur. Phys. J., C3, 1–794 (1998).
- Moskal et al. (2002c) Moskal, P., Wolke, M., Khoukaz, A., and Oelert, W., Prog. Part. Nucl. Phys., 49, 1 (2002c).
- Nakayama et al. (2002) Nakayama, K., Speth, J., and Lee, T. S. H., Phys. Rev., C 65, 045210 (2002).
- Faldt and Wilkin (2001) Faldt, G., and Wilkin, C., Phys. Scripta, 64, 427–438 (2001).
- Brauksiepe et al. (1996) Brauksiepe, S., et al., Nucl. Instr. Meth., A 376, 397–410 (1996).
- Maier (1997) Maier, R., Nucl. Instr. Meth., A 390, 1–8 (1997).
- Moskal et al. (2001b) Moskal, P., et al., Nucl. Instr. Meth., A 466, 444–451 (2001b).
- Groom et al. (2000) Groom, D. E., et al., Eur. Phys. J., C 15, 1–878 (2000).
- Bisplinghoff et al. (1993) Bisplinghoff, J., et al., Nucl. Instrum. Meth., A329, 151–162 (1993).
- Bauer (2001) Bauer, F., Annual Report 2001, Forschungszentrum Jülich (2001).
- Nakayama et al. (2003) Nakayama, K., Haidenbauer, J., Hanhart, C., and Speth, J., Phys. Rev., C 68, 045201 (2003).
- Meyer et al. (2001) Meyer, H. O., et al., Phys. Rev., C63, 064002 (2001).