Comment on “Electromagnetic dissociation of 8B and the astrophysical S-factor for 7Be(p,)8B”
Abstract
Recently, Davids and Typel recommended a “low” value of S17(0) based on fits to published direct and Coulomb dissociation data, in which they excluded the precise result of Junghans et al. We show that their statistical analysis is incorrect, due to a substantial underestimate of the experimental uncertainties, and leads to conclusions that are not supported by a proper analysis.
pacs:
26.20+f, 26.65+t, 25.40Lw, 25.70.DeDavids and Typel dt (here called DT) determined S17(0) values by fitting their potential model calculations to published low energy ( 400 keV) 7Be(p,)8B data from 5 direct and 2 Coulomb dissociation (CD) experiments. DT found a low probability P() = 0.008 for the mean value of S17(0) from this data set, and rejected the most precise value, the 2002 measurement by Junghans et al. junghans02 , on the basis of its large deviation from the mean. From a fit to their data set excluding Junghans, they obtained a “recommended” value S17(0) = 18.6 0.4(exp) 1.1(extrap) eV b, where “extrap” is their estimated extrapolation uncertainty. However, DT substantially underestimated the experimental uncertainties in S17(0) from the various experiments.
Table 1 compares the “7Be + p potential” fits given in Table II of DT, with the analysis of low energy data from the same experiments as given in Table VII and Fig. 20 of ref. junghans03 (here called JU03). The top 6 entries in our Table 1 are from the modern direct experiments filippone ; hammache ; strieder ; baby ; junghans02 ; junghans03 , and the bottom 4 from the modern CD experiments kikuchi ; iwasa ; schumann ; dt (see also motobayashi ). Since the Descouvement and Baye (DB) theory used by JU03, and the DT potential calculations are very similar in the low energy region (see Fig. 4 of DT), the JU03 and DT fit results should also be very similar fitdifference . While the central values shown in Table 1 are indeed similar (the DT results are a few percent lower than the JU03 results), the DT uncertainties are significantly smaller (by factors of 1.3 to 3.1) than the JU03 uncertainties dtparameters . Several of these uncertainties may also be compared directly with the uncertainties quoted by the original authors. The S17(0) uncertainties quoted in Junghans junghans02 and Baby baby from fits to low energy data agree with the uncertainties shown in column 3 of Table 1 and disagree with the uncertainties shown in column 4. In fact, all but 2 of the DT uncertainties shown in Table 1 are consistent with an (incorrect) procedure in which, for each experiment, the systematic uncertainty in the normalization was included with the statistical uncertainty on each fitted data point, instead of being excluded while minimizing and then folded into the fit uncertainty. As a result, the DT analysis erroneously reduced the systematic error, for these experiments, by approximately the square root of the number of fitted data points. The 2 exceptions are the DT uncertainties from their fits to the data of Filippone and Schümann, which are consistent with no included systematic uncertainty.
| First author | Expt. | JU03 fit111from fits to data with 425 keV. | DT fit222from fits to data with 400 keV. |
|---|---|---|---|
| Filippone | direct | 20.7 2.5 | 19.8 0.8 |
| Hammache | ” | 20.1 1.3 | 19.5 0.8 |
| Strieder | ” | 18.8 1.8 | 18.7 1.4 |
| Baby | ” | 20.8 1.3 | 20.3 1.0 |
| Junghans 2002 | ” | 22.3 0.7 | 22.2 0.3 |
| Junghans 2003 | ” | 22.1 0.6333this value supercedes the Junghans 2002 value. | (not fitted) |
| Kikuchi | CD | 19.1 1.7 | (not fitted) |
| Iwasa | ” | 20.6 1.2 | (not fitted) |
| Schümann | ” | 19.1 1.5 | 19.0 1.0 |
| Davids | ” | 17.4 1.4 | 17.1 1.1 |
Table 1 also shows the JU03 fit results for the modern CD experiments of Kikuchi et al. kikuchi and Iwasa et al. iwasa , which in our opinion should be included in comparisons. Fig. 1 shows the JU03 fit results from Table 1 02vs03 ,
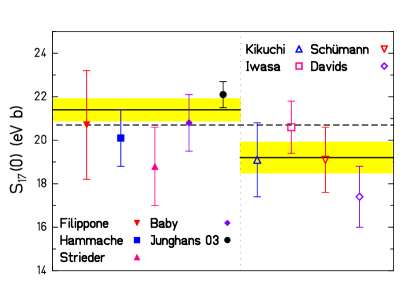
together with the mean value of 20.7 0.4 eV b expterrors from a fit to the full data set, for which = 1.8 ( = 8) and P() = 0.07 (if we exclude the values from Kikuchi and Iwasa, to more closely approximate the conditions of the DT comparison, we obtain 20.8 0.4 eV b, = 2.2 ( = 6) and P() = 0.04). Neither of these fit probabilities is unacceptably small. Furthermore, both the Davids and the Junghans points differ from the mean by nearly the same amount (2.3). Excluding Davids Junghans results in a good fit, with P() = 0.3 (excluding Davids) or 0.7 (excluding Junghans). Excluding Davids Junghans gives P() = 0.94, whose likelihood is similar to the P() = 0.07 fit to the full data set. Thus, there is no reason from these fits to throw out any of the experiments e2vse1 .
In cases like this, where results are presented from 2 very different techniques, it is important to check if the results indicate a technique dependence. A fit to the direct data alone yields 21.4 0.5 eV b, = 1.2 ( = 4) and P() = 0.32, while a fit to the CD data alone yields 19.2 0.7 eV b, = 1.0 ( = 3) and P() = 0.39. Thus, all the direct data are mutually consistent, as are all the CD data. However, the probability that these 2 mean values arise from the same parent distribution is P() = 0.01, which suggests a technique dependence.
There are other differences between CD and direct results. JU03 presents clear evidence for a systematic difference in the slopes of S determined from CD data and from direct data, with probability P() = 0.003 that the slopes from these 2 types of experiments arise from the same parent distribution. In our opinion this slope difference must be understood before results of direct and CD experiments can be combined. In addition, considerable modeling is necessary to infer 7Be(p,)8B cross sections from measured 8B breakup data, and it is difficult to understand all the associated uncertainties (as is also the case for peripheral heavy ion transfer and breakup experiments azhari , which tend to yield even lower S values than CD experiments). These indirect techniques have never (to our knowledge) been “calibrated” by comparison to a directly-measured capture reaction, with sufficient accuracy to demonstrate that they are free of systematic bias at the level of a few percent, as is necessary for indirect results to be included in determining a recommended S17(0) value at this same level of precision.
For these reasons, the S value recommended in JU03 was based on the mean of direct experiments only centralvalue . It remains a challenge to understand better these differences between indirect and direct methods.
Financial support was provided by the U.S.D.O.E., grant # DE-FG03-97ER41020.
References
- (1) B. Davids and S. Typel, Phys. Rev. C 68, 045802, 2003.
- (2) A. R. Junghans et al., Phys. Rev. Lett. 88, 041101, (2002).
- (3) A. R. Junghans et al., Phys. Rev. C, in press. See also nucl-ex/0308003 at arxiv.org.
- (4) B. W. Filippone et al., Phys. Rev. C 28, 2222 (1983).
- (5) F. Hammache et al., Phys. Rev. Lett. 80, 928 (1998); F. Hammache, PhD thesis, Universite de Paris XI, Orsay, 1999; F. Hammache et al., Phys. Rev. Lett. 86, 3985 (2001).
- (6) F. Strieder et al., Nucl. Phys. A 696, 219 (2001); F. Strieder, Ph.D. thesis, 2000.
- (7) L. T. Baby et al., Phys. Rev. Lett. 90, 022501 (2003); Phys. Rev. C 67, 065805 (2003).
- (8) T. Kikuchi et al., Eur. Phys. J. A 3, 213 (1998).
- (9) N. Iwasa et al., Phys. Rev. Lett. 83, 2910 (1999).
- (10) F. Schümann et al., Phys. Rev. Lett. 90, 232501 (2003).
- (11) T. Motobayashi et al., Phys. Rev. Lett. 73, 2680 (1994).
- (12) Fit range differences (see Table 1) are unimportant here.
- (13) DT fits with their “7Li + n” potential calculations, used for their recommended S, yielded the same uncertainties as their “7Be + p” potential fits, central values 3% lower (see Table III of DT), and nearly identical quality fits.
- (14) Including the new Seattle-TRIUMF S17(0) value junghans03 in place of the earlier value junghans02 used by DT has a negligible effect on the fit results discussed here.
- (15) Here and below we quote experimental uncertainties only, not including theoretical (extrapolation) uncertainty.
- (16) We note that the E2/E1 ratio used in interpreting the Davids data remains controversial.
- (17) A. Azhari et al., Phys. Rev. C 63, 055803 (2001). L. Trache et al., Phys. Rev. Lett. 87, 271102 (2001).
- (18) The central value was based on the DB calculation, which fits the observed direct energy dependence over a wide range better than other theories, including the DT calculations.