Pseudorapidity Distribution of Charged Particles in Collisions at
Abstract
The measured pseudorapidity distribution of primary charged particles in minimum-bias collisions at is presented for the first time. This distribution falls off less rapidly in the gold direction as compared to the deuteron direction. The average value of the charged particle pseudorapidity density at midrapidity is and the integrated primary charged particle multiplicity in the measured region is 82 6(syst). Estimates of the total charged particle production, based on extrapolations outside the measured pseudorapidity region, are also presented. The pseudorapidity distribution, normalized to the number of participants in collisions, is compared to those of and systems at the same energy. The distribution is also compared to the predictions of the parton saturation model, as well as microscopic models.
pacs:
25.75.-q, 25.75.DwThe pseudorapidity distribution of charged particles in collisions is important for understanding the evolution of the system created in more complicated collisions, and may provide a constraint on the initial state parton density. The energy and centrality dependence of pseudorapidity distributions in collisions measured at RHIC BacPRL2001 ; Bac2 ; Brah are consistent with the approach based on the ideas of parton saturation KhPLB523 ; GriPR100 and semi-classical QCD MacPRD . Measurements of collisions may be the ideal way to search for the onset of gluon saturation, since the system should be much simpler than the one studied in collisions. The results of collisions are therefore crucial for testing the saturation approach Dima2003 .
In this Letter we present the first measurement of the minimum-bias pseudorapidity distribution of primary charged particles () produced in collisions of deuterons with gold nuclei at a nucleon-nucleon center-of-mass energy, , of 200 GeV. The pseudorapidity, , is defined as , where is the emission angle relative to the direction of the deuteron beam. The data were obtained with the PHOBOS detector at the Relativistic Heavy Ion Collider at Brookhaven National Laboratory. The data were collected using the multiplicity array BacNim , covering . The array consisted of a barrel of silicon detectors surrounding the beam pipe in the central rapidity region (“Octagon”), and six forward silicon counters, three on each side of the interaction point (“Rings”). The multiplicity array used in collisions was the same as that for collisions at BacPRL2003 . The detector setup also included two sets of 16 scintillator counters, covering . These counters were used in the primary event trigger and in the offline event selection.
The results presented in this Letter were obtained by two analysis methods: a “hit-counting” method and an “analog” method. The details of the analysis procedure of the two methods leading to the measurement of can be found in Ref. BacPRL2001 . The measured pseudorapidity distribution was corrected for particles which were absorbed or produced in the surrounding material and for feed-down products from weak decays of neutral strange particles. Uncertainties associated with these corrections, which we take as 20–50% of the corrections, dominate the systematic errors.
Due to the low multiplicity in , a new algorithm for collision vertex reconstruction was developed, using the hit position and energy deposited in the Octagon detector. Monte-Carlo studies using HIJING HIJING and GEANT 3.21, as well as comparisons with the vertex information from reconstructed tracks, show a resolution of for the most peripheral events and for the most central events, being the distance along the beam axis.
In order to determine the minimum-bias pseudorapidity distribution for this analysis, it is necessary to correct for the trigger and vertex finding efficiencies. Since these efficiencies are functions of multiplicity (and therefore centrality), the most model-independent approach is to measure the pseudorapidity distribution in narrow bins of centrality and then integrate over centrality to produce a minimum-bias result. The alternative approach of multiplying by a global Monte-Carlo (MC) correction factor (reconstructed/true MC) would rely on our model to get the details of the shape and the centrality dependence right. To further reduce the model-dependence, we used five distinct measures for estimating the collision centrality based on the multiplicity (defined by the energy deposited in the silicon detectors) in different regions of pseudorapidity. The first of these centrality measures, , used data from the full pseudorapidity coverage of PHOBOS, . The second measure, , used data from the more central region . The next two measures, and , used data from the gold direction () and deuteron direction (), respectively. The final centrality measure, , used data far from the mid-rapidity region from the silicon ring counters at .
The centrality measures were calibrated using HIJING HIJING and GEANT 3.21 simulations. In the case of , , and , the distributions in data and MC were very similar once the triggering and event selection were applied to the MC and an additional scaling factor near unity was included. For instance, for this scaling factor was 1.046. This allowed us to use the zero-bias “true” distribution in the MC to divide the data into equal 10% cross-section bins and to estimate the overall trigger and vertex-finding efficiency of 83%. Based on studies of reconstructed and true pseudorapidity distributions from different Monte-Carlo simulations, we include a global 5 systematic uncertainty on the pseudorapidity distribution in the reported errors. In the case of , the MC and data distributions were sufficiently different that the procedure had to be modified. From the calculated efficiencies in each of the MC centrality bins, we could derive how many of the events in each “true” 10% bin would appear in the data. Cuts were then made on the distribution that gave this efficiency-corrected number of events.
Once the efficiency had been calculated and centrality cuts made, we extracted the average number of participating nucleons for each centrality bin using HIJING+GEANT. The measured minimum-bias pseudorapidity distribution and the estimated number of participants were obtained by averaging over all centralities for each centrality measure. This averaging was done as the minimum-bias distribution is less sensitive to centrality resolution and multiplicity bias effects than the individual centrality bins. The final distribution was obtained by averaging over the five minimum-bias distributions given by the different centrality measures. The total number of participant nucleons, , was estimated to be . To cross check the final distribution obtained by using the silicon centrality measures, a further analysis was performed, only requiring at least one hit in one of the scintillator counter arrays. This analysis was consistent within the present systematic uncertainty.
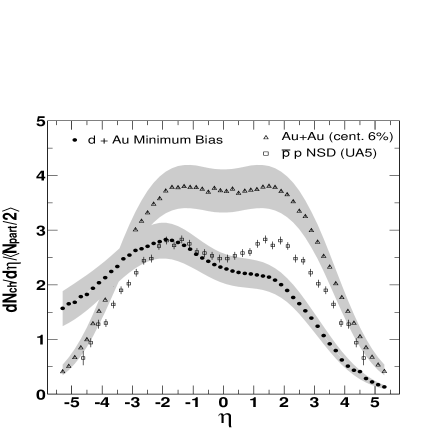
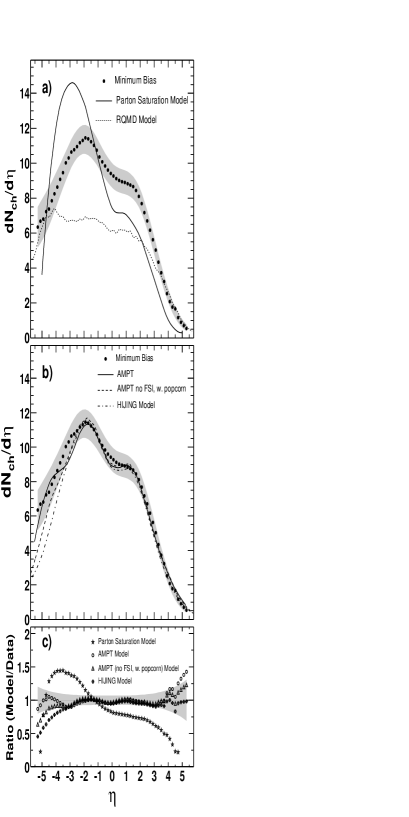
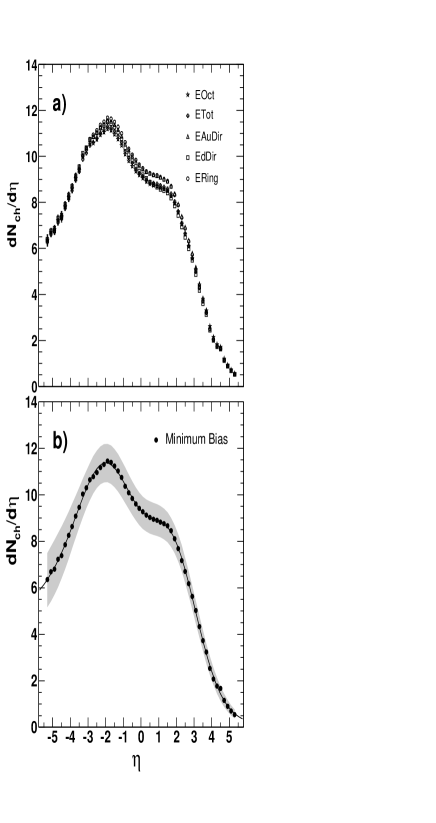
Figure 1a shows the minimum-bias pseudorapidity distributions of primary charged particles measured for collisions at obtained with the five centrality measures described above. The distributions agree to within everywhere. Fig. 1b shows the final result obtained by averaging with equal weights over the five distributions in Fig. 1a. The systematic errors (90 C.L.) are shown as a gray band. The statistical errors are negligible. Fig. 1b clearly shows that the cross section for particle production is largest in the gold direction (), and smallest in the deuteron direction (). By fitting the gold-side using a Gaussian in the region , the peak centroid was found to be at . This peak position is much closer to mid-rapidity than predicted by the parton saturation model Dima2003 , see Fig. 3a. It may be interesting to note that a double Gaussian decomposition of the Au+Au distribution at BacPRL2003 for the most central collisions places the Gaussian centroids at , see Fig. 2. The significance of this observation is, however, not obvious, and may indeed be accidental.
For , the measured average value of the charged particle pseudorapidity density at midrapidity is and the integrated primary charged particle multiplicity in the measured region is . Since falls off to only about half of its maximum value at the most negative pseudorapidity of the detector acceptance, it is non-trivial to estimate the total charged particle multiplicity, , for this system. However, using a triple Gaussian fit to the data we obtain the solid curve in Fig. 1b, which corresponds to a total number of produced charged particles of and the fit of the upper limit of the systematic errors (upper limit of the gray band) gives . We believe, however, that this represents an extreme upper limit for since experimental data on p+A multiplicity distributions at lower energies wit1 ; wit2 ; wit3 ; wit4 ; wit5 , as well as various theoretical models discussed below, indicate that the fall-off at large negative pseudorapidities is more abrupt than indicated by this fit to the data. A more reasonable extrapolation, guided by the expectations based on lower energy p+A data and predictions of the AMPT model, yields an estimate of in the extrapolated region. Therefore, we estimate that the total charged particle multiplicity in this reaction is . It should be kept in mind, however, that even this estimate contains a significant contribution from the unmeasured region of pseudorapidity.
Figure 2 shows the normalized minimum-bias distribution for in comparison to the most central (0–6%) collisions BacPRL2003 and non-single-diffractive collisions from UA5 UA5 at the same energy, . To be consistent with our previous Au + Au pseudorapidity distribution publications, we have used a normalization factor of which is unity for . The distributions from different systems are normalized chiefly to enable a comparison of their shapes. The distribution seen in d+Au collisions at RHIC has features similar to those seen in p+A collisions at lower energies wit1 ; wit2 ; wit3 ; wit4 ; wit5 . Compared to collisions, there is a significant increase in particle production in the gold fragmentation region and a reduction of particle production at positive pseudorapidity in the deuteron direction. The overall normalized production of particles is approximately the same as in proton-(anti-) proton collisions UA5 .
Figure 3a shows a comparison of the measured minimum-bias pseudorapidity distribution to the published predictions of the parton saturation model Dima2003 and the results from RQMD RQMD . It is evident that these models are inconsistent with the data. The parton saturation model overestimates the height of the gold-side peak, underestimates its width, and predicts the peak at rather than as in the data. On the deuteron side, the model underestimates the charged particle production. RQMD drastically underpredicts the particle production and has surprisingly little pseudorapidity asymmetry.
Figure 3b presents the comparison of the measured distribution to the predictions of HIJING HIJING and the published AMPT calculation AMPT . The HIJING calculation (dash-dotted curve) reproduces the deuteron side and the peak of the gold-side, but fails to reproduce the tail in the gold direction (). The AMPT model uses HIJING for the initial stage of the collision, adding a “popcorn mechanism” for baryon-antibaryon production AMPT ; AMPT1 and final-state interactions (FSI). The solid curve is the default, while the dashed curve excludes FSI. We see that both final-state interactions and the popcorn mechanism appear to broaden the gold-side peak, leading to a moderate increase of the particle multiplicity in the region . The ratio of the model predictions to data is shown in Fig. 3c.
In summary, the pseudorapidity distribution of charged particles
produced in collisions at has been measured.
The distribution is rather broad and peaked in the gold direction
similar to observations in p+A collisions at lower collision energies.
The measured pseudorapidity distribution is compared with the
predictions of the parton saturation model as well as microscopic models.
While AMPT predictions fall close to the data, the saturation model overestimates
the asymmetry between particle production in the gold and deuteron hemispheres.
We thank RHIC Operations for providing the variety of colliding systems. This work was partially supported by U.S. DOE grants DE-AC02-98CH10886, DE-FG02-93ER40802, DE-FC02-94ER40818, DE-FG02-94ER40865, DE-FG02-99ER41099, and W-31-109-ENG-38, US NSF grants 9603486, 9722606 and 0072204, Polish KBN grant 2-P03B-10323, and NSC of Taiwan contract NSC 89-2112-M-008-024.
References
- (1) B. B. Back et al., Phys. Rev. Lett, 87, 102303 (2001).
- (2) B. B. Back et al., Phys. Rev. C65, 061901(R) (2002).
- (3) I. G. Bearden et al., Phys. Rev. Lett 88, 202301 (2002).
- (4) D. Kharzeev et al. Phys. Lett. B523, 79 (2001).
- (5) L. V. Gribov et al. Phys. Rep. 100, 1 (1983).
- (6) l. McLerran and R. Venugopalan, Phys. Rep. D49, 2233 (1994); Phys. Rep. D50, 2225 (1994).
- (7) D. Kharzeev et al., arXiv:hep-ph/0212316.
- (8) B. B. Back et al., Nucl. Instr. Meth. A499, 603(2003).
- (9) B. B. Back et al., Phys. Rev. Lett. 91, 052303 (2003).
- (10) M. Gyulassy and X. N. Wang, Comp. Phys. Comm. 83, 307 (1994). We used HIJING v1.381 with standard parameter settings.
- (11) J.E. Elias et al., Phys. Rev. D22, 13 (1980).
- (12) C. de Marzo et al., Phys. Rev. D26, 1019 (1982).
- (13) D. H. Brick et al., Phys. Rev. D41, 765 (1990).
- (14) W. Busza, Acta Phys. Pol. B8, 333 (1977).
- (15) W. Busza and R. Ledoux, Ann. Rev. Nucl. Part. Sci. 38, 119 (1988).
- (16) G. J. Alner et al., Z. Phys. C33, 1 (1986).
- (17) H. Sorge, Phy.Rev. C52, 3291 (1995).
- (18) Zi-wei Lin and Che Ming Ko, arXiv:nucl-th/0301025.
- (19) Zi-wei Lin et al., Nucl. Phys. A698, 375 (2002).