New determinations of gamma-ray line intensities of the Ep = 550 keV
and Ep = 1747 keV resonances of the 13C(p,)14N reaction
J. Kiener1,a, M. Gros2, V. Tatischeff1, D. Attié2, I. Bailly3, A. Bauchet1, C. Chapuis2, B. Cordier2, I. Deloncle1, M.G. Porquet1, S. Schanne2, N. de Séréville1, G. Tauzin2
(1) CSNSM, CNRS-IN2P3 et Université Paris-Sud, F-91405 Campus Orsay, France
(2) DSM/DAPNIA/Service d’Astrophysique, CEA Saclay, F-91191 Gif-sur-Yvette, France
(3) CEA/DIF/DPTA/SP2A/Laboratoire des accélérateurs électrostatiques, BP 12, F-91680 Bruyères-le-Châtel, France
(a) Corresponding author, e-mail: kiener@csnsm.in2p3.fr
Gamma-ray angular distributions for the resonances at Ep = 550 keV and 1747 keV of the radiative capture reaction 13C(p,)14N have been measured, using intense proton beams on isotopically pure 13C targets. Experimental gamma-ray spectra were obtained with three HP-Germanium detectors at four angles for Ep = 550 keV and six angles for Ep = 1747 keV in the range of 0∘ to 90∘ with respect to the proton beam. From the data, relative intensities for the strongest transitions were extracted with an accuracy of typically five percent, making these resonances new useful gamma-ray standards for efficiency calibration in the energy range from Eγ = 1.6 to 9 MeV. Gamma-ray branching ratios were obtained for several levels of 14N and are compared with literature values.
1 Introduction
Detection systems for nuclear gamma-ray lines often need to cover an important part of the whole possible energy range of nuclear transitions from some 10 keV to about 15 MeV. This is true in nuclear spectroscopy, nuclear reaction analysis and gamma-ray astronomy. Energy and efficiency calibration can generally be assured by standard radioactive sources up to 3.5 MeV. Above that energy, one has to use other sources like gamma rays from nuclear reactions. There, the most used reaction is probably the well-studied Ep = 992 keV resonance of the radiative capture reaction 27Al(p,)28Si. It offers a great variety of gamma-ray lines from 1.5 MeV to 10.7 MeV with known relative intensities [1].
This resonance has, however, no strong lines in some relatively large portions of the above cited energy range. Another slight drawback may be the moderate yield of about 10-9 gamma rays per proton. The two resonances at Ep = 550 keV and 1747 keV of the radiative capture reaction 13C(p,)14N offer a similar coverage of the energy range and a factor of about five higher gamma-ray yields. This makes them interesting complementary or alternative gamma-ray sources for energy and efficiency calibrations.
These two 13C(p,) resonances have been used for the ground calibration of the gamma-ray spectrometer SPI of the INTEGRAL satellite in the energy range Eγ = 1.6 to 9 MeV [2]. In the analysis of these calibration runs, it became clear that the relative line intensities calculated from the published branching ratios of the involved 14N levels needed reinvestigation [3]. We therefore decided to determine experimentally the relative intensities for the strongest lines of both resonances aiming at accuracies of better than ten per cent. This was achieved by the measurement of high-statistics spectra with HP-Ge detectors, for both resonances in the angular range of 0∘ to 90∘.
A particular effort was made at 45∘ with respect to the proton beam, which was the angle of SPI during the ground calibration runs, where we obtained relative intensities of the strongest lines with an accuracy of three to five per cent. In order to allow detector efficiency calibrations at any angular position, gamma-ray angular distributions for both resonances were determined. For the 550 keV resonance, which is dominated by s-wave capture with a small probable contribution of d-wave capture, gamma-ray line intensities were measured at four angles. The 1747 keV resonance has p-wave and f-wave capture contributions and data were taken at six angular positions to determine the gamma-ray angular distributions.
Additionally, angle-integrated line intensites from Legendre polynomial fits to the angular distribution data permitted extraction of gamma-ray branching ratios for several levels of 14N. Angle-integrated line intensities and branching ratios are then compared to recent literature values and discussed. Finally, we propose new values for the gamma-ray branchings of the 6.446, 8.062 and 9.172 MeV levels of 14N.
2 Experiment
The experiment was done at the 3 MV Van-de-Graaff accelerator of the CEA at Bruyères-le-Châtel. Proton beams of 100 to 250 A intensity were directed onto an isotopically pure 13C target of 129 g/cm2, evaporated on a water-cooled tantalum disk. The target chamber was isolated from the rest of the beam line and served as a Faraday cup for the beam current integration. During the irradiation runs, the water temperature was monitored to detect a possible degradation of the target or deviations of the proton beam.
Three coaxial HP-Ge detectors of 100-250 cm3 were used for the detection of the gamma rays. Two of the detectors were used for monitoring purposes, sitting at fixed positions at 45∘ to the left (detector named “D03”) and to the right (detector named “P2F”) with respect to the proton beam. D03 and P2F were placed at 1 m and 1.675 m distance from the target position, respectively. The third detector (named “D02”) was used for the angular distribution measurements and took spectra at 0∘, 30∘, 60∘ and 90∘ for both resonances and additionally at 15∘ and 45∘ for the 1747 keV resonance, at a distance of 1 m from the target. Positioning accuracy was estimated to be better than 5 mm for D02 and P2F, and better than 1 cm for D03. Energy and efficiency calibration of the detectors were done with natural background lines, an 88Y source and the Ep = 992 keV 27Al(p,) resonance. The energy resolutions (FWHM) of the detectors at 1836/9200 keV were 2.6/6.9 keV (D03), 3.0/9.2 keV (P2F) and 2.4/7.2 keV (D02).
Before starting the long irradiation runs, both resonances were scanned in steps of 5 to 10 keV to find the maximal gamma-ray yield. This is especially important for the Ep = 550 keV resonance, whose resonance energy and width ( 30 keV; this corresponds approximately to the proton energy loss in the target) is relatively uncertain (see e.g. [4] and references therein). The Ep = 1747 keV resonance is a narrow resonance ( = 122 eV) and the gamma-ray yield reaches a plateau for Ep above 1748 keV for the target used in this experiment. The energy chosen was approximately in the middle of the yield plateau. The same was done for the narrow Ep = 992 keV 27Al(p,) resonance, which was used for efficiency calibration of the detectors. It was also checked, that the yield was independent of the beam current in the range 20 to 200 A.
The long irradiation runs were done with beam currents of typically 250 A for the 550 keV resonance, 200 A for the 992 keV resonance, and 100 A for the 1747 keV resonance and lasted for at least three hours. For the strongest gamma-ray lines of each resonance in these runs, a minimum of 25000, 60000 and 25000 events for the 9169 keV, 1779 keV and 8160 keV lines, respectively, have been collected in the full-energy peak for detector P2F. Detectors D03 and D02 were closer to the target and registered on average about a factor of two more events. No target degradation was observed during the experiment.
Efficiency calibration of the three HP-Ge detectors was done with the 27Al(p,) resonance and an intense 88Y source. High-statistics spectra of the resonance were taken with the monitor detectors at 45∘ and with D02 at 0∘, 60∘ and 90∘, to obtain effective efficiency curves at these angles which include implicitely the energy- and angle-dependent effect of absorption in the target backing and the support structure. Special attention was paid to obtain sufficient statistics for all gamma rays of the reaction, whose angular distribution were determined by Anttila et al. [1] and to have the same conditions in the irradiation runs of this 27Al(p,) resonance and the two 13C(p,) resonances. The 88Y source has also been used to determine the gamma-ray absorption in the tantalum backing, and the support structure of the target, by taking spectra with D02 at eight different angles in the range 0∘ to 110∘.
3 Data analysis
Cumulative spectra of the different runs for the three detectors were acquired with two independent commercially available acquisition systems with automatic deadtime correction capabilities. Energy calibration was done with the natural background lines of 40K and the decay chains of 226Ra and 228Th and some selected 27Al(p,) lines. Extraction of the gamma-ray line intensities were entirely based on the full-energy peaks with the exception of some background lines, as explained below.
Peak integration including background subtraction was done with the GF3 code from the RadWare software package [5]. Several gamma-ray lines of the 13C(p,) resonances are broad and some of them have complex structures due to gamma-ray emission during the slowing down process of the 14N in the target. In these cases, peak integration and background subtraction were guided by simulations of the line profiles. Details about this procedure can be found in [3]. An additional estimated uncertainty was linearly added to the statistical uncertainty in cases where the background level was judged uncertain.
3.1 Detector efficiencies
We aimed at the extraction of relative line intensities for all transitions with intensities above 1% with respect to one capture reaction for both 13C(p,) resonances. That comprises gamma-ray lines with energies ranging from 1635 keV to 9200 keV, meaning that the detector efficiency curves must be determined precisely over the whole range. The 27Al(p,) resonance offers gamma-ray lines between 1522 keV and 10763 keV whose intensities are well studied. We used all gamma rays whose angular distribution have been determined by Antilla et al. [1] plus the four gamma rays at 1522, 1658, 7924 and 7933 keV to improve the energy coverage. For these last four gamma rays, we added a systematic uncertainty of twenty per cent to the intensity for possible anisotropies of the angular distribution.
The resonance lines completed with the two lines of the 88Y source at 898 keV and 1836 keV, cover the desired energy range and allow also absolute efficiency calibrations. It permitted furthermore the study of two lines at 1340 keV and 728 keV, which have intensities 1%. A simple linear interpolation of detector efficiency between the data points however, would only result in a moderately good definition of the efficiency curve in some energy domains. This holds notably for the region between 6.5 MeV and 10.5 MeV where only two close gamma-ray lines at 7924 and 7933 keV are available [1].
The choice of the function for analytical fits to the data suffered equally from the scarcety of 27Al(p,) gamma-ray lines and the uncertainties of their intensities in some energy domains. We performed therefore Monte-Carlo simulations of the gamma-ray response of the three Ge detectors to find the functions which fit best their full-energy peak efficiency curves. The code GEANT was used for this purpose [6]. As only the full-energy peak efficiency was looked for, we restricted the simulated detector geometry to the Ge crystal and its housing. The simulations were done using the experimental detector-source distances and crystal geometries, including the dead layer due to the n+ contact of the coaxial n-type HP-Ge, which was very important for the high-energy response of the detectors. The detector crystal response was then simulated for monoenergetic gamma rays between 728 keV and 11 MeV, whereby for each energy 2000 (or more) full-energy peak events were used.
The simulated relative full-energy peak efficiencies were then multiplied with a transmission factor, which takes into account the absorption of the gamma rays in the target-support structure and the air between the target and the detectors. The absorption in the target support was measured with the 88Y source and was found for emission angles between 0∘ and 45∘ to be in agreement with calculations using the photon cross section database of NIST [7] and the properties of the support structure (i.e. 1 mm Ta, 9.5 mm water and 1 mm stainless steel). Finally, a power-law function of linear varying index with energy proved to give an excellent fit to both the experimental and the simulated relative efficiency data:
| (1) |
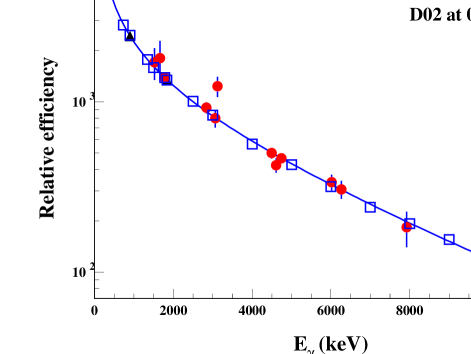
, where Eγ is the gamma-ray energy and a, b and c are constants which depend on the detector and its angular position. The reduced for the fits of the experimental data ranged from 0.76 to 0.88 for detectors D03 and P2F at 45∘ and for D02 at 0∘, while the deviation of the simulated data from the fits stayed well below five per cent in the whole energy region. For larger emission angles, besides the target-support structure there was additional absorption in the target chamber material and absorption calculations became very complex. Comparison with simulated efficiencies were therefore not done for these data. However, fits with the function of eq. 1 still gave a very good description of the 27Al(p,) data for detector D02 at 60∘ and 90∘ (reduced 0.81 and 1.16, respectively) and were therefore also used for these efficiency curves. For D02 at 15∘, 30∘ and 45∘, the efficiency curve obtained at 0∘ has been used, corrected for the additional absorption due to the non-normal incidence of the gamma rays in the target-support structure. Examples of efficiency data together with the power-law fits are shown in fig. 1. The absolute normalization of the efficiency curves will be treated in the section on gamma-ray angular distributions.
3.2 Relative line intensities
The relative gamma-ray line intensities have been extracted at all measured angles for both resonances. A special effort was made at 45∘, which was the angle of the INTEGRAL spectrometer SPI during its calibration campaign [2] [3]. With both monitor detectors D03 and P2F, high-statistics spectra could be obtained at 45∘ by accumulation of several 3-hour runs. Additionally, one 3-hour run for the 1747 keV resonance was taken with D02 at this angle. Relative line intensities at the other angles have only been measured with detector D02, representing one 3-hour run at each angle with the conditions described in the section II.
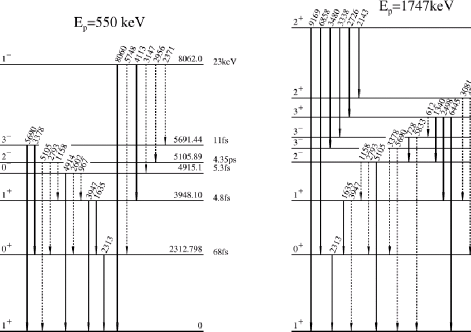
Relative intensities of eight lines were extracted for the 550 keV resonance. The relatively strong lines from the 8062 4915 keV and 8062 5691 keV transitions were omitted, because they partially overlap with escape peaks from other lines. For the 1747 keV resonance, relative intensities for a total of fourteen lines could be obtained. Partial level schemes of 14N with the important gamma-ray transitions for both resonances are displayed in fig. 2.
Special attention had to be paid to several lines of the 1747 keV resonance whose full-energy peaks were merged with background lines. The 5105 keV line is blended with the second escape peak of the 6129 keV line from the 19F(p,)16O reaction. A similar problem affects the 1635 keV line whose full-energy peak overlaps with the first escape peak of the 2143 keV line. The contribution of these components were subtracted from the lines after determining the escape-peak to full-energy-peak ratios for the three different detectors in the respective energy domains. A background line of the 228Th decay chain was blended with the 728 keV line. It has been subtracted by making use of the 2614 keV line intensity during the irradiation runs and the observed 728 keV to 2614 keV line ratios in several radioactive background measurements performed during the experiment.
The uncertainty on the relative intensities comprises the statistical one with an eventual additional uncertainty due to uncertain background as explained above, and an estimated uncertainty of five per cent for the efficiency calibration, with the exception for the 728 keV line, where ten per cent were taken. For the 5106, 1635 and 728 keV lines, uncertainties due to the subtraction of the background lines were added. All uncertainties were added quadratically. The 45∘ data are weighted averages of the results of the three detectors. The relative intensities are presented in table 1 for the 550 keV resonance and in table 2 for the 1747 keV resonance.
3.3 Angular distributions
Angular distributions were determined for both resonances. The 550 keV resonance is dominated by s-wave capture, and the gamma-ray emission should be not far from isotropic. However, a minor contribution from d-wave capture cannot be excluded. In a simple potential model, the ratio of Coulomb barrier transmission factors between d-wave and s-wave proton capture on 13C is about 2.510-3 at Ep = 550 keV, which could lead to slight anisotropies of the gamma-ray emission, e.g. up to 5% for the 8062 keV to ground-state transition. The angular distributions were measured at four angles for this resonance to verify the level of isotropy.
The gamma-ray angular distributions of the 1747 keV resonance are a-priori not isotropic due the p-wave and f-wave character of the proton capture. Only data for a few of the gamma-ray angular distributions are availabale in the literature for this resonance [8] [9]. We decided therefore to accurately determine the angular distributions of the strongest gamma-ray lines. Data with the detector D02 were taken at six angles between 0∘ and 90∘ while the 45∘ data from the two monitor detectors were also used for the determination of the angular distribution.
Normalization of the different efficiency curves of P2F, D03 and D02 (0∘) with respect to each other were done with the 898 keV and 1836 keV lines of the 88Y source. For D02 at 15∘, 30∘ and 45∘ the 0∘ efficiency curve was corrected for transmission to account for the additional absorption of the gamma rays in the target-support structure due to the non-normal incidence of the gamma rays. The 60∘ and 90∘ efficiency curves of D02 were normalized to the 0∘ efficiency with the help of the monitor detectors, using the 1779 keV line of the 27Al(p,) reaction, whose angular distribution is well defined. The product of accumulated beam charge Q and target thickness during the different runs was monitored by the D03 and P2F detectors, where the intensity of the strongest gamma-ray lines was used for the normalization.
The uncertainty of the angular distribution data points is due to the uncertainties from peak integration, including the Q normalization with the monitor detectors, and an estimated uncertainty in detector efficiency with respect to the 0∘ efficiency. This last one was taken to be 2.5% at 15∘ and 30∘, 5% at 45∘ and 60∘ and 10 % at 90∘. These uncertainties were added quadratically.
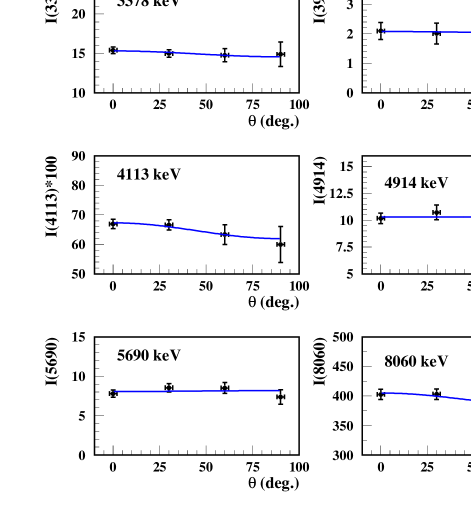
Angular distributions for gamma-ray lines of the 550 keV resonance are shown in fig 3. All angular distributions are essentially isotropic, with anisotropies not exceeding five per cent, with a probable exception of the 4113 keV line, where it may reach ten per cent. The angular distributions have been adjusted by Legendre polynomials ) of even order:
| (2) |
, where is the smaller of twice the spin of the emitting state or twice the transition multipolarity L. For this resonance, all observed transitions have 1, such that 2. We did not include the usual attenuation coefficients because they differ less than three per thousand from unity in our geometry. The angle-integrated line intensities P and the coefficient ratios are presented in table 3.
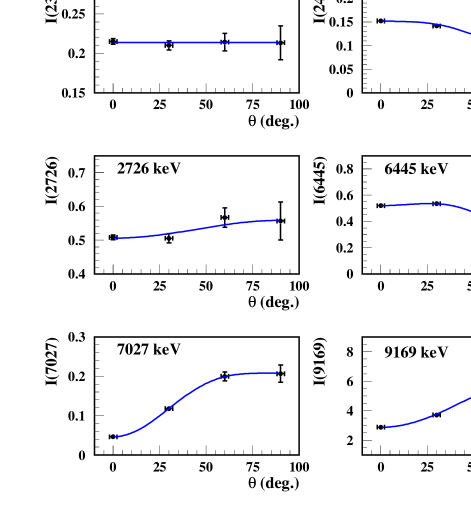
Results for the 1747 keV resonance are presented in table 4 and selected angular distributions are shown in fig. 4. For this resonance only three of the studied gamma-ray transitions have a unique assignment for the transition multipolarity: E1 and E2 for the 1635 and 6858 keV lines, respectively, and the 2313 keV line emission is isotropic because of = 0. The two 3+ 1+ transitions were assumed to be predominantly E2 and their angular distributions fitted with = 4.
Among the other nine transitions, four could be E1-M2 mixtures ( = 1; change of parity) and five M1-E2 mixtures ( = 1; no change of parity). For these nine transitions, we performed fits with both = 2 and = 4. We found that only the angular distribution of the 7027 keV line required an coefficient different from zero, the fit improving considerably with = 4. The fit for the 3338 keV line yielded an coefficient slightly different from zero with, however, no significant improvement of the fit. For the other seven distributions the coefficient was compatible with zero, the reduced improving generally for = 2. Assuming that M2 (resp. E2) transitions are negligible with respect to E1 (resp. M1) for these transitions, we adopted = 2.
4 Results and discussion
4.1 The Ep = 550 keV resonance
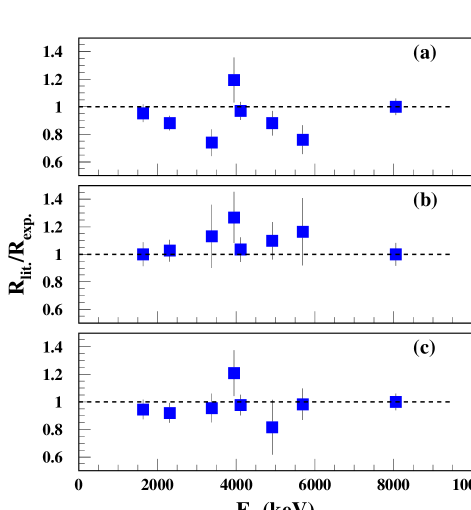
A comparison of our integrated line intensities with literature values, calculated from published gamma-ray branching ratios of the involved levels in 14N, is shown in fig. 5. The values of the compilation of Firestone et al. [10] (identical to that of Ajzenberg-Selove [11]) (fig. 5a), are clearly in disagreement with our data with the exception of three strong lines, while a substantial improvement can be seen, when replacing the compilation branching ratios of the 8062 keV level with those of the recent experiments of King et al. [12] (fig. 5b) or Zeps et al. [13] (fig. 5c). Then, all relative line intensities are compatible with ours, except for the very weak line at 3947 keV which is about twenty per cent stronger in the other data sets.
It seems that the branching ratios of the 8062 keV level in the compilations are taken essentially from the experimental determination of Renan et al. [14]. It is not clear why their line intensities differ significantly from ours and that of [12] [13] for several lines. This experiment used also Ge detectors and the 27Al(p,) reaction for efficiency calibration. A possible explanation could be the fact that the efficiency calibration was based not only on full-energy peaks and that older data and other resonances of the 27Al(p,) reaction were used.
We extracted therefore from our data new branching ratios of the 8062 keV level. The intensities for the transitions to the 3948 keV and the ground state have been taken directly from the corresponding relative line intensities. The transition intensities to the 4915 and 5691 keV levels have been taken from the 4914, 5690 and 3378 keV gamma-ray transitions which depopulate these levels. The gamma-ray lines corresponding to transitions from the 8062 keV level to the 2313 and 5106 keV levels were not strong enough to obtain angular distributions. They were only extracted from summed spectra of the two monitor detectors at 45∘. We added for their relative line intensities a systematic uncertainty of ten per cent to the standard uncertainties due to possible anisotropies in the angular distributions. Our 8062 keV level branching ratios are presented in table 5 together with previous data. Branching ratios for the levels at 3948 keV and 5691 keV could also be extracted. They are in agreement with the compilation values but are less precise than these and are therefore not presented.
4.2 The Ep = 1747 keV resonance
Some angular distributions for this resonance have been published before. The most accurate and extensive data can be found in Prosser et al. [8] and Sievers et al. [9], who measured the angular distributions of the 9169, 7027, 6857, 6446, 2726, and 2143 keV lines. Prosser et al. published the results of Legendre polynomial fits to the angular distributions. They are in good agreement with ours, except for the 7027 keV line, where their a2/a0 and a4/a0 coefficients differ from ours sligthly. This may be explained by the fact that Prosser et al. used NaI detectors, where the 7027 and 6857 keV lines were superposed and sitting on the tail of the 9169 keV line complex. Good to excellent agreement with the measured angular distributions of Sievers et al. is observed.
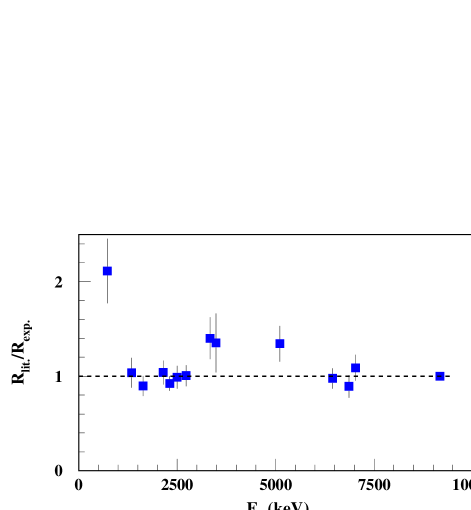
The comparison of our line intensities with the values calculated from the published gamma-ray branching ratios [10] in fig. 6 shows good agreement, with the notable exception of the 728, 3338 and 5106 keV lines. Most striking is the difference for the 728 keV line where our intensity is about a factor of two lower than the literature value. This line corresponds to the only transition depopulating the 5834 keV level (see fig. 2). A small part of the difference can be explained by the fact that we find slightly lower intensity of the 3338 keV line in our experiment, which populates the 5834 keV level.
The only other transition indicated in the compilation which populates this level, 6446 keV 5834 keV, produces a 612 keV line which should have an intensity of about 0.4% with respect to the 9169 keV line. However, the 612 keV line is Doppler broadened and very weak in our spectra and in addition close to the 609 keV background line from the 226Ra decay chain. We could only extract an upper limit of 0.1% with respect to the 9169 keV line. The sum of both transitions populating the 5834 keV level in our experiment is compatible with our extracted intensity of the 728 keV transition depopulating this level. We conclude, that the most probable explanation of the disagreement is the 6446 keV 5834 keV transition, whose branching ratio is at least a factor of four smaller than given in the compilations.
New branching ratios for the 9172 keV and the 6446 keV level are presented in table 5 together with values of the compilations. For both levels, we have extracted angular distributions of all depopulating transitions listed in the compilations with the exception of the very weak 6446 keV 5834 keV transition, and our branching ratios were taken directly from the respective angle-integrated gamma-ray line intensities.
4.3 Conclusion
The Ep = 550 keV and 1747 keV resonances of the 13C(p,)14N reaction provide an interesting alternative to the widely used Ep = 992 keV resonance of the 27Al(p,)28Si reaction for energy and efficiency calibration of gamma-ray detectors in the energy range from about 1.6 MeV to 9 MeV. Relative line intensities of eight gamma-ray lines at five angles with respect to the proton beam for the 550 keV resonance and of fourteen lines at six different angles for the 1747 keV resonance have been obtained in this study. Uncertainties in relative line intensities are typically of the order of five per cent for a dozen strong lines and even slighter better at 45∘, allowing to use these data directly for precise efficiency calibrations at the chosen specific angles. Additionally, gamma-ray angular distributions have been obtained for all twenty-two gamma-ray lines to permit efficiency calibrations at any angle and allowing the extraction of gamma-ray branching ratios for several levels of 14N. We present new branching ratios for the 6446, 8062 and 9172 keV levels. In particular, we propose new branching ratios for the 8062 keV level which are consistent with two other recent experiments, but differ considerably from the values of the compilations [10] [11].
References
- [1] A. Anttila, J. Keinonen, M. Hautala and I. Forsblom, NIM 147 (1977) 501
- [2] S. Schanne et al., Proceedings of the SPIE conference on X-ray and Gamma-ray astronomy, 22-28 August 2002, Waikoloa, Hawaii, USA
- [3] M. Gros et al., SPI database no. SAp-SPI-STP-468-02, Service d’Astrophysique CEA Saclay, internal report, unpublished
- [4] W. Galster et al., Phys. Rev. C44, (1991) 2776
- [5] D.C. Radford, Nucl. Instr. Meth. A361 (1995) 297
- [6] CERN Program Library Office (Online), Available: http://wwwinfo.cern.ch/asdoc/geant_html3/geantall.html
- [7] M. J. Berger, J. H. Hubbell, S. M. Seltzer, J. S. Coursey and D. S. Zucker, XCOM: Photon Cross Section Database (version 1.2), [Online]. Available: http://physics.nist.gov/xcom [2002,September 17]. National Institute of Standards and Technology, Gaithersburg, MD (1961) 194
- [8] F.W. Prosser, Jr., R.W. Krone, and J.J. Singh, Phys. Rev. 129 (1963) 1716, and references given therein
- [9] W.L. Sievers et al., Phys. Rev. C 13 (1976) 2546
- [10] R.B. Firestone, V.S. Shirley, C.M. Baglin, S.Y. Frank Chu and J. Zipkin, “Table of isotopes”, John Wiley Sons, Inc., 1996
- [11] F. Ajzenberg-Selove, Nucl. Phys. A523 (1991) 1
- [12] J.D. King et al., Nucl. Phys. A567 (1994) 354
- [13] V.J. Zeps et al., Phys. Rev. C 51 (1995) 1494
- [14] M.J. Renan, J.P.F. Sellschop, R.J. Keddy and D.W. Mingay, Nucl. Phys. A193 (1972) 470
| Eγ (keV) | 0∘ | 30∘ | 45∘ | 60∘ | 90∘ |
|---|---|---|---|---|---|
| 8060 | 100 | 100 | 100 | 100 | 100 |
| 5690 | 1.940.14 | 2.120.16 | 2.050.13 | 2.190.18 | 2.000.18 |
| 4914 | 2.530.17 | 2.660.21 | 2.600.13 | 2.570.20 | 2.560.23 |
| 4113 | 16.620.87 | 16.510.89 | 16.320.66 | 16.250.87 | 16.240.90 |
| 3947 | 0.520.07 | 0.500.09 | 0.520.06 | 0.550.11 | 0.530.12 |
| 3378 | 3.820.21 | 3.720.21 | 3.790.18 | 3.790.22 | 4.030.24 |
| 2313 | 21.931.11 | 21.671.11 | 22.200.73 | 22.521.16 | 23.781.24 |
| 1635 | 15.530.79 | 15.330.79 | 15.940.50 | 16.670.86 | 17.210.90 |
| Eγ (keV) | 0∘ | 15∘ | 30∘ | 45∘ | 60∘ | 90∘ |
|---|---|---|---|---|---|---|
| 9169 | 100 | 100 | 100 | 100 | 100 | 100 |
| 7027 | 1.610.14 | 2.380.19 | 3.180.20 | 3.750.13 | 3.450.20 | 3.270.20 |
| 6857 | 1.060.24 | 1.460.14 | 2.010.14 | 2.020.08 | 1.200.10 | 0.400.19 |
| 6445 | 18.050.94 | 17.561.02 | 14.410.75 | 10.220.32 | 6.930.37 | 4.000.30 |
| 5105 | 1.730.27 | 1.940.57 | 1.380.23 | 1.010.06 | 0.880.20 | 0.860.19 |
| 3480 | 0.360.11 | 0.350.08 | 0.350.06 | 0.4340.024 | 0.490.13 | 0.410.07 |
| 3338 | 0.750.12 | 0.810.10 | 0.740.05 | 0.5710.025 | 0.460.05 | 0.410.06 |
| 2726 | 17.640.89 | 16.920.86 | 13.620.69 | 11.500.33 | 9.800.50 | 8.830.45 |
| 2498 | 5.280.27 | 5.080.27 | 3.810.20 | 2.890.09 | 1.950.10 | 1.070.06 |
| 2313 | 7.460.38 | 7.160.37 | 5.670.29 | 4.520.13 | 3.710.19 | 3.390.18 |
| 2143 | 9.800.50 | 9.210.47 | 6.300.32 | 4.550.13 | 3.170.16 | 2.260.12 |
| 1635 | 2.770.20 | 2.720.18 | 2.400.16 | 2.330.08 | 2.190.13 | 2.110.13 |
| 1340 | 0.820.07 | 0.900.06 | 0.730.06 | 0.6970.025 | 0.640.05 | 0.640.06 |
| 728 | 0.480.06 | 0.520.07 | 0.390.05 | 0.4280.027 | 0.460.06 | 0.360.06 |
| Eγ (keV) | Ei Ef | Ji Jf | P | a2/a0 | |
|---|---|---|---|---|---|
| 8060 | 8062 0 | 1- 1+ | 1003.3 | 0.0370.042 | 0.19 |
| 5690 | 5691 0 | 1- 1+ | 2.080.15 | -0.00960.068 | 1.05 |
| 4914 | 4915 0 | 0- 1+ | 2.630.16 | 0.29 | |
| 4113 | 8062 3948 | 1- 1+ | 16.31.0 | 0.0560.045 | 0.14 |
| 3947 | 3948 0 | 1+ 1+ | 0.5220.064 | 0.0170.16 | 0.06 |
| 3378 | 5691 2313 | 1- 0+ | 3.790.24 | 0.0340.048 | 0.08 |
| 2313 | 2313 0 | 0+ 1+ | 22.51.2 | 0.06 | |
| 1635 | 3948 2313 | 1+ 0+ | 16.21.0 | -0.0190.040 | 0.33 |
| Eγ (keV) | Ei Ef | Ji Jf | P | a2/a0 | a4/a0 | |
|---|---|---|---|---|---|---|
| 9169 | 9172 0 | 2+ 1+ | 1002.5 | -0.4660.029 | 0.60 | |
| 7027 | 7029 0 | 2+ 1+ | 3.350.22 | -0.4910.080 | -0.2480.050 | 1.31 |
| 6858 | 9172 2313 | 2+ 0+ | 1.120.10 | 0.5090.138 | -1.0350.134 | 1.41 |
| 6445 | 6446 0 | 3+ 1+ | 7.460.37 | 0.5600.060 | -0.2590.045 | 0.37 |
| 5105 | 5106 0 | 2- 1+ | 0.920.10 | 0.0120.162 | 0.23 | |
| 3480 | 9172 5691 | 2+ 1- | 0.4290.045 | -0.580.14 | 0.67 | |
| 3338 | 9172 5834 | 2+ 3- | 0.5140.039 | -0.0650.090 | 0.75 | |
| (3338) | 0.4960.040 | 0.0340.116 | -0.1650.109 | 0.22 | ||
| 2726 | 9172 6446 | 2+ 3+ | 10.340.59 | -0.0840.031 | 1.36 | |
| 2498 | 6446 3948 | 3+ 1+ | 2.070.12 | 0.5670.054 | -0.1980.043 | 2.83 |
| 2313 | 2313 0 | 0+ 1+ | 4.010.21 | 1.12 | ||
| 2143 | 9172 7029 | 2+ 2+ | 3.560.20 | 0.4740.036 | 2.70 | |
| 1635 | 3948 2313 | 1+ 0+ | 2.240.12 | -0.3490.025 | 0.67 | |
| 1340 | 6446 5106 | 3+ 2- | 0.6540.044 | -0.2810.058 | 1.05 | |
| 728 | 5834 5106 | 3- 2- | 0.4120.047 | -0.3870.079 | 1.72 |
| level | transition | branching ratios | |||
|---|---|---|---|---|---|
| Ei (keV) | Ef (keV) | this work | King et al. [12] | Zeps et al. [13] | compilations [10] [11] |
| 8062 | |||||
| 0 | 1000.7 | 1005.8 | 1000.5 | 1000.8 | |
| 2313 | 2.190.33 | 2.390.35 | 1.50.9 | 1.740.18 | |
| 3948 | 16.31.0 | 16.91.4 | 15.90.8 | 15.80.5 | |
| 4915 | 2.630.20 | 2.890.30 | 2.10.5 | 2.320.18 | |
| 5106 | 0.730.14 | 0.830.16 | 1.00.5 | 0.310.18 | |
| 5691 | 5.870.28 | 6.71.4 | 5.70.5 | 4.40.5 | |
| 9172 | |||||
| 0 | 1000.9 | 1001.2 | |||
| 2313 | 1.120.10 | 1.000.10 | |||
| 5691 | 0.430.05 | 0.580.12 | |||
| 5834 | 0.510.04 | 0.720.10 | |||
| 6446 | 10.340.64 | 10.41.0 | |||
| 7029 | 3.560.22 | 3.70.4 | |||
| 6446 | |||||
| 0 | 1002.7 | 1002.1 | |||
| 3948 | 27.72.1 | 28.11.4 | |||
| 5106 | 8.80.7 | 9.30.9 | |||
| 5834 | 1.3 | 5.30.9 |