Indication of a strange tribaryon S+ from the 4He(stopped K-,n) reaction
Abstract
We measured the neutron time-of-flight spectrum in the 4He() reaction by stopping negative kaons in a superfluid helium target. A clear enhancement was observed in the neutron spectrum, which indicates the formation of a strange tribaryon of charge +1 with a mass and width of 3141 3 (stat.) (sys.) MeV/ and MeV/. This state, denoted as S+(3140), is about 25 MeV/ higher than the previously observed S0(3115) .
, , , , , , , , , , , , , , , , , , , , , , , , , , , ,
1 Introduction
Very recently, we have discovered a strange tribaryon, S0(3115), via the
| (1) |
reaction [1]. The observed state has isospin , charge and mass 3117 MeV/.
Where is the isospin = 0 state? It is also important to search for an isospin partner of the observed state, S0(3115) = 1. The S0(3115) discovery was originally motivated by the theoretical prediction of a deeply-bound kaonic state by Akaishi and Yamazaki at = 3194 MeV/ with and [2], which can only be studied via the
| (2) |
reaction. In this reaction, both isospin = 0 and 1 states can be populated, while the reaction (1) is limited to forming = 1. We describe the study of the neutron spectrum obtained from reaction (2) to provide further important information on the strange tribaryon.
2 The experiment
Let us briefly summarize the experiment while focusing on a neutron measurement. A more detailed description is given in Refs. [1, 3].
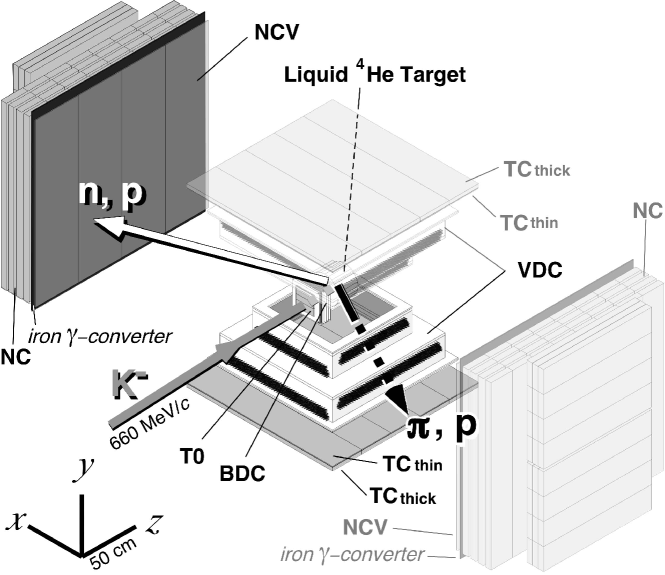
To obtain the neutron spectrum, we adopted the time-of-flight (TOF) method, as shown in Fig. 1. For this purpose, we need to define the kaon reaction point by the vertex between the trajectory of an incoming kaon and that of an outgoing charged particle detected by two layered trigger counters (TC), namely TCthin and TCthick. The resolution of the reaction points/vertex was 5 (), which is predominantly determined by kaon multiple scattering in the target helium. The kaon reaction at-rest in the target volume was selected (purity ) by using the correlation between the pulse height of the final beam counter (T0) and the range in the helium target obtained by the vertex position. The reaction (neutron TOF start) timing was calculated from the T0 timing and the kaon range in the target, and the neutron was detected by two sets of plastic scintillation counter arrays (NC). An absolute time calibration of the TOF was performed by electromagnetic showers produced in iron-plate converters, placed between NC veto counters and NC, itself. The overall TOF resolution was measured by this shower event, and was found to be . The absolute momentum was checked using mono-energetic neutrons from decay at rest () by back-to-back coincidence with the threshold at 3 MeV (MeV) applied to NC.
In a following analysis, we set a rather high energy threshold to the NC system (10 MeV) at the analysis stage, so as to reduce the accidental neutron background. At this threshold, an NC counter of 5 cm thickness become sensitive at 150 MeV/, and saturate at 340 MeV/. Beyond this, the efficiency is constant at 20%.
3 Analysis procedure
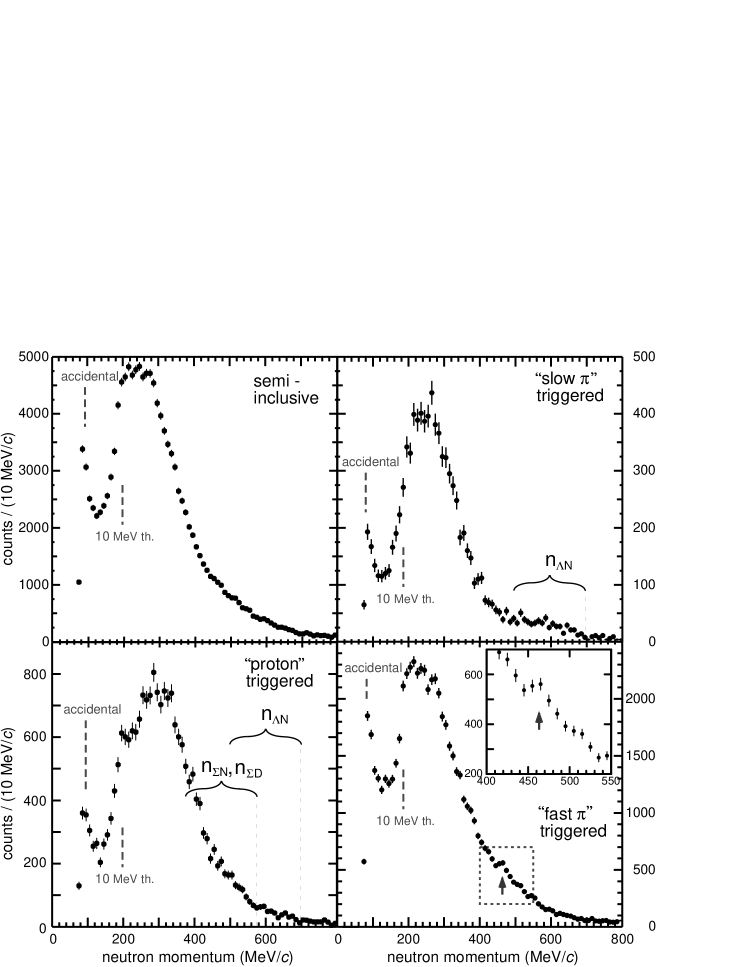
As shown in Fig. 2 (upper left), the semi-inclusive neutron spectrum does not yield any distinct peak, in contrast to the proton spectrum [1].
To study the neutron spectrum in more detail, we focused on pions that came from hyperon decay. focused on pions that came from If these pions come from hyperon decay, the mother hyperon could be qualitatively identified by the pion momentum. The momentum of the pion from distributes dominantly in the lower momentum side (mostly below 100 MeV/) compared to that from a charged (centered at about 190 MeV/) [4].
For a further study, we proceeded to an analysis of the hyperon motion based on the vertex inconsistency. If the hyperon moves a certain length, the two trajectories between the incoming kaon and the outgoing charged pion could be separated by the motion before the decay. On the other hand, if the triggered pion come from the quasi-free hyperon production (QF : ), the vertex should coincide within the experimental resolution.
If the main decay channel of is similar to that of , then one can assume that the is the major decay channel. Thus one expects
| (3) |
which is an ideal model to apply the analysis procedure described above, because is expected to be boosted at the formation stage.
4 Neutron spectra classified by TC
Let us define the event window using the TC information. Fig. 3 shows the scatter plot of on two layers of the TC counters. To select high-momentum pions ( 125 MeV/), which mainly come from decay, we proceeded as follows. From the simulation, we know that the pions, which penetrate both layers ( 100 MeV/), should distribute mostly inside the dashed region. We evaluated the distribution center by using an average of the data within this region. The central track obtained is shown in the figure as a solid line, and the evaluation of the momentum along the track led us to select the “fast ” triggered event window (hatched area in the dashed region). This window is well apart from the “proton” window shown in the figure.
The “slow ” triggered event window is defined so as to select pions that stop in the TC counters ( 90 MeV/). Apart from the region shown in the figure, we also included a very slow pion which had already stopped in TCthin, because these events can be easily selected by the pulse height and TDC information.
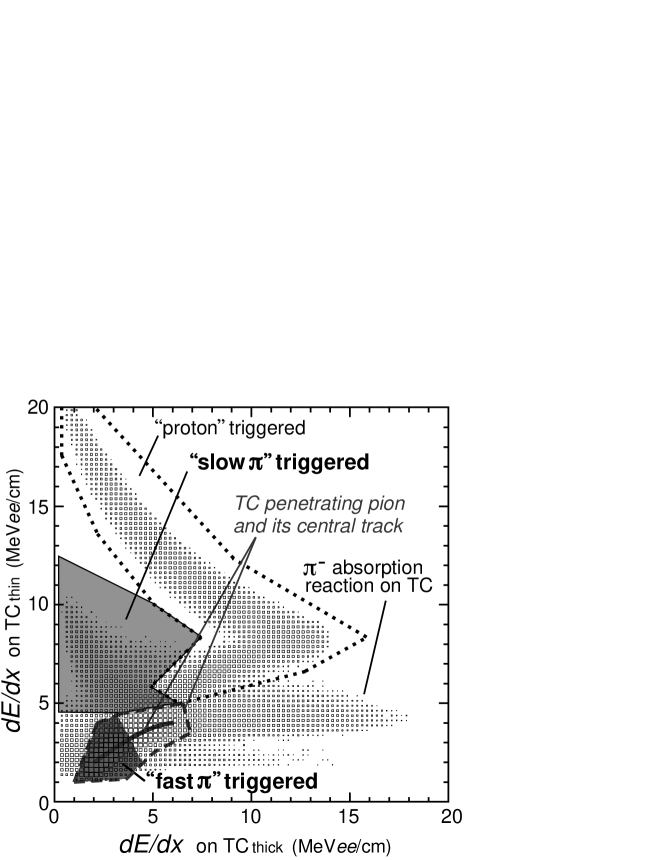
Fig. 2 shows the neutron momentum spectra for “proton” (lower left), “slow ” (upper right) and “fast ” (lower right) triggered events tag. There exists a common structure up to 400 MeV/. This low-momentum component mainly comes from the absorption reaction (occurring in or around the target), [5], and cascade reactions followed by QF-hyperon formation [3].
The “slow ” triggered neutron spectrum has a “plateau” structure beyond 450 MeV/. This comes from the kaon non-mesonic absorption and its chain,
| (4) |
where is the neutron from the non-mesonic kaon absorption reaction. Note that pions from decays do not contribute when we select low-momentum pions [4]. The spectrum shape of is dominantly determined by three-body phase space and the nuclear form factor, and is very broad, as shown in the figure. It has a maximum momentum of 700 MeV/, and forms a “flat-plateau” below 600 MeV/.
Similar to the “slow ” triggered events, the neutron spectrum of “fast ” triggered events is expected to have a high-momentum component due to
| (5) |
where is the neutron at the primary reaction and is that from decay. The should have a nature very similar to the in reaction (4), but shifted by 100 MeV/ to the lower side. Therefore, a “plateau” below 500 MeV/ is expected. Actually, the “proton” triggered event is not selective to , or , as indicated in Fig. 2 (lower left).
There exists a peak-like structure at 470 MeV/ in the “fast ” triggered event (Fig. 2 (lower right)), at the momentum where we expect a “plateau” due to and . Is this peak-like structure due to the formation of the intermediate state S+? As shown in the figure, the answer largely depends on what the background state is. and where the background level is around this region.
If this peak-like structure indicates the formation of S+, then the major decay will be , because the structure appears only in the “fast ” triggered spectrum. To make the existence clear, we need to study the spectrum in more detail by analyzing the hyperon motion.
5 Neutron spectra selected by the hyperon motion
The most simple way to detect the hyperon motion is by a vertex inconsistency between the two tracks of an incoming kaon and an outgoing trigger particle (so called distance-of-closest-approach). In the present case, however, the hyperon and the neutron motions are asymmetric in many reactions (see Fig. 4). For a further analysis, let us introduce a scalar product, , where is the vector from the kaon trajectory to that of the charged pion at the minimum distance, and is the normalized vector of the detected neutron.
Fig. 5 shows the distribution of “fast ” triggered events having NC-detected neutron momenta 400 MeV/. For a comparison, the decomposed spectra obtained by a simulation are shown. As shown in the simulation, and roughly distribute symmetrically on opposite sides.
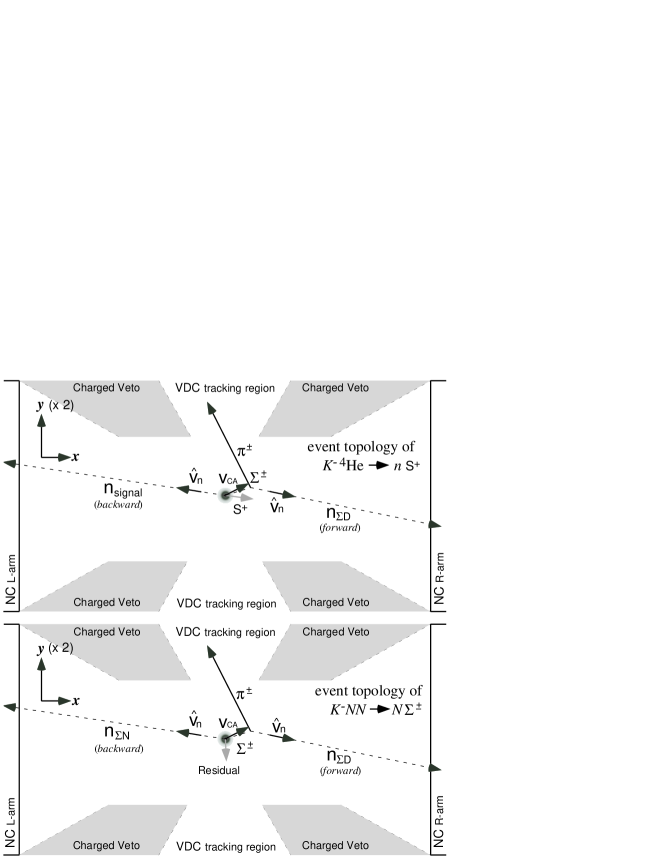
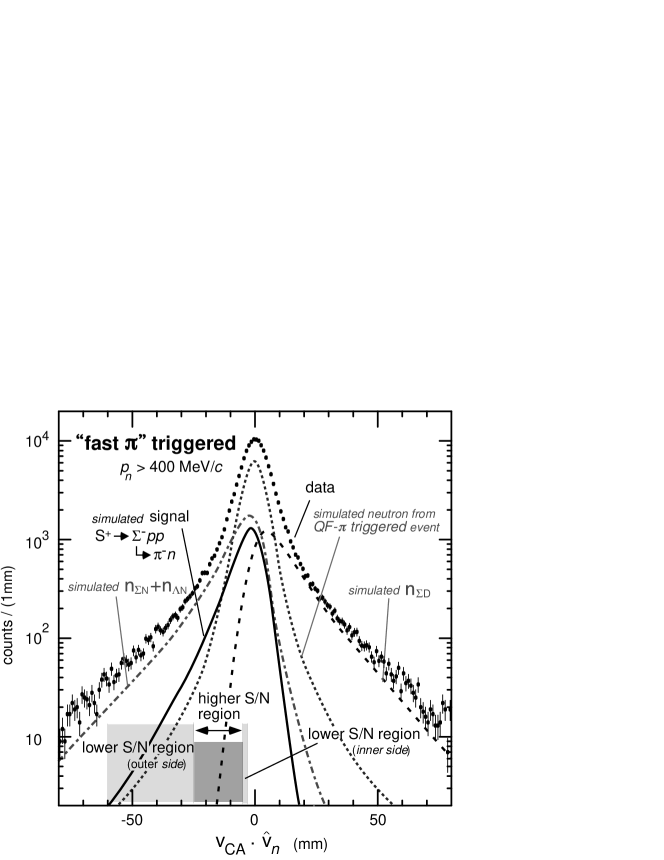
If the peak-like structure obtained in Fig. 2 (lower right) is due to the formation of an intermediate state, S+, then it should be boosted opposite to the neutron with the same momentum, as shown in Fig. 4 (top). It should then decay dominantly to rather than , as is the case for S0, since we observe the structure only for a “fast ” triggered event. What is the centroid of the momentum of the decay ? We calculated the momentum, and found that it is about 450 MeV/ in the backward direction, while it is about 80 MeV/ in forward direction. Thus, the distribution for such events should be asymmetric and dominantly located on the negative side. This is the reason for the shape of the distribution of the simulated signal given in Fig. 5.
Unfortunately, there is no clear criterion about how to separate the signal from the background. Simple “forward” and “backward” comparisons may not be valid, because the yield and the spectral shape can also be weakly asymmetric between the “forward” () and “backward” () directions.
Therefore, we examined how to compare the event sets between higher S/N (HSN : indicated with arrow) and lower S/N (LSN : shallow hatched) regions, whose windows are defined as shown in the figure. HSN is defined to be where we expect a better signal-to-noise ratio than in the other regions. The reason why we sandwiched HSN in between the two LSN regions (inner and outer side), is to obtain an interpolation of the shape of the spectrum. It should be noted that both the spectrum shape and the statistics of the inner and outer LSN regions are different. If is close to zero, then the pion dominantly originates from the primary QF reaction, namely . If it is much apart from zero, the pion is dominantly from higher momentum hyperon decay, either from reaction (4) or (5), which results in larger yields of the higher momentum component in the neutron spectrum.
It should also be noted that the LSN data are free from the signal. In the case of the neutron spectra, the ratio of the signal yields between HSN and LSN is expected to be about 2 : 1 from the simulation, if we assume that is the major decay branch of S+.
6 Discussion and Conclusion
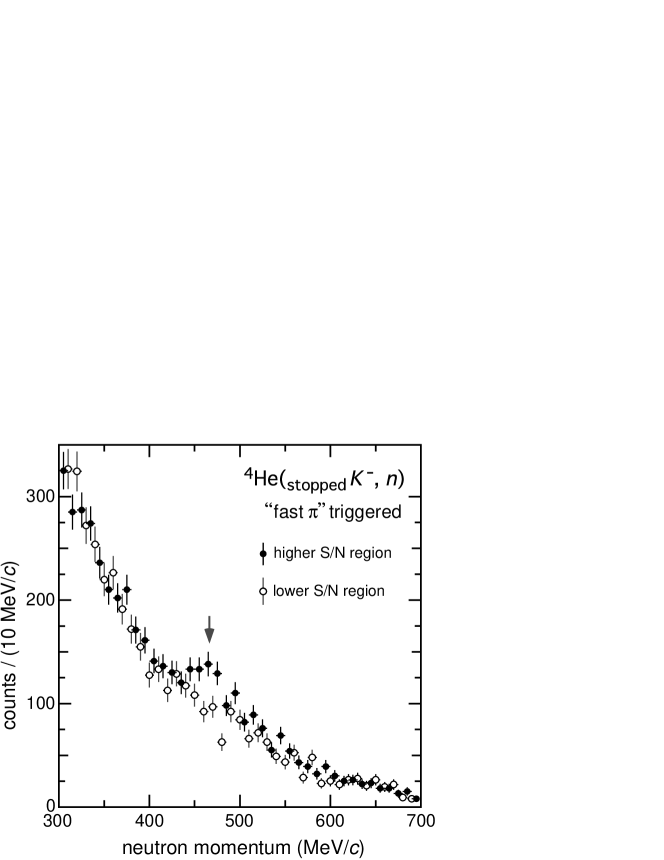
Fig. 6 shows a comparison of the two spectra. It exhibits a clear enhancement at around MeV/ in the spectrum of HSN, whereas it is smooth in LSN. Because the windows for HSN and LSN are rather arbitrarily defined, we also examined the stability of the enhancement by changing the cut region, and verified that it was nearly unchanged. The same spectra-shape comparison, whose windows were chosen to be symmetric to the present one in the positive side, was applied to check the validity of the comparison. We found no clear excess, as was expected.
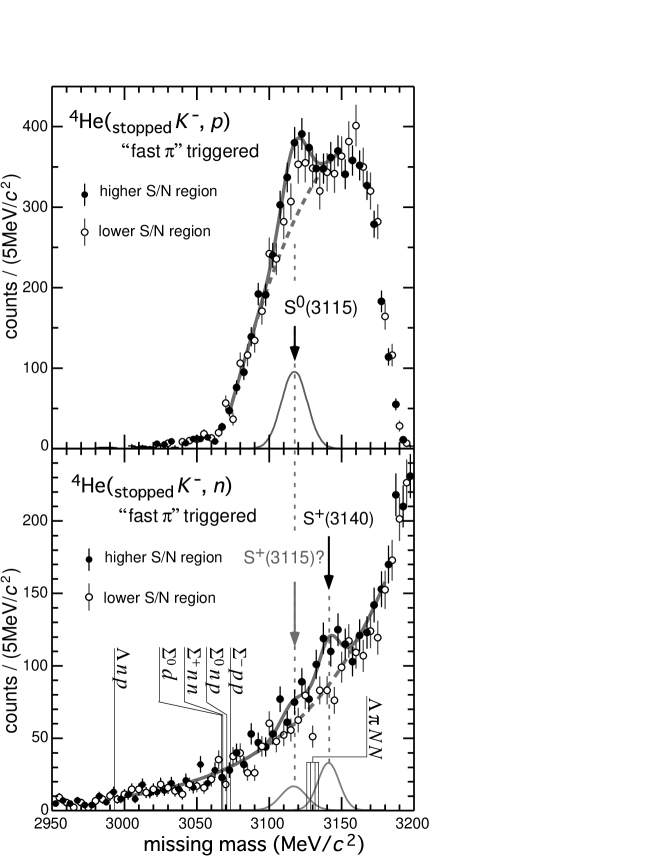
The missing-mass spectra both on HSN and LSN, obtained from the neutron data, are given in Fig. 7 (bottom). It shows that an enhancement exists at around the mass region from 3110 to 3160 MeV/c2. As a third and final examination, we applied exactly the same procedure to obtain the mass spectra from proton data, as shown in Fig. 7 (top). We fitted the data of the HSN, assuming a smooth background for both the proton and neutron spectra. The fit for the proton HSN spectrum (background shape of a third-order polynomial was used) gave a consistent result with that obtained in a previous paper [1].
The excess in the neutron spectrum seems to be rather broad compared to that in the proton spectrum. It is natural to expect the isospin partner of (3115) in this energy region; hence, we fitted the HSN neutron spectrum with two Gaussian functions together with a smooth background (a single exponential), as shown in the figure, while fixing the mass and width of one Gaussian to be the same as that of (3115). In the fit, data of LSN were not utilized to constrain the background shape/yield. Because the signal is expected to appear in both HSN and LSN at a ratio of 2 : 1, the background is expected to be located slightly below the LSN data. The result, however, is close to the data point of LSN, so that the fitted background slightly overestimated the yield in the region of interest.
It is obvious that the statistical significance of the isospin partner of (3115) is not enough to conclude its existence from the data itself. From the isospin rule, one can expect the formation ratio of the = 1 states between the neutron and the proton emission processes to be 1 : 2. The lower neutron detection efficiency makes the ratio to be about 1 : 10. If we assume that the decay branching ratio to the charged is the same from the two states, we expect the signal yield in the neutron spectrum to be about 1/10 of that in the proton spectrum, which is consistent even with the disappearance in the neutron spectrum.
On the other hand, concerning the main signal component, the fit gave an energy of 3141 3 MeV/, width of 17 5 MeV/ and a yield of 120 32 counts. By folding the systematic error and the experimental resolution, we obtained a mass and width of 3141 3 (stat.) MeV/ and MeV/ (95% ), respectively. The significance of this excess, evaluated from the area of the Gaussian signal and its error, is 3.7 . The observed excess indicates the formation of another strange tribaryon (denoted as S+(3140) hereafter), which lies about 25 MeV above S0(3115). Because of a lack of information about its decay branching ratio, we can not derive a reliable formation probability of S+ from the fitted yield. Based on simulations, the formation probability is below a few % per stopped ; otherwise, the peak should already be observed in the semi-inclusive neutron spectrum.
Since the mass of the signal is much different from S0(3115), and also the yield is larger than the expected one, it is unlikely to be its isospin partner. This state could be assigned to the predicted state, although the observed mass is much lower than the theoretical one (3194 MeV).
In summary, we have found an experimental indication of another strange tribaryon S+(3140) in the 4He(stopped-) reaction. Its isospin is likely to be = 0, and the major decay mode is S. The present finding provides additional information about the strange tribaryon system. The most important finding is that both S0(3115) and S+(3140) have much smaller masses (namely, much larger binding energies) than the theoretical values. If these strange tribaryons, S0(3115) and S+(3140), are indeed deeply bound kaonic states, then the huge total binding energies ( 200 MeV) naturally imply the formation of a cold and dense nuclear system [2, 6]. These findings provide important information about the interaction, and may provide rich information to understand the dynamics of a dense system, such as a strange star [7]. In such a system, a restoration of chiral symmetry can be realized, and quarks may be deconfined [8], which are more or less unknown as of today.
Acknowledgments
We are grateful to Y. Akaishi, R. Seki, D. Davis and G. Beer for fruitful discussions. We owe much to all the members of KEK-PS for their substantial cooperation. This work is supported by MEXT, KEK, Riken, KOSEF, NSF, DOE and KRF.
References
- [1] T. Suzuki et al., Phys. Lett. B 597 (2004) 263.
- [2] Y. Akaishi and T. Yamazaki, Phys. Rev. C 65 (2002) 044005.
- [3] M. Iwasaki et al., Nucl. Instrum. Meth. A 473 (2001) 286.
- [4] H. Outa et al., Prog. Theor. Phys. Suppl. 117 (1994) 177.
- [5] Chun-Ming Leung et al., Letters to Il Nuovo Cimento, 11 (1969) 389.
- [6] A. Dot, H. Horiuchi, Y. Akaishi and T. Yamazaki, Phys. Rev. C 70 (2004) 044313.
-
[7]
B. Freedman, L.D. McLerran, Phys. Rev. D 17 (1978) 1109;
G.E. Brown et al., Nucl. Phys. A 567 (1994) 937. -
[8]
T. Hatsuda and T. Kunihiro, Phys. Rev. Lett. 55 (1985) 158;
T. Hatsuda and T. Kunihiro, Phys. Lett. B 185 (1987) 304.