Experimental Signals of Phase Transition
Abstract
The connection between the thermodynamics of charged finite nuclear systems and the asymptotically measured partitions is presented. Some open questions, concerning in particular equilibrium partitions are discussed. We show a detailed comparison of the decay patterns in central collisions and in quasi-projectile events. Observation of abnormally large fluctuations in carefully selected samples of data is reported as an indication of a first order phase transition (negative heat capacity) in the nuclear equation of state.
8th International Conference on Nucleus-Nucleus Collisions, Moscow 2003
1 INTRODUCTION
In the last 20 years and especially in the most recent ones, considerable progress has been achieved both theoretically and experimentally in the investigation of nuclear reaction dynamics and thermodynamics in the Fermi energy regime [1].
From a theoretical point of view, strong efforts have been devoted to the understanding of the nuclear equation of state (EoS) either with transport theories or statistical approaches.
From an experimental point of view new generation detectors have been developed and are now operating at different accelerator facilities (Dubna, GANIL, GSI, LNL, LNS, MSU, Texas A-M). They are producing a huge amount of exclusive data and new kind of analyses. Very rich information has already been extracted from experimental studies on intermediate energy heavy ion collisions. Experiments have shown that the final state can be constrained to select the dynamics of the collision and isolate events that populate states closely compatible with equilibrium. Several investigations have demonstrated that excited nuclear systems produced in such collisions undergo in a short time scale (100 fm/c) bulk multifragmentation characterized by final states containing several Intermediate Mass Fragments (IMF, 3).
A considerable progress has been accomplished on the theoretical as well as on the experimental side in order to define and collect a converging ensemble of signals connecting multifragmentation to the nuclear liquid-gas phase transition [1] and locating it in the phase diagram of nuclear matter [2]. The opening of the high fragment multiplicity channel, the onset of collective expansion, the flattening of the caloric curves, the fossile signal of spinodal decomposition, a negative branch of the heat capacity, the bimodal distribution of exclusive observables and the finite size and Fisher law scalings have been observed and tentatively related to the Equation of State of the nuclear matter. The possibility of new radioactive beams (RIB) facilities is now prompting exciting theoretical advances of the isospin aspects of the EoS, like the density dependence of the symmetry energy and the modifications to the spinodal instability [1]. Experimentally, first studies on the dependence of the isoscaling parameters on the isospin of the decaying system [3] already started exploiting stable beams. These works seem to indicate an isospin distillation in asymmetric systems.
All these signals can be considered as circumstantial evidences of a phase transition, but some of them are still controversial and need to be further experimentally investigated before the phase transition can be definitely assessed. This work is a contribution to this aim, but only next generation experiments will allow to reach a comprehensive and detailed understanding of the phase transition and the nuclear EoS.
2 THERMODYNAMICS OF NUCLEAR SYSTEMS
2.1 EQUILIBRIUM PARTITIONS
In order to perform thermodynamical analyses, one has to collect a data sample which corresponds as closely as possible to an homogeneous population of the phase space. Data must be selected such as to isolate a portion of the cross section where the entire system (or the quasi-projectile) properties keep a negligeable memory of the entrance channel dynamics. This can be experimentally verified checking that for a given source the fragmentation pattern is determined by the size, charge, energy and average freeze-out volume solely, independent of the way the source has been formed, e.g. different impact parameters. In this case the thermodynamics we can access is a microcanonical thermodynamics with energy, number of protons and neutrons, and average volume as state variables. Indeed the excitation energy can be measured on an event-by-event basis by calorimetric techniques. For any shape of the excitation energy distribution the events can thus be sorted in constant energy bins, i.e. in microcanonical ensembles.
In the following we present thermodynamical studies performed on quasi-projectile events from peripheral 35 A MeV collisions [4] and central events from 25 A MeV , 25 and 35 A MeV and 35 A MeV collisions [5], measured at the K1200-NSCL Cyclotron of the Michigan State University with the MULTICS-MINIBALL apparatus.


Single source almost complete events have been selected with a constant value for the collected charge11190% of the total charge for central collisions and 90% of the projectile charge for peripheral events in each energy bin [4, 5]. The possible pollution from other sources has been minimized for central collisions through a shape analysis and in the case of quasi-projectile by substituting the backward light particle emission by the symmetric of the forward emission in the quasi-projectile reference frame. The observed event isotropy (Fig. 1) indicates that the directed flow component coming from a memory of the entrance channel is negligible.
The close similarity between statistical models [6] and data [4, 5], together with the isotropy of fragment emission, already suggest that these sets of data are close to a statistical equilibrium.


To progress on this point, we can also compare different data sets. Central events correspond to a narrow distribution of the excitation energy, while the quasi-projectile data supply a widely spread excitation function. Therefore it is possible to find for these data sets common values for the energy deposited in the source and to compare charge distributions and charge partitions. In the left four panels of Fig. 2 the charge distribution of all the reaction products, but the largest one, masured for central events at 25 A MeV, at 25, 35 A MeV and at 35 A MeV (top left, top right, bottom left, bottom right panels, respectively) are compared to the quasi-projectile distributions at the same excitation energy. The calorimetric values of the energy deposited in the systems cover a wide range. Indeed their values are 1.6, 3.1, 4.7 and 7.4 A MeV, respectively. Moreover, the comparison among the charge distributions of the heaviest fragment in each event (Fig. 2) allows to check the scaling of higher moments like the variances, even in more detail.
A very good scaling behaviour is also obtained by comparing the presented sets of data and the charge distributions measured by the FASA collaboration for the reactions at 8.1, 4 and 14.6 GeV [7] and by the Indra collaboration for reaction at 32 A MeV incident energy [8].
The remarkable scaling between different sets of data means that these data samples can be analyzed, at least in a good first approximation, within statistical microcanonical methods.
2.2 PSEUDO-CRITICAL BEHAVIOUR IN NUCLEI
Since the early 80’s, size distributions have been fitted with power laws [9], and more sophisticated critical analyses have been performed following theoretical concepts coming from percolation theory. More recently, an astonishing good scaling behaviour has been observed in the EOS data [10] and tentatively associated to the critical point of the nuclear liquid-gas phase transition expected to occur in nuclear matter in the framework of the Fisher droplet model [11]. The debate on the order of the transition has been further animated by a very recent analysis of the EOS and Isis data [12] which shows a high quality scaling of the fragment size distribution over a wide range of charges and deposited energies with an ansatz for the scaling function taken from the Fisher droplet model. The Fermi gas ”critical” temperature (about 8 MeV) extracted in these papers is identified as the temperature of the thermodynamical critical point and the whole coexistence line of the nuclear phase diagram is reconstructed under the assumption that the Fisher model gives a good description of the multifragmentation phenomenon [12]. In this interpretation, multifragmentation would correspond to the critical point of the nuclear matter EoS (with a lower temperature due to finite size and Coulomb effects), i.e. to a second order phase transition.
However, the experimental observation of a flattening of the caloric curve [2, 13] and recent studies [14] in the framework of the SMM model [6] (in which the resulting critical temperature is about 20 MeV) point rather to a first order phase transition, and this is also suggested by other thermodynamical statistical multifragmentation models [15].
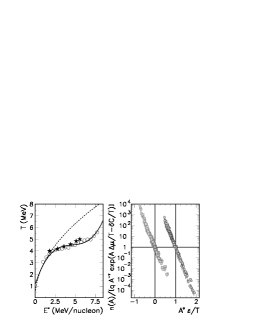
One may also wonder what physical meaning can be attributed to a Fermi gas estimator of the temperature at excitation energies of several A MeV. Indeed for the quasi-projectile data we are discussing, the temperature, evaluated from an isotope and a kinetic energy thermometer [16], strongly deviates from the Fermi gas ansatz (left part of Fig. 3).
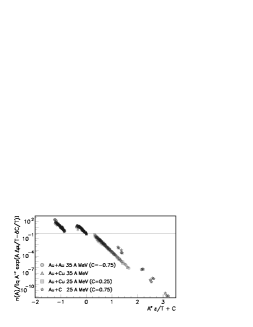
Surprisingly enough, a comparable quality of scaling (Fig. 3) and a consistent set of critical exponents can also be extracted from the QP data samples, for which the heat capacity evaluation points to a first order phase transition [4, 16], and the quality of the scaling does not depend the ansatz adopted for the parameter. The same ansatz for the scaling function applied to central events [5] gives similar exponents and points to the same critical-like energy.
However, critical exponents and scale invariance are compatible with many different physical phenomena and are not necessarily linked to a thermodynamic second order phase transition [17]. In particular the observed signals of critical behavior can be compatible with a first order phase transition, since in different statistical models size distributions that mimic a scale invariant behavior are observed inside the coexistence zone of small systems [18]. This means that scaling per sé does not demonstrate the existence of a phase transition, and even less defines its order or allows to localize the system on the phase diagram.
On the other hand, the fact that all the analyzed reactions behave as a universal multifragmentation process independent of the entrance channel and directly correlated with the available energy only, is a strong indication of a microcanonical equilibrium.
3 MULTIFRAGMENTATION AND SIGNALS OF PHASE TRANSITION
It has been shown [19] that for a given total energy the average partial energy stored in a subsystem of the microcanonical ensemble is a good thermometer while the fluctuations associated to the partial energy can be used to evaluate the heat capacity. An example of such a decomposition is given by the kinetic and the interaction energies. In particular first order phase transitions are marked by singularities and negative heat capacities [15, 19], corresponding to fluctuations anomalously larger than the canonical expectation. If the system is in statistical equilibrium, a measurement of anomalous fluctuations at a given energy is an unambiguous proof of a thermal first order phase transition.
Experimentally, the total energy deposited in the system can be evaluated event by event by calorimetry. If one is also able to reasonably estimate for multifragmentation data the relation between the measured charge and mass of the reaction products and the value of the freeze-out volume, one can obtain the event-by-event Q-value and the Coulomb energy, and thus the interaction energy, according to:
| (1) |
where M is the total multiplicity, () are the mass excess of the primary products (of the source). The interaction energy fluctuation can then be studied as a function of the total energy and the heat capacity can be evaluated according to:
| (2) |
where is the fluctuation of the interaction energy from Eq.(1), is the temperature, and is the kinetic heat capacity that can be evaluated by taking the numerical derivative of with respect to . Eq.(2) shows that a negative heat capacity corresponds to partial energy fluctuations in the microcanonical ensemble that exceed the corresponding fluctuations in the canonical ensemble ().

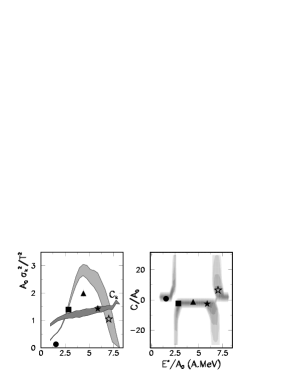
The average freeze-out volume can be determined [16] from the detected fragment kinetic energies through a many-body Coulomb trajectory calculation (Fig. 4). For the sets of data here presented, a volume close to three times the normal volume reproduces the measured kinetic energies. Only for the central collisions, the interplay between the Coulomb energy and the radial flow (about 1 A MeV) gives an uncertainty in the determination of the freeze-out volume. Indeed, the fragment kinetic energies would also be compatible with zero radial flow and an increased Coulomb repulsion from a more compact configuration. This ambiguity, however, does not affect our main conclusions, as is evident from the results shown in Fig.5.
An estimator of the microcanonical temperature can be obtained by inverting the kinetic equation of state:
| (3) |
The unknown parameters of Eq.(3) are the average side feeding correction on the fragment masses , and the level density parameter of primary fragments. Since the Coulomb energy is positively correlated with the charged products multiplicity, the value obtained for the freeze-out volume in each excitation energy bin depends on the side feeding correction. This means that and the percentage of evaporated particles have to be fixed consistently with an iterative procedure. When this is done [16], we find that the microcanonical temperature, evaluated through Eq.(3) results in agreement with the measured isotope temperature (left panel of Fig. 3).
In order to minimize spurious fluctuations due to unmeasured quantities, a constant side feeding correction is applied in each excitation energy bin, and no volume fluctuations are allowed [16]. The partial energy fluctuation overcomes the canonical expectation approximately at the same values of for peripheral and central collisions data. The same thing is true for central collisions from 32 to 50 A MeV, measured with the Indra device [16]. Therefore, the different data sets are fully compatible, the results do not depend neither on the detector, nor on the data selection.
It is however important to stress that the quantitative study of nuclear thermodynamics is still at the first stage. Only systematic studies of correlated observables, performed with
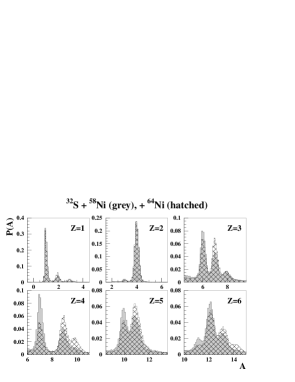
sophisticated experimental devices, with low energy threshold, high granularity and isotopic resolution will bring a detailed understanding of the phase transition and will allow to locate the position of the observed multifragmentation in the phase diagram of nuclear matter [1, 2]. Recent investigations on the opening of the multifragmentation channel, on the caloric curve and on the limiting temperature for systems started at moderate incident energies ( 15 A MeV) at INFN Laboratori Nazionali di Legnaro with the Garfield apparatus. First results [20] indicate that already at an excitation energy about 3 A MeV, multifragmentation events with nearly equal size fragments represent a non negligible fraction of the decay channels. The very good mass resolution of the Garfield Si-CsI telescopes (Fig.6) allows an isotope analysis. The dependence on the isospin of the entrance channel is apparent. Isoscaling analyses, now in progress, will bring information on the isospin distillation at the onset of the multifragmentation [3].
The authors would like to thank Garfield collaboration for kindly providing preliminary results.
References
- [1] P. Chomaz, Nucl. Phys. A 685 (2001) 274; Proceedings of INPC2001, AIP Proceedings Vol.No.610 (2002) 167.
- [2] J.B.Natowitz et al., Phys. Rev. C 65 34618, (2002).
- [3] E. Geraci, contribution to this Conference and Nucl.Phys.A (to be published).
- [4] M.D’Agostino et al., Nucl.Phys. A650 (1999) 329.
- [5] M.D’Agostino et al., Nucl.Phys. A724 (2003) 455.
- [6] J. P. Bondorf, A. S. Botvina, A. S. Iljinov, I. N. Mishustin, K. Sneppen, Phys. Rep. 257 133, (1995).
- [7] S. P. Avdeyev et al., Nucl.Phys. A709 (2002) 392.
- [8] M. F. Rivet et INDRA collaboration, Phys. Lett. B430 (1998) 217; G. Tabacaru et al. nucl-ex/0212018 and EPJA(2003) in press.
- [9] J. E. Finn et al, Phys. Rev. Lett. 49, 1321 (1982); Phys. Lett. B118, 458 (1982); A.S.Hirsch et al, Nucl. Phys. A418, 267 (1984); M.Mahi et al, Phys. Rev.Lett. 60, 1936 (1988); A.D.Panagiotou, M. W. Curtin, H. Toki, D. K. Scott and P. J. Siemens, Phys. Rev. Lett. 52, 496 (1984); X. Campi, J.Desbois, E.Lipparini, Phys.Lett. 138B, 353 (1984).
- [10] J.B.Elliott et al., Phys.Lett. B418, 34 (1998); R.P.Scharenberg et al., Phys.Rev.C64 054602, (2001) .
- [11] M. E. Fisher, Physics Vol. 3 (1967) 255.
- [12] J.B.Elliott et al., Phys.Rev.Lett. 88 (2002) 042701; Phys.Rev. C67 (2003) 024609.
- [13] J. Pochodzalla et al, Phys. Rev. Lett. 75, 1040 (1995).
- [14] V. A. Karnaukhov et al., Phys. Rev. C67R (2003) 011601; R. Ogul and A. S. Botvina, Phys. Rev.C 66R (2002) 051601.
- [15] D.H.E.Gross, Phys.Rep. 279 (1997) 119, Zeit. fur Phys. D39 (1997) 75.
- [16] M.D’Agostino et al., Phys.Lett. B473 219, (2000), Nucl. Phys.A699 795, (2002).
- [17] X. Campi, Phys. Lett. B208, 351 (1988); X.Campi, H.Krivine, Zeit.Phys. 344A 81, (1992); X.Campi, H.Krivine, N.Sator, Nucl.Phys. A 681 458, (2001).
- [18] F.Gulminelli, Ph.Chomaz, Phys.Rev.Lett. 82 1402, (1999); Int.Journ.Mod.Phys.E 8 1, (1999); C. B. Das, S. Das Gupta and A. Majumder, Phys. Rev. C65 34608, (2002); C. B. Das et al., Phys. Rev. C66 (2002) 044602; J. M. Carmona, J. Richert, P. Wagner, Phys. Lett. B531 71, (2002); A.H.Raduta et al., Phys. Rev. C 65 (2002) 034606.
- [19] Ph. Chomaz and F. Gulminelli, Nucl. Phys. A647 (1999) 153.
- [20] F. Gramegna et al., Fizika B 12 (2003) 39.